
Examining California's Income Tax Withholding Growth by Sector
June 9, 2021
Bottom Line: While high-tech firms have played a big role, the recent increase in California income tax withholding has been broad-based. Most sectors of the economy generated much more withholding in late 2020 than in late 2019, with increases in average withholding per employee typically more than outweighing declines in employment.
California employers are required to make regular income tax withholding payments for their employees, which can provide a real-time indication of the direction and magnitude of the aggregate change in the employers’ payrolls. Most withholding payments are for employees’ wages and salaries, but withholding is also due on bonuses and stock options received by employees. The income tax withholding program is administered by the state Employment Development Department (EDD).
As our office has documented, withholding growth has been surprisingly strong since the middle of 2020 despite the sustained drop in employment resulting from the COVID-19 pandemic. Our office recently received data from EDD breaking out quarterly withholding data by sectors of the economy as defined under the federal North American Industrial Classification System (NAICS) through the end of 2020.
The figure below shows the ten sectors that saw the biggest dollar increases in withholding from the 4th quarter of 2019 to the 4th quarter of 2020. All of them had considerably bigger year-over-year increases from 2019 to 2020 than they had from 2018 to 2019. The purple circles on the right show the average withholding amount per employee in the sector, with larger circles meaning more withholding. The professional and technical services sector shows the largest increase, but this is partly an artifact of the NAICS system: all of the subsectors of professional and technical services (which has 1.34 million employees in California) are contained in a single 3-digit NAICS code. In contrast, manufacturing (which has 1.25 million employees in the state) is split among 21 different 3-digit NAICS codes, including the computer equipment and vehicles/aircraft subsectors that both made the top ten.
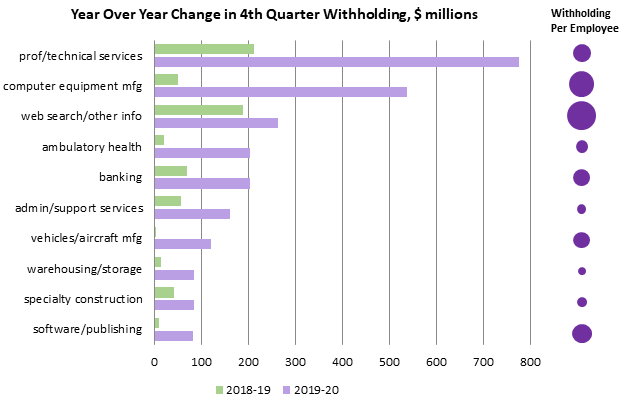
The list of highest gaining sectors supports the notion that high-tech firms are responsible for much of the increase in withholding. Professional/technical services, computer equipment, web search, and software all make the list, and we note that the vehicle sector includes Tesla and that the warehousing sector includes many Amazon facilities.
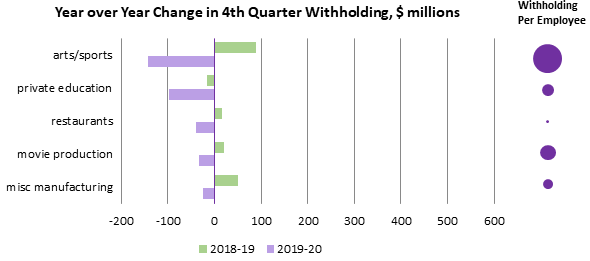
The next figure follows the same format but shows the five sectors with the largest declines in withholding from the 4th quarter of 2019 to the 4th quarter of 2020. With the exception of miscellaneous manufacturing, activity in all these sectors was largely shut down by the pandemic and had recovered only modestly by the end of 2020. The arts/sports sector had the highest withholding per employee of any sector in 2020, while the restaurant sector was among the lowest.
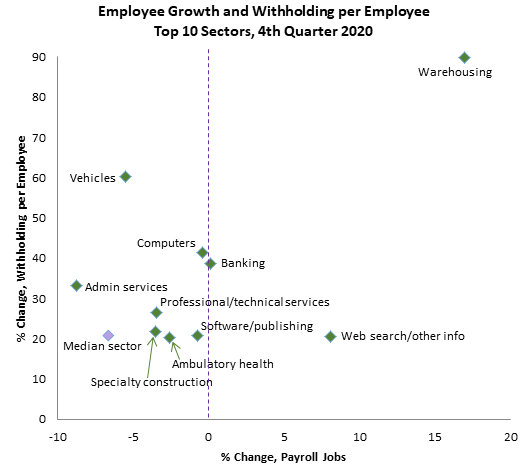
The next figure breaks down the percent increase in the biggest gaining sectors’ withholding between the change in jobs and the change in withholding per employee, and also shows the statewide median employment growth (-6.7 percent) and withholding per employee (+20.8 percent) among the 75 sectors which had at least 10,000 employees and had no serious data irregularities. Some of the high-gaining sectors such as web search made the top ten by adding jobs or at least losing proportionately fewer than the average sector, while others such as vehicles saw drastic increases in withholding per employee. All ten were above or near the median in withholding per employee.
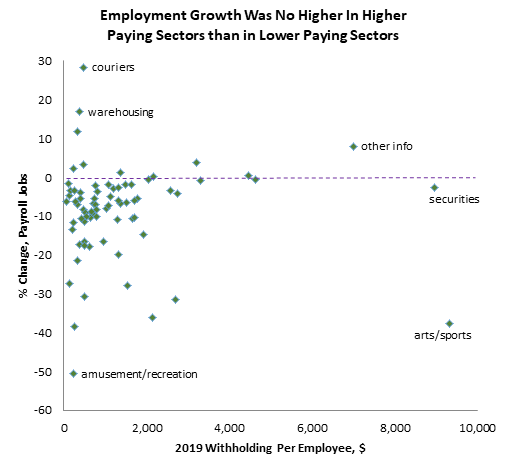
The next graph compares year over year job growth to average 2019 withholding for all 75 sectors mentioned above. There was no systematic relationship between a sector’s average withholding and its job growth. Six of the seven highest withholding (thus likely highest paying) sectors had above average job growth, yet the highest withholding sector (arts and sports) lost more jobs than all but two other sectors. It is well documented that lower-paid workers have endured proportionately greater income losses than higher-paid workers have during the pandemic recession. These data suggest that this disparity has mainly arisen within sectors as opposed to between them.
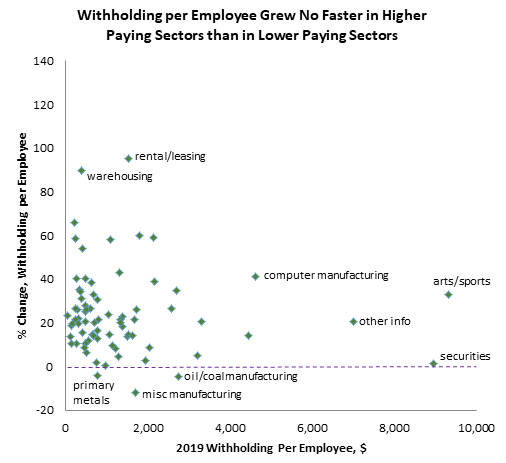
The final chart compares 2020 withholding growth to average 2019 withholding for the same 75 sectors. Again, there was no systematic relationship between 2019 withholding and 2020 growth, and in fact the correlation was slightly negative. Just three of the 75 sectors recorded declines in withholding per employee, all within manufacturing: oil and coal products, primary metals, and miscellaneous manufacturing.
In conclusion, the surprising increase in withholding in California since the middle of 2020 has not been driven solely by a handful of high-paying sectors. Instead, it appears to result largely from increased withholding per employee over a broad range of sectors. Collections of final PIT payments for tax year 2020 in April and May were reasonably high, and refunds were not especially high. This suggests that overwithholding by employers was not significant. Withholding collections in 2021 have showed no signs of slowing to date, and it remains to be seen how long this surge will continue.