
Capital gains are one of the most volatile major elements of California's state General Fund revenues. These gains are generated from selling an asset (like stocks or a home) at a price greater than its original purchase price. California essentially taxes net capital gains (with some capital losses able to offset realized gains in a particular year) through its personal income tax. The state has recognized the significance of this capital gains revenue volatility through a constitutional amendment (Proposition 2) that sets aside some capital gains for reserves or accelerated debt payments in years when income taxes on these capital gains exceed 8% of General Fund revenues, as they have in recent years.
Historical Volatility
Capital Gains Volatility Over Time in California. The figure below illustrates the trend of California residents' taxable net capital gains (that is, the total amount of those gains reported on tax returns) from 1997 to 2014. Capital gains go way up when the stock market is strong (as it was around 2000, in the mid 2000s, and recently), and they dip when the stock market is weak (as it was after the "dot com" bust and in 2009). In 2014, the most recent year for which hard data is available from the Franchise Tax Board, residents' net taxable gains reached $115 billion.
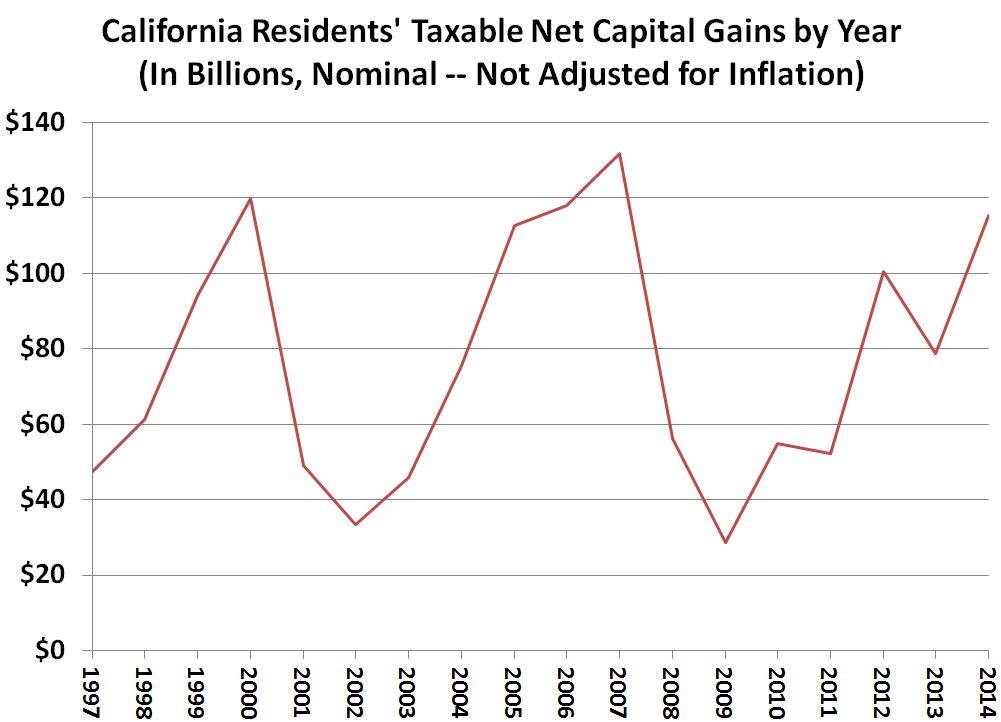
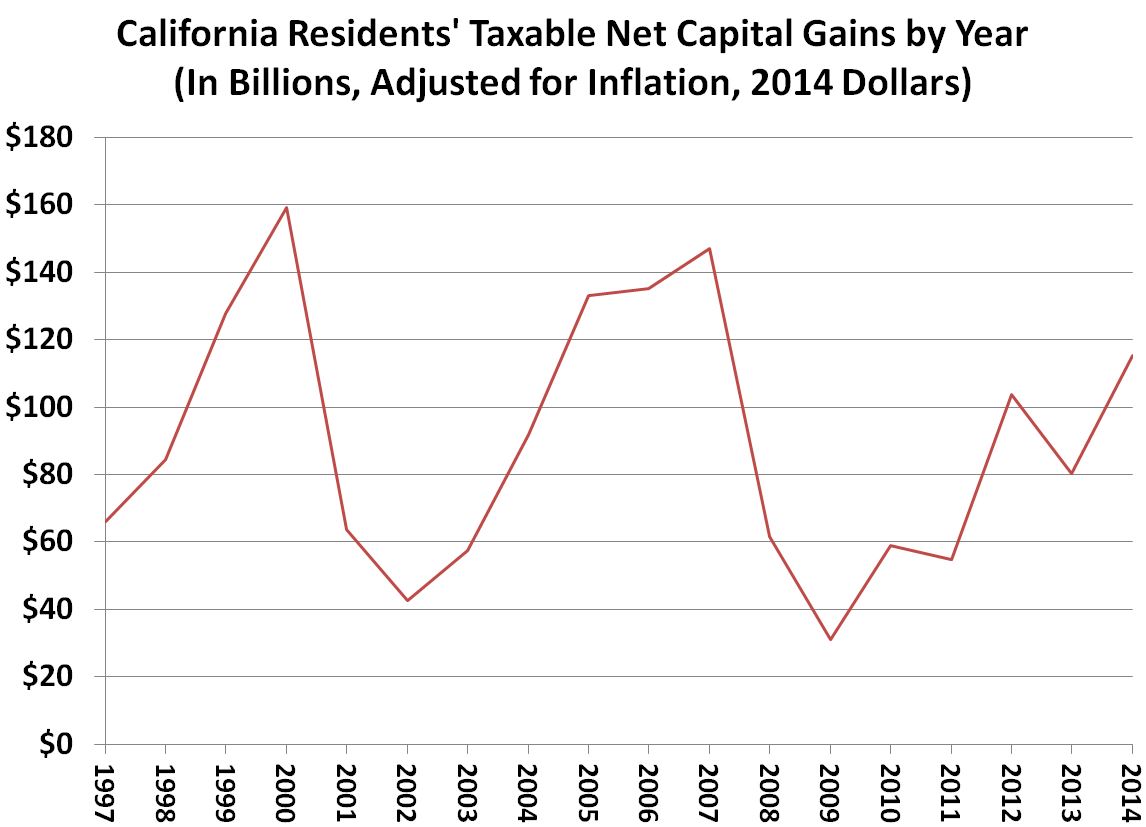
The figure above is not adjusted for inflation. When adjusted for inflation (and measured as "2014 dollars"), the trend line looks different, in that 2014 net capital gains remain quite a bit below their historical peaks during the "dot com" boom and the mid-2000s. The inflation-adjusted trend line is shown below.
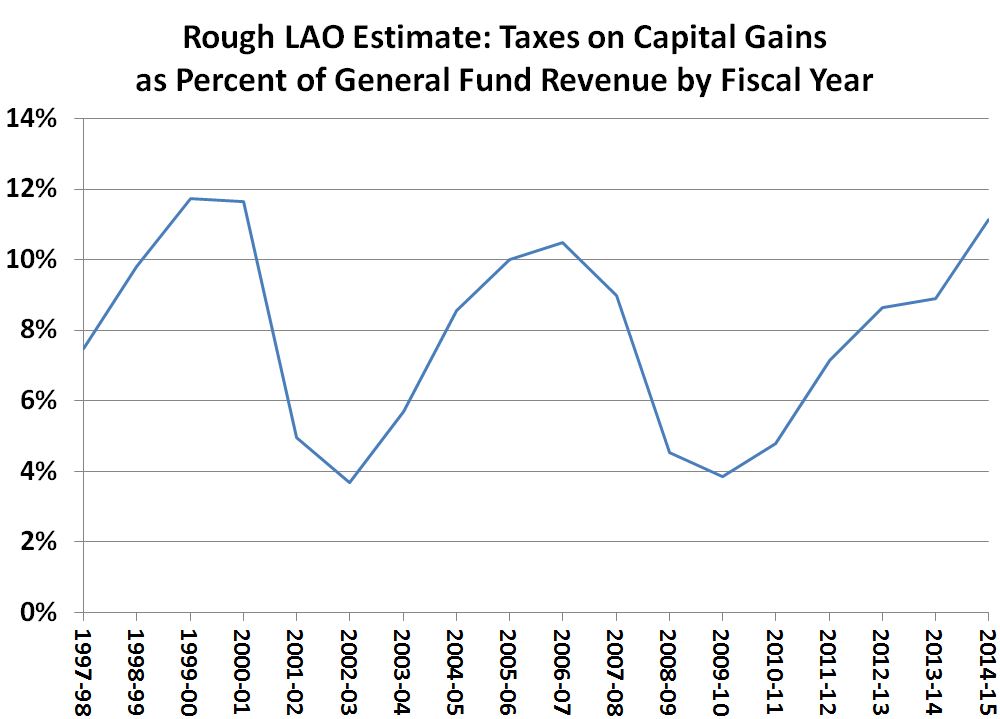
Income Taxes on Capital Gains Over Time. Another way to think about adjusting this data series over time is to consider how big a share of the state General Fund is made up of personal income tax revenues generated by residents' capital gains. There are various ways one can estimate capital gains-related income tax revenue by fiscal year. Below, we show one such method (for 2015, we use our office's recent May Revision estimates for 2015 capital gains, hard data for which is not yet available). Since 1997, under this estimating method, capital gains-related income taxes have averaged 7.9% of General Fund revenues. (This is close to the 8% threshold in Proposition 2, as mentioned above.) Illustrative of the volatility of capital gains, however, these taxes have equaled an amount between 7.4% and 8.4% of General Fund revenues (the average listed above plus-or-minus 0.5 percentage points) only once during this period: in 1997-98. In every other fiscal year, under this estimating method, they have either been (1) at 7.1% or less of General Fund revenues (as they have been in seven different years) or (2) at 8.6% or more of General Fund revenues (as they have been in 10 different years). In short, taxes on capital gains tend to make up an above-average share of the General Fund or a below-average share; they rarely approximate their long-term average share of the General Fund.
2016 May Revision Estimates and Assumptions
Assumptions About Stock Prices. Every California state budget must make assumptions, either explicitly or implicitly, about the future direction of the stock market in order to make an estimate of what personal income taxes will be in future years. In the case of our office, in recent years, our office has generally assumed slow, but steady, growth of stock prices over the next few years in our economic growth scenario. This is not a prediction that such growth will occur, as we note in describing our May Revision economic growth scenario. In fact, such slow, steady growth almost certainly will not occur. In reality, stock price trends are much more volatile from month to month and year to year, and this is the key reason why capital gains trends have been as volatile as shown above.
Our economic growth scenario summary table displayed our broad assumptions about S&P 500 (stock price) index trends through 2018. A separate table here also compared our S&P 500 assumptions with those in the administration's multiyear economic forecast. (In our tables, we display the average of the four quarterly average index levels for the S&P 500 for each calendar year.)
Translating Stock Price Assumptions Into Capital Gains Estimates. Statistical analysis shows that changes in stock prices explain about 55% of the annual change in California's resident capital gains. For this reason, once we have our economic scenario assumptions about stock prices, we use a statistical model to estimate what those assumed stock market changes would mean for capital gains in California over the next few years. Below, we display our multiyear estimates of resident taxable capital gains, as well as the administration's over the next few years beginning with 2015.

One key difference between the administration and LAO figures above is that we currently have different working theories about the amount of taxable capital gains of residents in 2015. 2015 has already ended, and in fact, as of mid-April, the vast majority of residents' tax payments for 2015 were already received by the state. Yet, high-income taxpayers will be filing their 2015 extension returns with important information on their capital gains over the next several months. As a result, we will not have hard data on 2015 capital gains until next year, perhaps. Because our overall revenue estimates are fairly close to the administration's now, the fact that we think that there were more capital gains in 2015 means that the administration thinks that some other income components were stronger that year than we do. This sort of difference is normal, but as suggested above, the difference in our 2015 estimates of capital gains may generate a portion of the difference in our projections of future capital gains too.
Translating Capital Gains Projections Into Proposition 2 Estimates. Previously, we provided estimates that showed how our office's estimates of General Fund taxes on capital gains—estimates that have to be developed under Proposition 2—differed from those of the administration. Under our economic growth scenario, for example, our office's estimate in this regard is that there will be $12.6 billion of General Fund taxes on capital gains in 2015-16 and $12.4 billion in 2016-17, while the administration estimates there will be $11.8 billion of such taxes in 2015-16 and $11.3 billion in 2016-17. (These calculations are conducted using the protocols developed for these Proposition 2 calculations by the administration over the last two years. This calculation method differs from other estimating methods for capital gains taxes described earlier in this post.) Again, since our overall revenue estimates for these years are similar to the administration's, this means that while our office projects more capital gains-related revenue, the administration projects more of some other types of General Fund revenue for 2015-16 and 2016-17.
Given our office's higher near-term estimates of capital gains, it is not surprising that our office estimates there will be more capital gains-related tax revenue, compared to the administration's estimates, in 2015-16 and 2016-17. As we discussed in the summary of our multiyear budget outlook, our higher estimates of capital gains, if adopted by the Legislature, would result in higher required levels of reserve funding and debt payments under Proposition 2.
Follow @LAOEconTax on Twitter for regular California economy and tax updates.