On Friday, May 22, the Employment Development Department (EDD) released preliminary California jobs data for the month of April 2015.
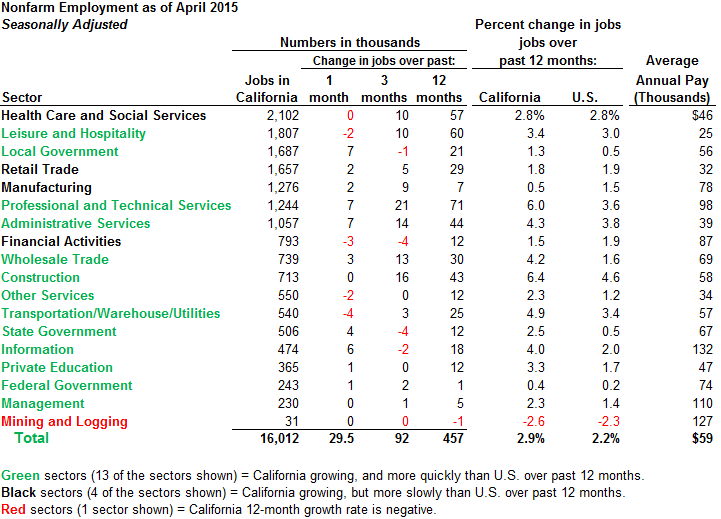
Key Data Points. The EDD jobs report showed that the state's official unemployment rate dropped from 6.5% in March to 6.3% in April. Nonfarm payroll jobs increased by 29,500 from March to April. Since April 2014, one year ago, nonfarm payroll jobs in the state are up by 457,300 (2.9%). As shown in the summary figure below, California's rate of nonfarm job growth over the past 12 months continues to outpace the nation's. Of the 18 job sectors we track on a monthly basis, California's rate of job growth surpassed the nation's over the past year in 13, which is similar to last month's numbers. The technology-heavy professional and technical services sector continues to show strong growth, as does construction.
Longer-Term Trends. Since July 2011, job growth in California has averaged about 37,000 per month. In terms of the average number of jobs gained, this type of job growth is comparable to that experienced during the "dot-com" period from early 1997 to late 2000. (The total number of jobs in the state is around 10% higher now than it was then, so the percentage growth in jobs was greater during the late 1990s.) A key difference is that there was not nearly as much slack in the state's labor market then, with statewide unemployment at 6.8% in January 1997 and 4.7% in December 2000. By contrast, in mid-2011, the state's unemployment rate was well over 11%, falling to under 7.0% only in early 2015. While the state's job market has climbed most of the way out of a very deep hole caused by the 2007-2009 recession, more job growth is needed to return to the low levels of unemployment of the early or mid 2000s.
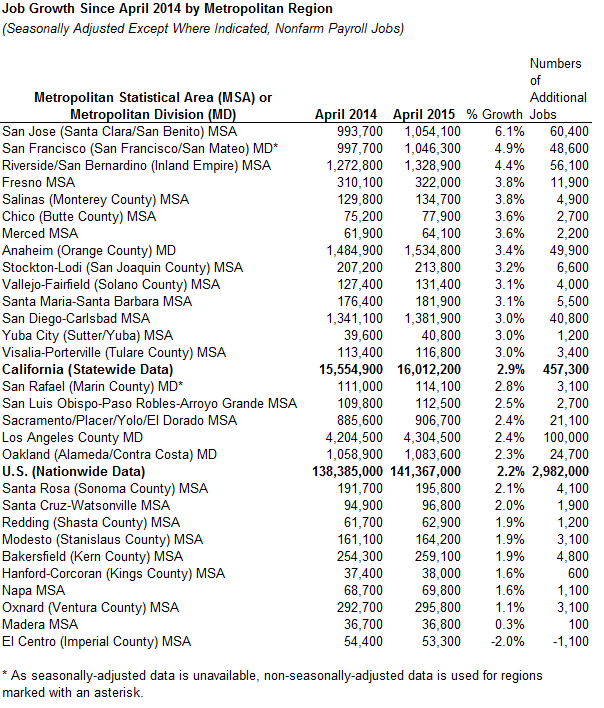
Regional Trends. Below, we show EDD data for job growth over the past year by metropolitan region. The Bay Area, the Inland Empire, Fresno, and Salinas (Monterey County) regions have led the state in their rates of job growth over that period. The El Centro region (Imperial County) has seen its total number of nonfarm payroll jobs drop by 2% on a seasonally-adjusted basis over the past 12 months.
EDD also prepares the map shown below, which shows job growth on a non-seasonally adjusted basis. It generally matches the trends shown above, with lighter colored regions reporting the fastest job growth over the past 12 months.
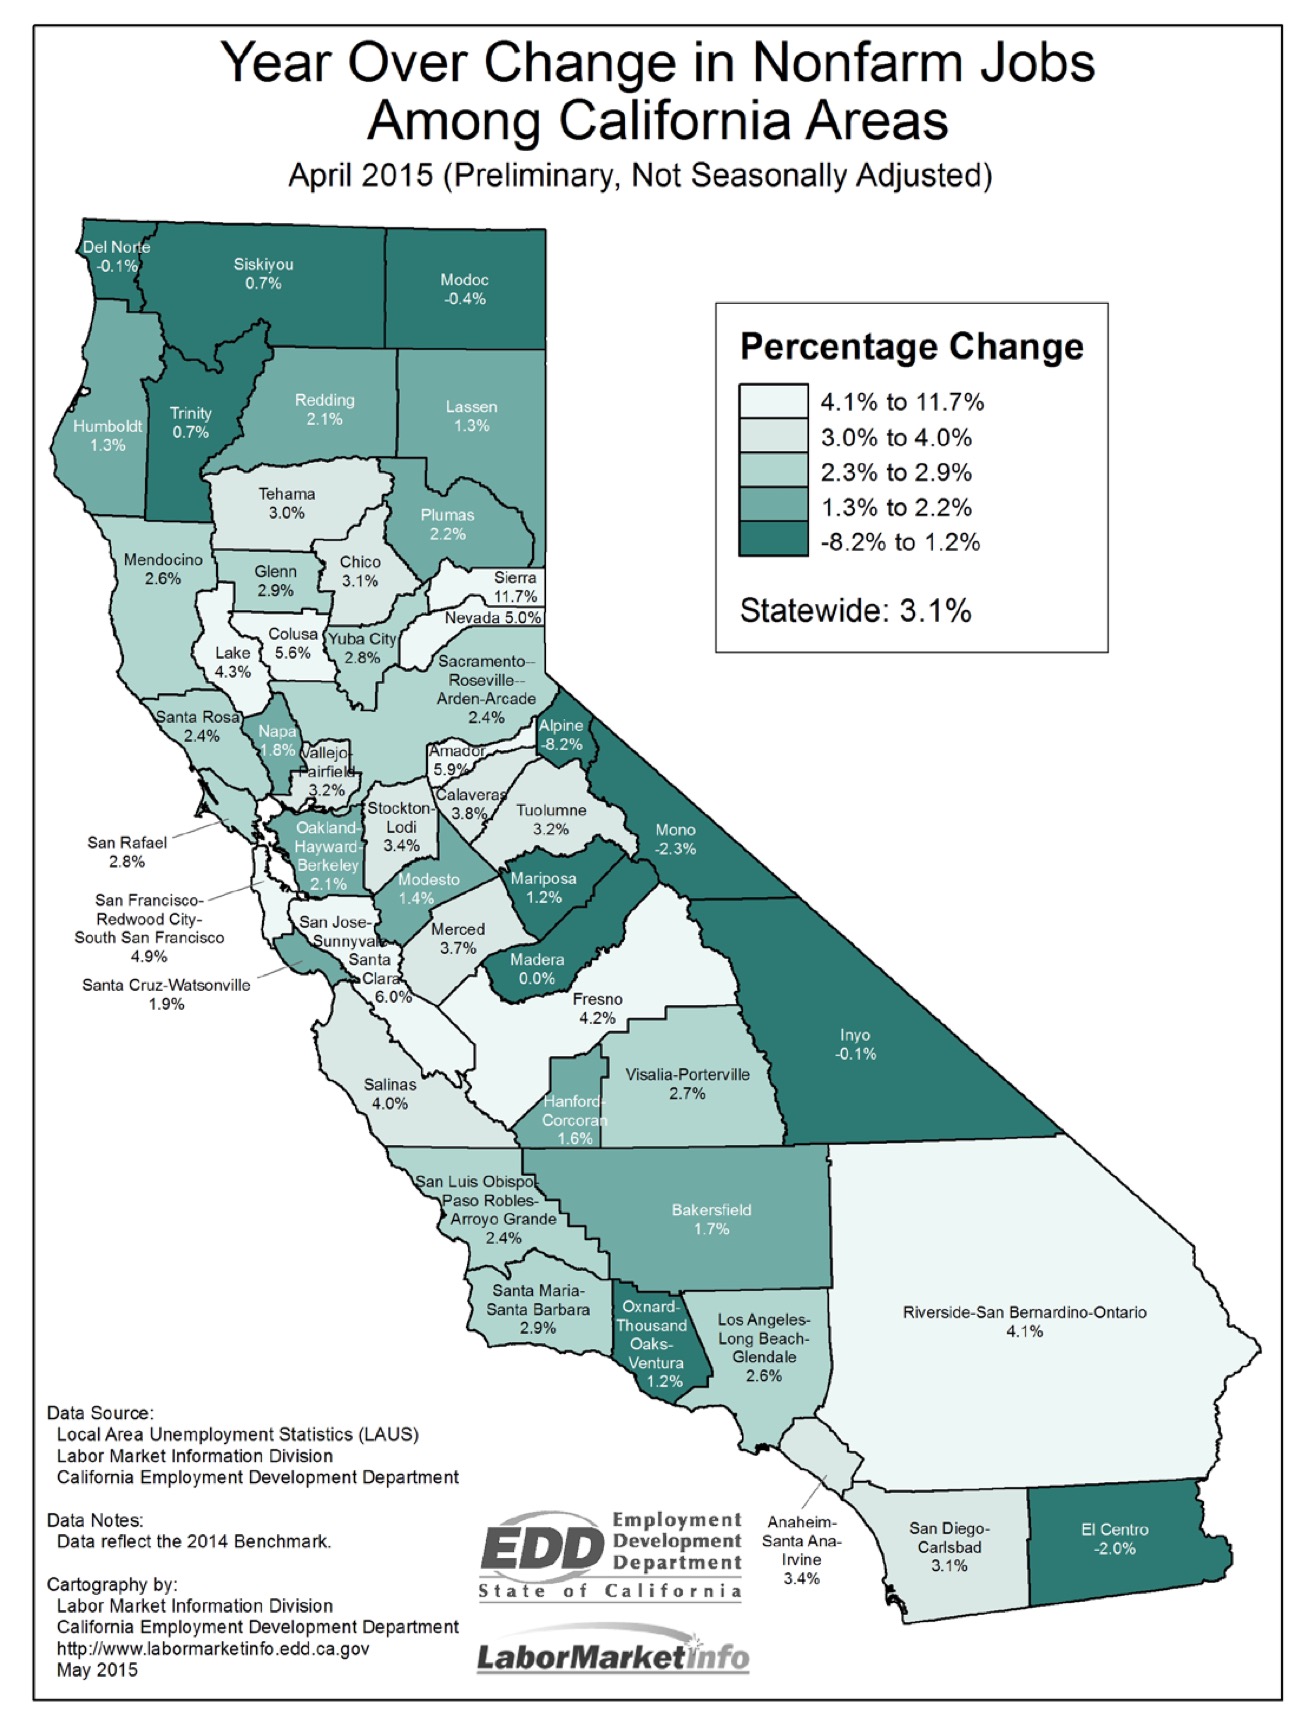
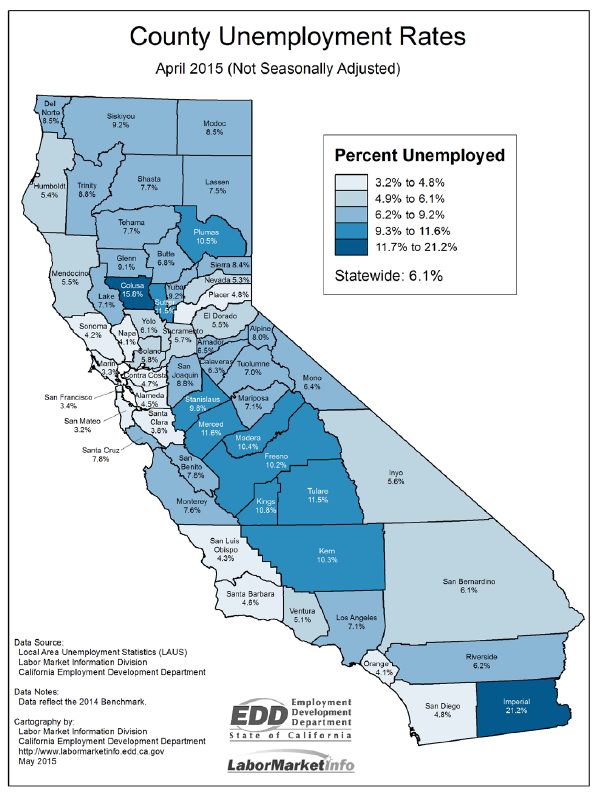
Unemployment continues to be elevated in much of the Central Valley and North State, as shown in the EDD map below. As shown in more detail here, on a non-seasonally-adjusted basis, unemployment rates in the state in April ranged from 3.2% in San Mateo County to 21.2% in Imperial County. The unemployment rate in Los Angeles County was 7.6% on a seasonally-adjusted basis and 7.1% on a non-seasonally-adjusted basis. (For the state as a whole, the unemployment rate was 6.3% on a seasonally-adjusted basis [the official unemployment rate] and 6.1% on a non-seasonally-adjusted basis.)
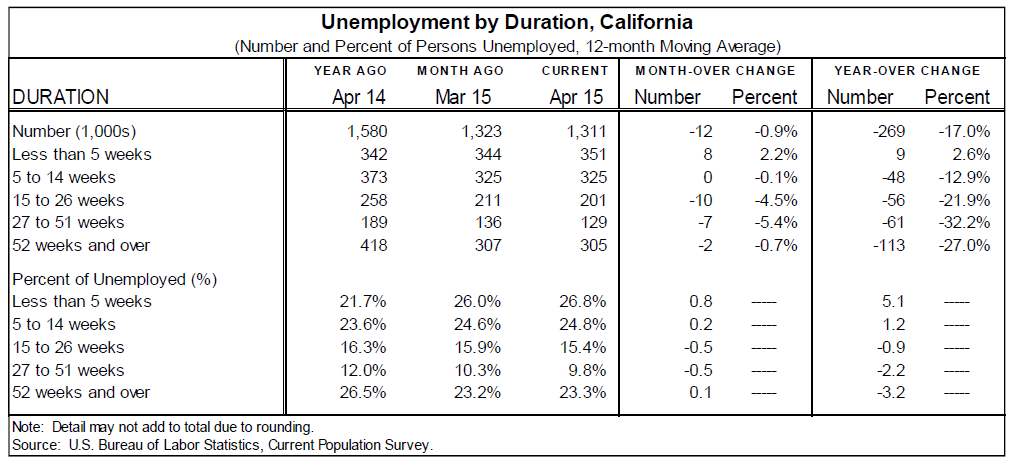
Other Job Market Metrics. As shown below, the prevalence of long-term unemployment in the state continues to drop. Over the past year, using a 12-month moving average, the number of Californians classified as unemployed for 27-51 weeks has dropped by 32.2%, while the number unemployed for 52 weeks or more has dropped by 27%. (The following tables are excerpted from EDD's monthly California Labor Market Review.)
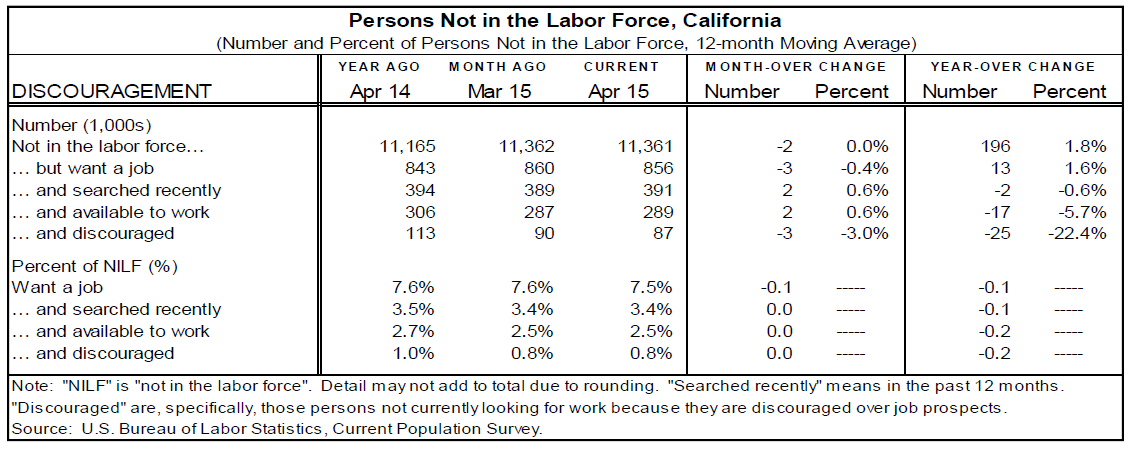
Unemployment statistics consider persons who are "in the labor force," including those who "were available for work" and made specific efforts to find a job during the last four weeks. As shown below, the number of those who are not in the labor force and not looking for work specifically because they are "discouraged over job prospects" has dropped by more than 22% over the past year. This is a good sign for the state's job market.
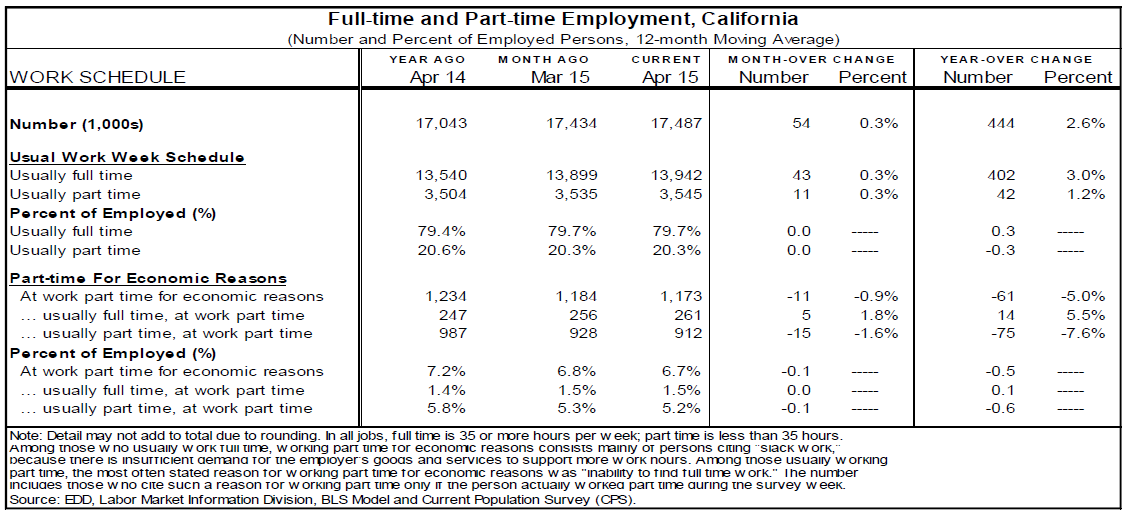
As shown below, over the past year, full-time employment growth has significantly outpaced part-time employment growth in the state.