
Bottom Line: Data provides a mixed message about the condition of the state’s economy. Some signs point to a weakening economy, while others continue to signal growth. Overall, while not imminent, the risk of a slowdown in the coming year appears higher than it has been for some time.
Knowing when the state’s next budget slowdown will happen is impossible. Many economic factors outside the state’s control influence state revenues. Despite this, certain data points can help us understand whether shifting economic conditions are likely to lead to growth or declines in state revenues in the coming months.
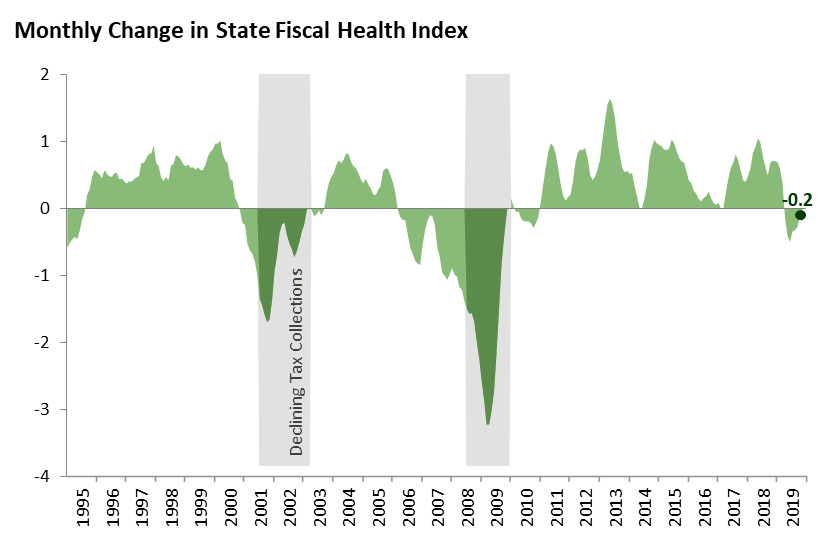
We created the State Fiscal Health Index to track the strength of economic conditions relevant to the state’s fiscal health. The index ranges from 0 (representing the lowest level in the last 25 years) to 100 (representing the highest level in the last 25 years). Both the level of the index and changes in the index from month to month offer information about the state’s fiscal health. When the index is high, revenues tend to be high compared to historical norms. Similarly, when the index is increasing, state revenues are likely to increase over the next six to twelve months. On the flipside, a consistent decline in the index over a few months has typically signaled that the state is entering an extended period of revenue weakness.
The figure below shows the index through November 2019. The index remained relatively high in November, above 95 percent of months in our historical record.
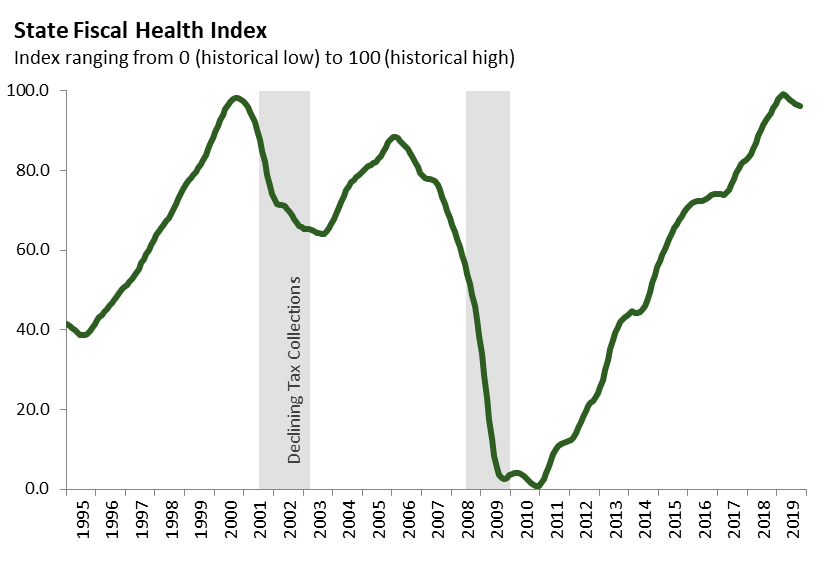
Although the index remains high, it has been declining since April. Declines of this duration and magnitude have not been observed since the last recession. Weakness in the index has been driven by several factors, including stagnate housing markets and slowdowns in trade activity (ports), consumer spending (new car sales), and business startup funding (venture capital).
Beyond our index, some economic indicators at the national level (such as manufacturing activity, goods transport, and hotel bookings) have been showing weakness in recent months. At the same time, other economic data, such as employment growth, continue to signal economic expansion. In addition, stock markets have seen robust growth.
Given that economic data is providing a somewhat mixed message—taken together with recent actions by the Federal Reserve to stimulate the economy—it is too soon to conclude that a broader economic slowdown is imminent. Nonetheless, the state’s fiscal outlook faces more risks than it has for some time.
The index combines ten key data points: home prices, home sales, residential and commercial building permits, the S&P 500 stock market index, venture capital funding, unemployment insurance claims, CalFresh claims, port traffic, and new car sales. With the exception of the S&P 500, all of this data is specific to California. An increase in these economics variables signals a more positive revenue situation, while a decline suggests a worsening revenue outlook. There are two exceptions to this pattern: claims for unemployment insurance and CalFresh. When claims for unemployment insurance and CalFresh decline this signals an improving revenue situation, while rising claims signal a worsening situation. The graph below shows the recent trends in these variables.

Note: Economic data are frequently revised following an initial release. In the coming months, we similarly may revise our index to reflect any changes in the underlying data.