
Property taxes affect the level of required state (as compared to local) spending for schools, as we discuss in our new Fiscal Outlook.
In May, we projected that assessed property values would grow by 6.6 percent in 2016-17. This expectation was based on robust growth in property market values in recent years—home prices have grown by nearly 60 percent since bottoming out in 2011—and a modest recovery in home and commercial construction. It appears, however, that assessed values grew slower than we expected. Data reported by counties to the State Board of Equalization shows that assessed values increased by only 5.5 percent in 2016-17.
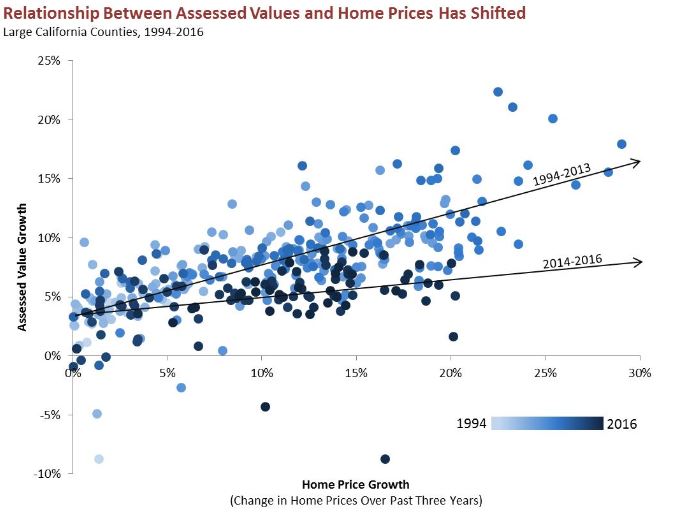
Why did growth fall below what our forecasting model expected? Uncertainty and the difficulty of forecasting any economic trend obviously played a role. It also appears that the relationship between assessed values and one of our model’s key predictors—home prices—has not conformed to the historic norm in recent years. The figure below shows this relationship for 24 large counties since 1994. (For the purpose of illustration, this figure shows only observations with positive home price growth.) In general, when home prices increase, assessed values rise. In the graphic, this is shown by the upward sloping lines, which are a statistical approximation of this relationship. This relationship, however, appears to have shifted significantly in the last few years. In particular, home price growth does not appear to be translating into as much assessed value growth as was true in the past. The slope of the 1994-2013 line is twice as steep as the 2014-2016 line, indicating that the amount of assessed value growth associated with a given amount of home price growth has dropped in recent years.
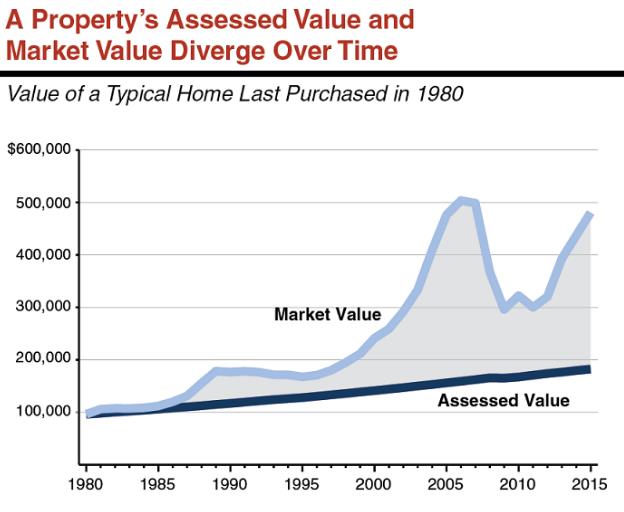
The causes of this trend are not immediately clear. One likely explanation is declining property turnover, particularly in high-value real estate markets. Under the property assessment rules created by Proposition 13, property turnover is critical to growth in the property tax base. Under Proposition 13, property taxes are based on a property’s purchase price. In the year a property is purchased, it is taxed at its purchase price. Each year thereafter, the property’s assessed value increases by 2 percent or the rate of inflation, whichever is lower. This process continues until the property is sold and again is taxed at its purchase price. Under this system, the assessed values of most properties fall below their market values in most years—as illustrated in the graph below—because market values usually grow by more than 2 percent per year. Consequently, without property sales—causing those properties’ assessments to reset to market value—increasing market values do not translate into growth in the property tax base.
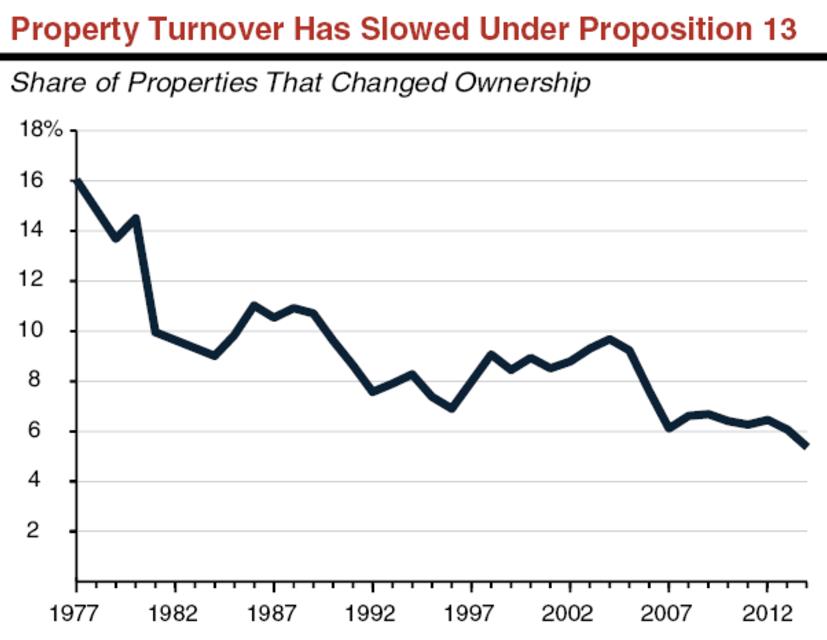
As we discussed in our recent report, Common Claims About Proposition 13, property turnover has been falling for several decades—in part due to Proposition 13. As the figure below shows, 16 percent of properties were sold in 1977–78, compared to just 5 percent in 2014–15.
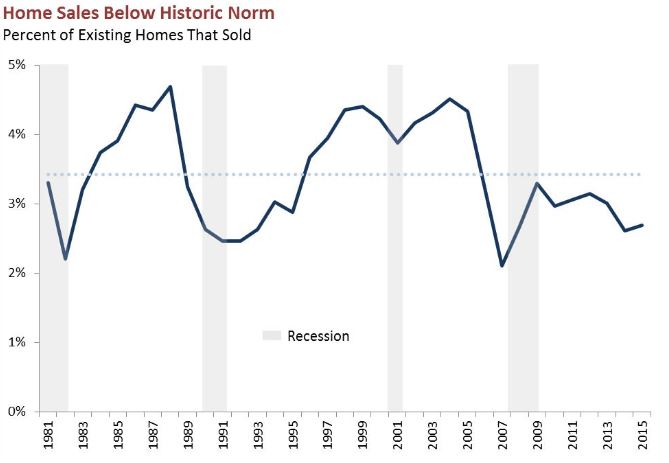
Despite the general downward trend in property turnover, property sales have shown some cyclicality, falling during recessions and rising during economic expansions. During the past few years of expansion, however, property sales have not risen as much as they have in previous expansions. As the figure below shows, despite the recovery of the state’s housing market in recent years, home sales (which comprise a large portion of all property turnover) still remain below the historic norm. This deviation from historical patterns probably is a cause of the changing relationship between assessed values and home prices.
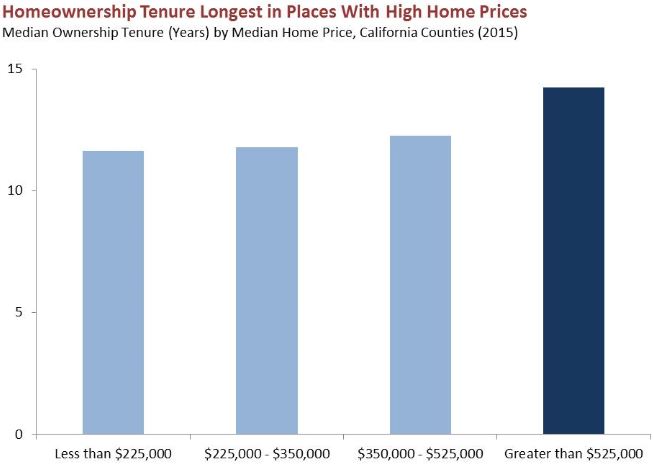
The greatest slowdowns in turnover appear to have occurred in the state’s most valuable real estate markets. In general, as turnover declines, ownership tenure lengthens. The figure below shows that ownership tenure is longest in California’s most expensive housing markets. This means that fewer property sales are occurring in the parts of the state where sales—and the associated reassessment to market value—would have the greatest impact on statewide growth in assessed values. This likely amplifies the drag of declining turnover on property tax growth.
Follow @LAOEconTax on Twitter for regular California economy and tax updates.