
September 19, 2016
Common Claims About Proposition 13
Table of Contents
- Introduction
- Background
- Are Similar Property Owners Taxed Differently Under Proposition 13?
- Do Proposition 13’s Benefits for Property Owners Vary With Income?
- Does Proposition 13 Reduce Property Turnover?
- Did Proposition 13 Cause Residential Properties to Pay a Larger Share of Property Taxes?
- Does Proposition 13 Discourage New Business Creation?
- How Does Proposition 13 Affect the Stability of Property Taxes?
- How Did Proposition 13 Change Local Governments Mix of Tax Revenues?
- What Happened to Local Government Revenues After Proposition 13?
- Did Proposition 13 Reduce the Number of New Local Governments Formed?
- Does Proposition 13 Alter Local Government Land Use Decisions?
- Does Proposition 13 Alter Property Owners’ Development Decisions?
- Did Proposition 13 Increase Fees on Developers?
- Did Assessments Associated With Development Rise After Proposition 13?
- Does Proposition 13 Increase Homeownership?
- Figure Data Sources
Introduction
Proposition 13 was a landmark decision by California’s voters in June 1978 to limit property taxes. Today, there are many questions about the impacts of these changes. This report examines some of these questions and which of them can be answered by the data available.
Background
[Also see our short video Introduction to Proposition 13.]
Below, we provide a basic overview of property taxes, Proposition 13, and its implementation.
Property Tax Basics
Property Tax One of California’s Largest Taxes. “Ad valorem” property taxes—hereafter referred to as simply property taxes—are a levy on property owners based on the value of their property. Property taxes are a foundation of public finance in many states, including California. In California, the property tax raised $55 billion in 2014–15, making it the second largest source of government revenue behind only the personal income tax. For many Californians, the property tax is one of the largest tax payments they make each year. For thousands of California local governments (cities, counties, schools, and special districts), property tax revenues represent the foundation of their budgets.
Taxable Value of Property and Property Tax Rate Determine Tax Bill. Each property owner’s annual property tax bill is determined by multiplying the taxable value of their property—or assessed value—by their property tax rate. For example, the owner of a property with an assessed value of $100,000 and a tax rate of 1 percent pays an annual property tax payment of $1,000.
Changes Made by Proposition 13
Property Taxes Capped at 1 Percent. Prior to the passage of Proposition 13, each local government could set—or levy—its property tax rate annually. Before Proposition 13 passed, the average property tax rate in California was 2.67 percent. This average rate reflected the sum of individual property tax levies of multiple local governments serving a property. Under Proposition 13, a property’s overall tax rate for all local governments serving the property is limited to 1 percent (with some exceptions to finance certain types of public debt).
Property Taxes Based on Purchase Price. Prior to Proposition 13, property taxes were based on the market value of property—that is, the price for which it could be sold. Under Proposition 13, property taxes instead are based on a property’s purchase price. In the year a property is purchased, it is taxed at its purchase price. Each year thereafter, the property’s taxable value increases by 2 percent or the rate of inflation, whichever is lower. This process continues until the property is sold and again is taxed at its purchase price.
Special Taxes Require Two–Thirds Voter Approval. Proposition 13 also changed the requirements for local governments to levy other taxes. Specifically, Proposition 13 requires two–thirds of voters to approve any special taxes levied by local governments. Special taxes are those taxes that raise funds for a particular purpose. For instance, if a city were to levy a tax for parks, that tax would be considered a special tax.
Implications for Taxpayers and Local Governments
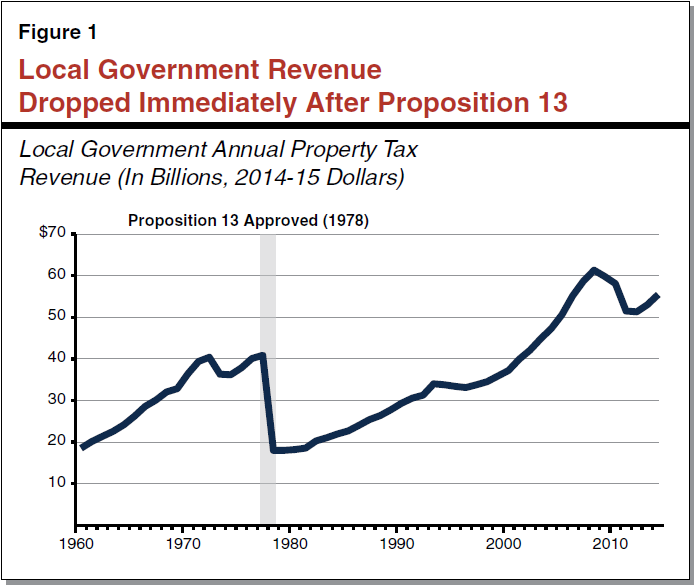
Immediate Drop in Property Tax Payments. By lowering the property tax rate to 1 percent statewide, Proposition 13 immediately resulted in a significant drop in property taxes paid by taxpayers and collected by local governments. As shown in Figure 1, property tax payments dropped by roughly 60 percent immediately following Proposition 13.
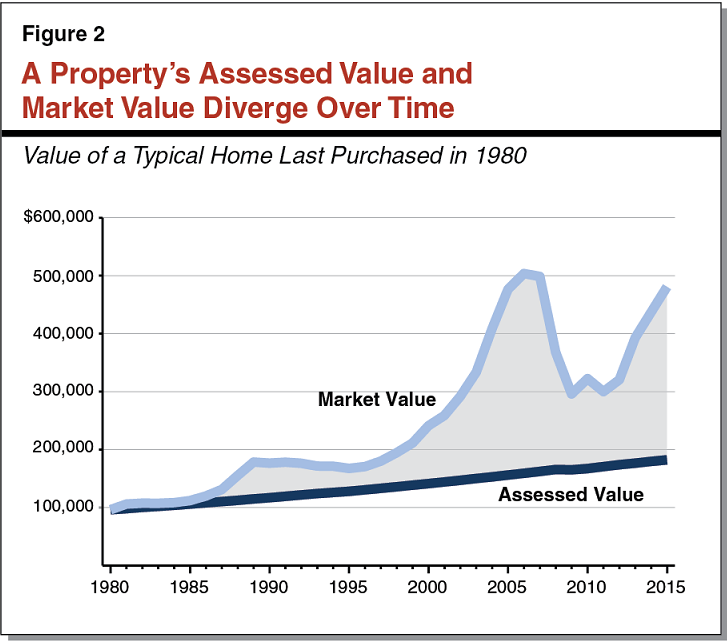
Ongoing “Tax Relief” to Property Owners. Proposition 13’s limits on assessed value growth also result in ongoing reductions in property tax payments. This is because in most years the market value of most properties grows faster than 2 percent per year. As a result, under Proposition 13 the taxable value of most properties is less than their market value. The longer a property is owned, the wider this gap tends to grow, as shown in Figure 2. Many property owners therefore pay lower property taxes under Proposition 13 than they would pay if taxed based on their properties’ market values. Throughout this report for convenience of discussion, we refer to this difference as a property owner’s tax relief from Proposition 13. (Property owners also receive ongoing property tax relief from the 1 percent cap on the property tax rate.)
Implementation of Proposition 13
Proposition 13 Shifted Significant Authority to the State. Before Proposition 13, the property tax had been a local tax levied by local governments for local services. Proposition 13, however, changed this by assigning to the state the responsibility of allocating property tax revenues. Proposition 13 required that overall property tax rates be lowered but did not specify how that should be done. Because Proposition 13 directed the state to allocate the property tax, the state had to determine how to lower each local government’s rate such that no property’s overall tax rate exceeded 1 percent. With thousands of local governments levying property taxes prior to Proposition 13, the state relied on the existing property tax distributions to implement the 1 percent rate set by Proposition 13.
State Set Uniform Rate and Developed Local Government “Shares.” To determine how much property tax revenue each local government would receive from the lower rate, the state directed county auditors to determine how much property tax revenue each local government in the county received before Proposition 13. Next, county auditors divided that amount by the property tax raised by local governments countywide before Proposition 13. These were called local governments’ shares of the property tax.
The state used these shares to determine how much of the revenue from the 1 percent rate local governments would receive. For instance, if before Proposition 13 a school’s property tax revenue had been $100,000 and the countywide property tax revenue had been $1 million, the school’s share would be 10 percent. As a result, local governments’ property tax rates before 1978 largely determined what they received after Proposition 13.
Local Governments’ Property Tax Shares Vary Widely. Under this system, property tax shares vary widely among each type of local government. For example, while the statewide average share among cities is roughly 20 percent, in Los Angeles County alone, cities’ shares range from less than 10 percent to over 30 percent.
Are Similar Property Owners Taxed Differently Under Proposition 13?
[Also see our short video Are Similar Property Owners Taxed Differently Under Proposition 13?]
Owners of properties that are similar but purchased at different times often pay vastly different amounts of property tax. Property tax payments also vary among property owners with similar incomes and wealth.
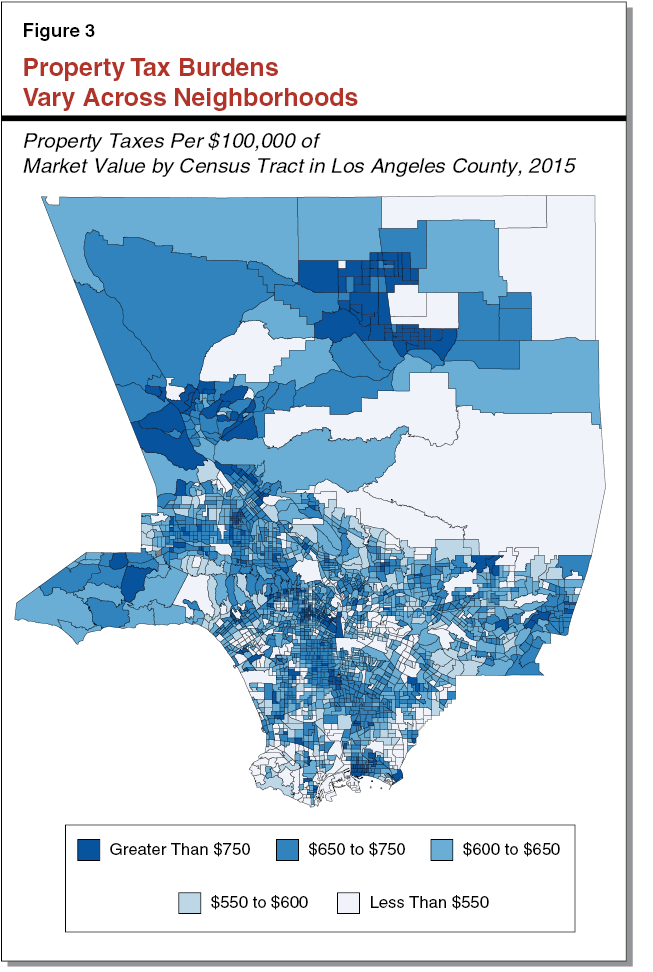
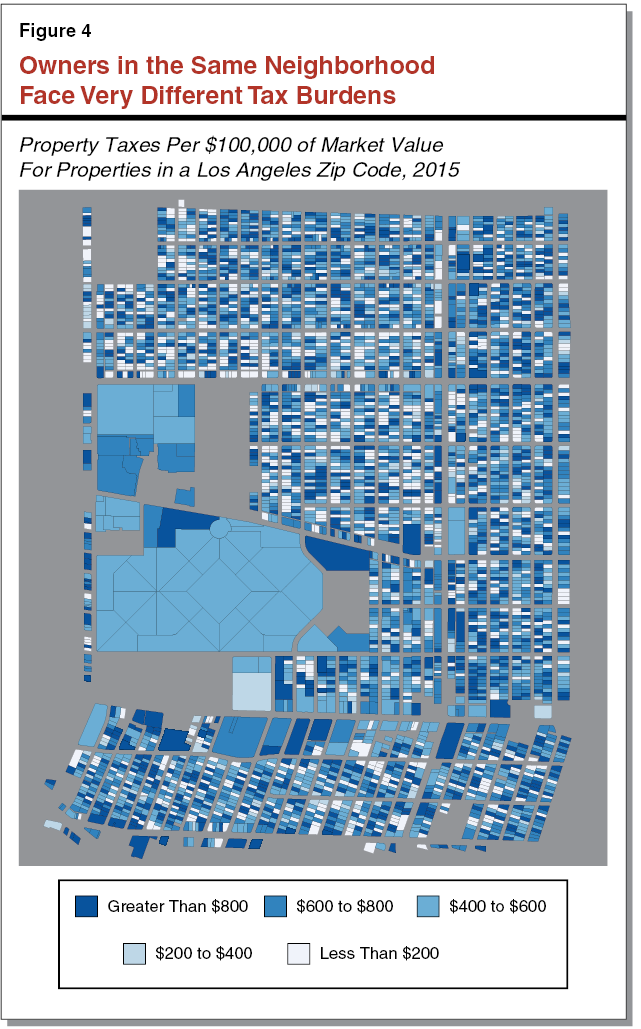
Property Taxes on Similar Properties Can Be Significantly Different. As discussed in the background, a property’s assessed value greatly depends on how long ago it was purchased. Because of this, significant differences arise among property owners solely because they purchased their properties at different times. Figure 3 shows how property taxes per $100,000 of market value paid by typical property owners vary significantly across neighborhoods in Los Angeles County. These differences are made more apparent by comparing individual property owners in a particular neighborhood. Figure 4 displays property taxes per $100,000 of market value for individual property owners in a single zip code in Los Angeles.
Differences Among Similar Property Owners Also Can Be Substantial. Substantial differences occur even among property owners of similar ages, incomes, and wealth. For example, we find significant variation among similar homeowners in the Bay Area. Looking at 45 to 55 year old homeowners with homes worth $575,000 to $625,000 and incomes of $80,000 to $90,000 (values characteristic of the region), property tax payments in 2014 ranged from $1,350 to $7,500.
Do Proposition 13’s Benefits for Property Owners Vary With Income?
For homeowners at all income levels, tax relief from Proposition 13 generally is proportionate to the market value of their homes. At the same time, higher–income Californians own more homes and own homes of higher value and, therefore, receive the majority of the total dollars of tax relief provided to homeowners by Proposition 13.
Higher–Income Households Own More, Higher–Value Homes. Relative to other income groups, higher–income households own more homes and own homes of greater value. Nearly three–fourths of households with incomes higher than $80,000 own homes, compared to just over one–third of households with incomes less than $50,000. (California’s median household income is $61,000.) In addition, the typical home of a homeowner earning $80,000 or more is worth $500,000, compared to $275,000 for homeowners with incomes less than $50,000.
Benefits From Assessed Value Limits Roughly Aligned With Home Wealth . . . As discussed in the background, Proposition 13’s limits on assessed value growth provide tax relief to many property owners. Figure 5 breaks out this tax relief for homeowners at different income levels. As Figure 5 shows, homeowners’ tax relief generally is proportionate to the market value of their homes, regardless of their income level.
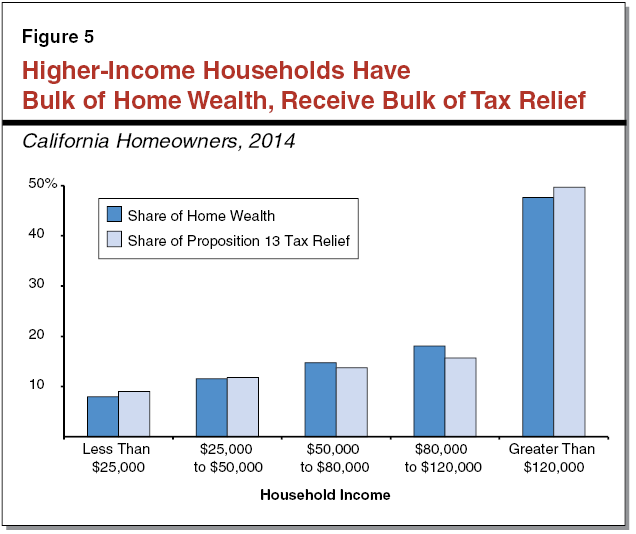
. . . High–Income Homeowners, Therefore, Receive the Greatest Dollar Amount of Tax Relief. Because higher–income households own more, higher–value homes and Proposition 13 tax relief is proportionate to home wealth, the majority of Proposition 13 tax relief (in dollar terms) goes to higher–income households. About two–thirds of tax relief goes to those with incomes higher than $80,000, with the bulk of that relief going to homeowners with incomes in excess of $120,000.
What About Renters? Our analysis above focuses on Proposition 13’s benefits for homeowners. Renters, however, also may receive some benefits from Proposition 13. Landlords facing slower increases in their property tax bills may be less inclined to increase rents. The extent to which landlords pass on their tax relief to renters is unclear. Because of this uncertainty, we are unable to quantify these benefits.
Does Proposition 13 Reduce Property Turnover?
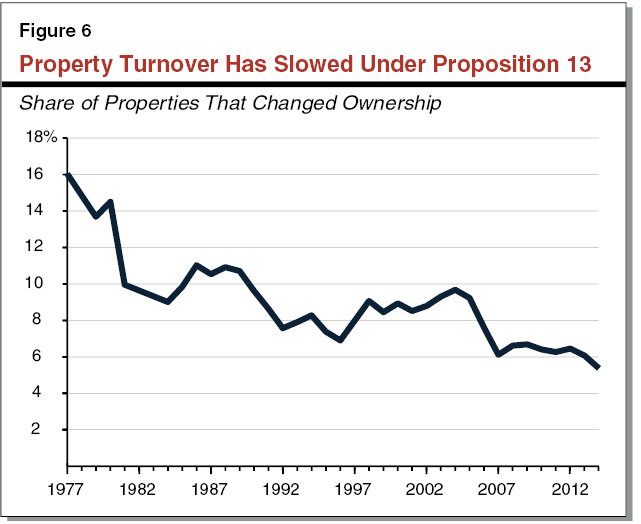
Property turnover has slowed since voters approved Proposition 13. Many factors appear to be driving this trend, including Proposition 13.
Property Turnover Has Declined. The share of properties sold each year in California has been on the decline since the passage of Proposition 13. Figure 6 shows that 16 percent of properties were sold in 1977–78. This share declined to only 5 percent in 2014–15.
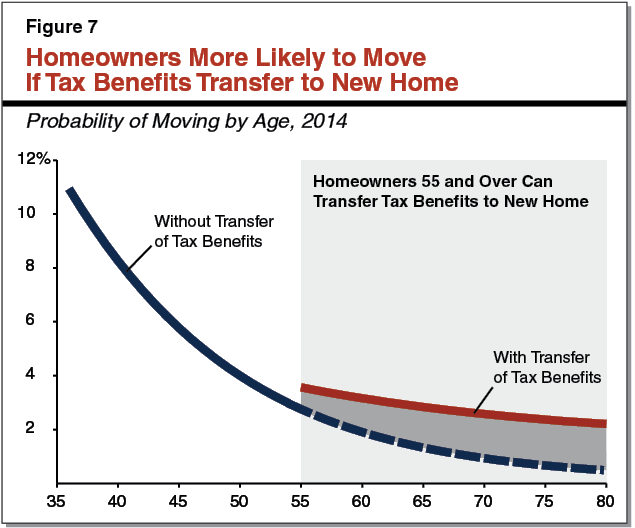
Proposition 13 Appears to Play Some Part in This Trend. There are many possible explanations for the decline in property sales, such as the state’s aging population and rising real estate prices. Proposition 13 also appears to have a role. The influence of Proposition 13 can be seen by looking at how often homeowners have moved since its passage. Homeowners generally receive greater tax relief from Proposition 13 the longer they stay in their same home. In response, homeowners appear to move less often. One study conducted in 2005 found that, between 1970 and 2000, the average length of ownership rose by less than a year among homeowners receiving the lowest tax relief, compared to two to three years for those receiving the highest tax relief. Further, our analysis (as well as previous research) finds that homeowners 55 and over appear to be more likely to move in response to state laws allowing them to transfer their tax relief to a new home. As Figure 7 shows, 55 year old Californians were around 20 percent more likely to move in 2014 than 54 year old Californians. This suggests that some homeowners who were interested in moving delayed doing so in order to maintain their tax relief.
Did Proposition 13 Cause Residential Properties to Pay a Larger Share of Property Taxes?
[Also see our short video Did Proposition 13 Cause Residential Properties to Pay a Larger Share of Property Tax?]
Homeowners pay a slightly larger share of property taxes today than they did when Proposition 13 passed. Proposition 13 does not appear to have caused this increase.
Some Shift in the Share of Property Taxes Paid by Homeowners. In 1979–80, homeowners paid about 34 percent of property taxes (on secured property). This share fell to a low of 32 percent in the mid–1980s. Since then, however, the share has risen. In 2015–16, homeowners paid about 37 percent of all property taxes. In part, this may be due to faster growth in the number of residential properties than the number of commercial and industrial properties. Since the passage of Proposition 13, residential properties overall (not just owner–occupied homes) grew by almost 60 percent, while commercial and industrial properties grew less than 30 percent. Because the number of residential properties increased faster than commercial and industrial properties, the share of property taxes paid by residential properties increased as well.
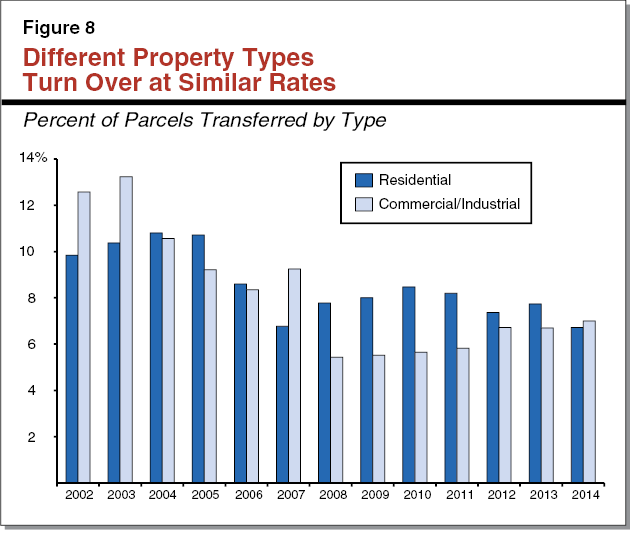
Proposition 13 Does Not Appear to Be a Major Cause for This Shift. As described in the background, under Proposition 13 owning a property for more years results in a lower property tax bill compared to those purchasing a similar property more recently. Thus, if some types of properties turn over more frequently than others, the share of property taxes paid by those properties would increase. In particular, if residential properties turn over more frequently than commercial and industrial properties, then Proposition 13 would be part of the reason homeowners pay a slightly higher share of property taxes today. This does not appear to be the case. Rather, residential, commercial, and industrial properties appear to be turning over at relatively similar rates.
Residential Properties Do Not Turn Over More Often Statewide. As seen in Figure 8, the rate of turnover for residential (including homeowners and rented residential properties) and commercial and industrial properties across the state is relatively similar in recent years. Though the rates of turnover are not the same in each year, residential properties do not appear to turn over at rates much higher than commercial and industrial properties statewide.
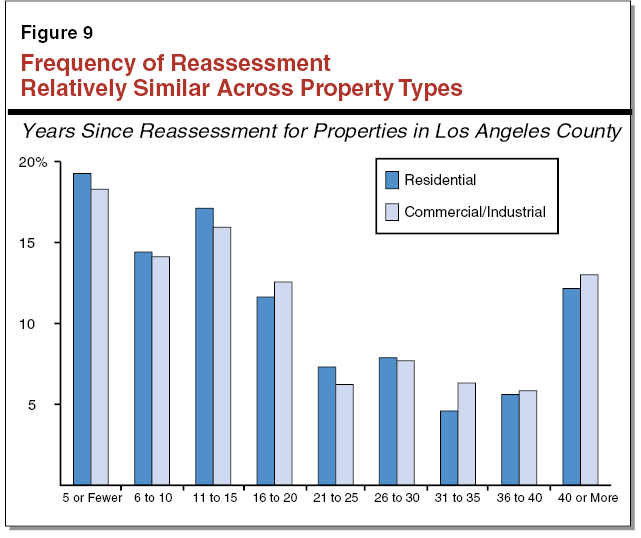
Residential Properties Are Not Reassessed More Frequently Than Commercial and Industrial Properties. As discussed in the background, when a property is sold, the county reassesses the property. Comparing the frequency of reassessment across property types in Los Angeles County, shown in Figure 9, suggests that residential properties are not reassessed—and therefore do not turn over—more frequently than commercial and industrial properties. In addition, in San Diego County a typical commercial and industrial property was last reassessed ten years ago, compared to 14 years ago for residential property. This suggests residential properties turnover slightly less often, which increases the tax benefits to these properties. Because residential properties do not appear to change owners more frequently than commercial and industrial properties, Proposition 13 likely did not cause the slight increase in the share of property taxes paid by homeowners.
Does Proposition 13 Discourage New Business Creation?
New businesses that need to purchase property often face higher property tax costs than existing competitors. There is little evidence, however, that this significantly discourages creation of new businesses.
New Commercial Property Owners Pay Higher Taxes Than Existing Owners . . . Property tax payments for similar properties differ based on when the properties were purchased, with properties purchased more recently paying higher property taxes. This is true of all property types, including commercial properties used by businesses. For example, in Los Angeles County in 2015, a typical new commercial property owner paid $2.69 per square foot in property taxes, compared to $1.18 for commercial property owned ten years or longer. This difference becomes more stark when looking at commercial properties owned for 20 years or longer, which typically pay $0.87 per square foot.
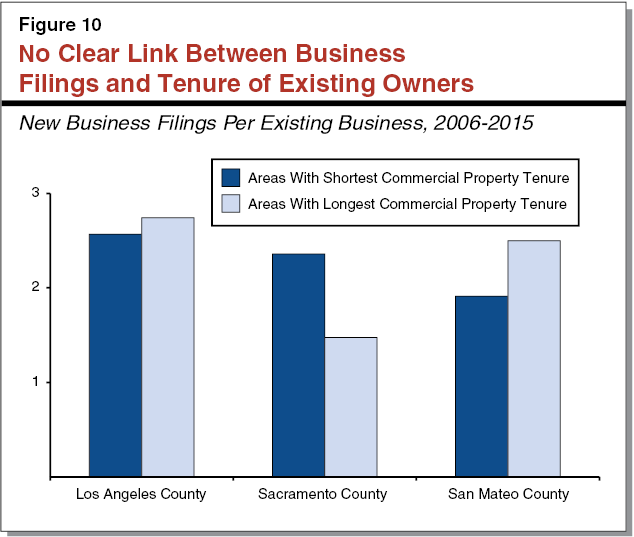
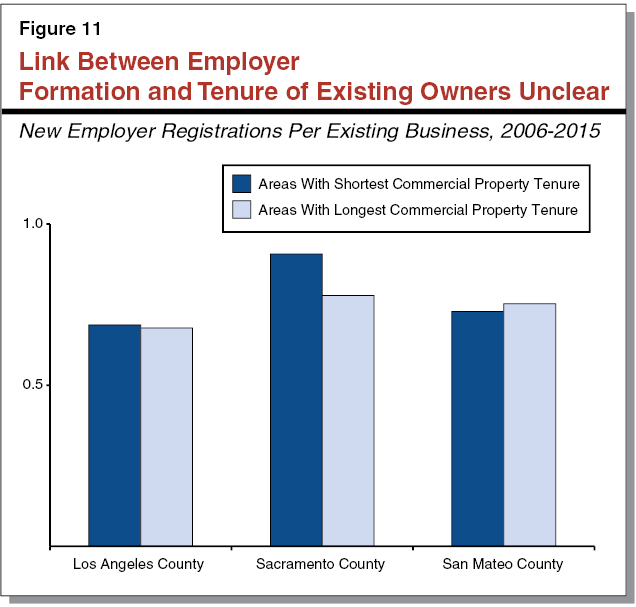
. . . But It Is Not Clear That This Significantly Deters Creation of New Businesses. Higher property tax costs for new commercial property owners seemingly creates a disadvantage for new businesses that need to buy property. This may make it harder for new businesses to compete with long–tenured, existing businesses. Arguably, this could slow new business creation in areas with many long–tenured businesses. However, data on business creation in three large counties across the state (Los Angeles, Sacramento, and San Mateo) lends little support for this claim. Figure 10 shows new business filings (registration of new business entities with the Secretary of State) by zip code for these three counties. The figure compares zip codes with more long–tenured businesses (“area with longest commercial property tenure”) to zip codes with fewer long–tenured businesses (“areas with shortest commercial property tenure”). If differences in property tax treatment were significantly discouraging new businesses, we would expect to see less business creation in zip codes with more established businesses. In two of the three counties we looked at (Los Angeles and San Mateo), the opposite was true. Similarly, as shown in Figure 11, in Los Angeles and San Mateo Counties there is little difference between the number of new employers in zip codes with longer–tenured businesses and zip codes with less–tenured businesses.
Property Taxes a Small Share of Profits for Many Businesses. It is unclear why higher property tax costs for new businesses relative to existing competitors do not appear to significantly discourage new business creation. One possible explanation is that property taxes represent a small share of many businesses’ profits. One study of state and local business taxes found that in 2014 the average California business paid less than 5 percent of their profits in property taxes. Another potential explanation is that many businesses lease their properties instead of owning them.
How Does Proposition 13 Affect the Stability of Property Taxes?
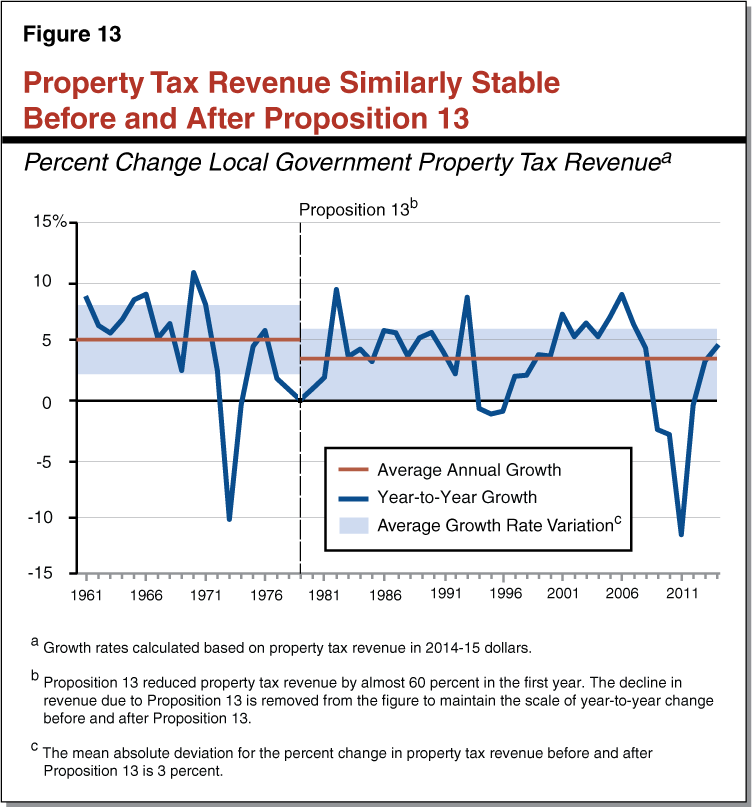
By limiting assessed value growth, Proposition 13 made the taxable value of property more stable. Revenues for local governments, however, were similarly stable before and after Proposition 13. This is because before Proposition 13 local governments adjusted their property tax rates in response to changes in assessed values.
Assessed Value Limits Stabilized the Property Tax Base . . . Before Proposition 13, the average growth in market value was 4 percent per year. In each year, however, the growth rate often varied 5 percent above or below the average. Since Proposition 13 passed, the growth in assessed value has slowed somewhat, but the volatility in the base also has diminished. In particular, since 1978, assessed value growth has averaged 3 percent per year and in most years the growth rate falls 3 percent above or below the average. This increased stability in the property tax base likely was a direct result of Proposition 13, as the overall economy before and after the measure (as measured by year–to–year changes in personal income) was relatively similar.
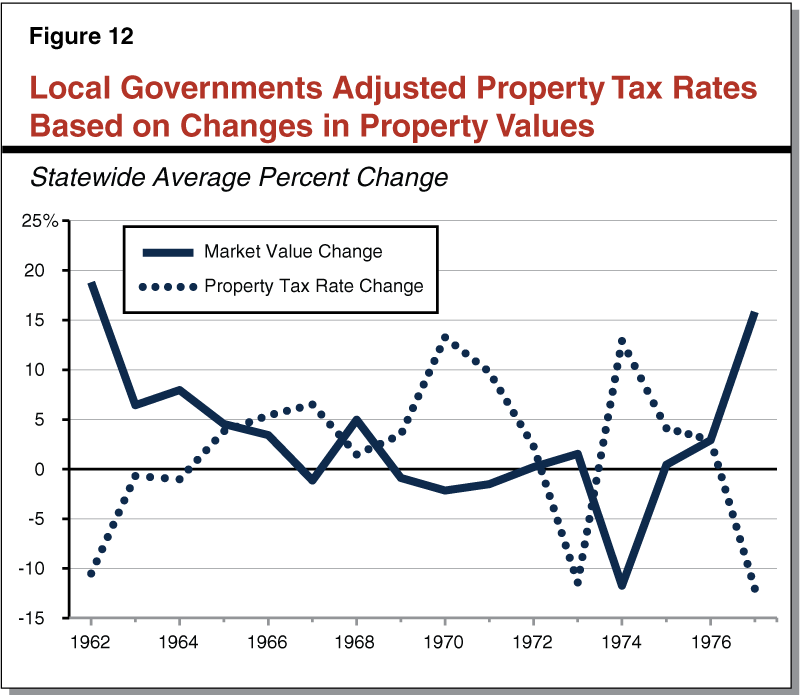
. . . But Before Proposition 13, Local Governments Set Rates to Keep Revenue Stable. Local governments reacted to fluctuations in market values by adjusting their property tax rates each year. As shown in Figure 12, when market values increased, local governments tended to reduce their property tax rates. Similarly, when property values declined, local governments increased their property tax rates. By adjusting their property tax rates annually, local governments kept their overall property tax revenues relatively stable.
Under These Different Conditions, Local Governments’ Revenues Were Similarly Stable. Because limits on assessed values stabilized the property tax base, one might expect that Proposition 13 stabilized property tax revenues as well. However, the ability of local governments to predict their property tax revenues year to year was similar before and after Proposition 13. Figure 13 shows the annual growth rates of overall local property tax revenues across the two periods. The shaded areas of the figure show the average growth rate variation before and after Proposition 13. Each shaded area is centered on the average annual growth rate in the period. Before Proposition 13, the average annual growth rate was 5 percent. After Proposition 13, the average annual growth rate has been 3 percent. As seen in the figure, however, the variation in growth rates before and after Proposition 13 was similar. In both periods, overall local government property tax revenues typically fell 3 percent above or below their average growth rates. This suggests that the ability of local governments to set their property tax rates before Proposition 13 enabled them to moderate the volatility of market values.
How Did Proposition 13 Change Local Governments Mix of Tax Revenues?
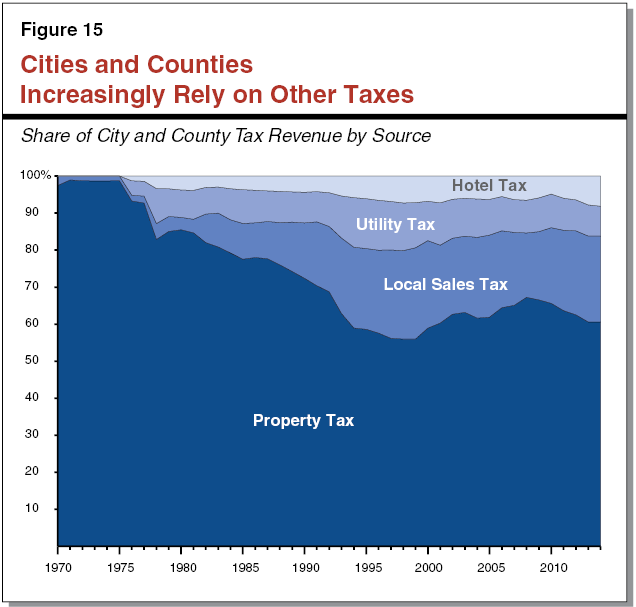
While property taxes remain the single largest source of local tax revenue for cities and counties, these local governments increasingly rely on other local taxes to make up for the revenue loses that resulted from Proposition 13. The year before Proposition 13 passed, property taxes comprised over 90 percent of cities’ and counties’ local tax revenue. Today, that share is less than two–thirds.
Cities and Counties Have More Control Over Sales, Hotel, and Utility Taxes Than Property Taxes. As described in the background, the laws implementing Proposition 13 set cities’ and counties’ property taxes based on the rates they had levied prior to Proposition 13. As a result, any growth in property tax revenues results from increases in property values, which local governments cannot directly control. In contrast, cities and counties can increase sales, hotel, and utility tax rates to generate additional revenue, though doing so requires voter approval.
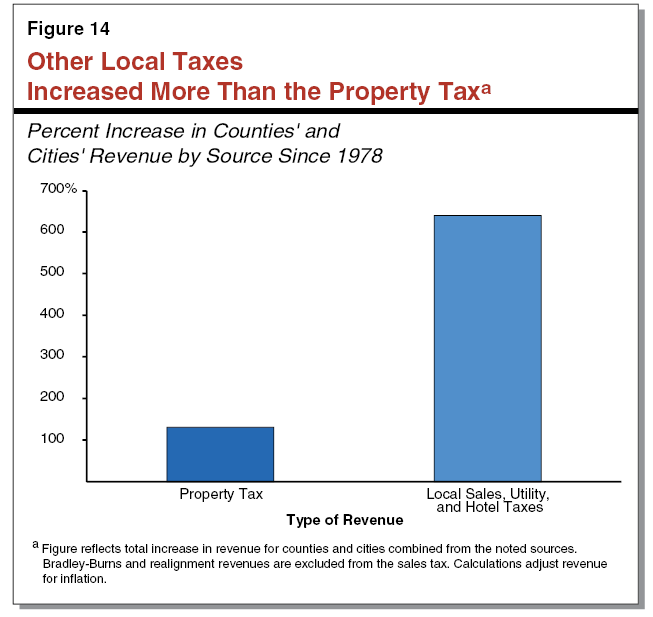
Sales, Hotel, and Utility Taxes Largely Replaced Lost Property Tax Revenue. Figure 14 shows that since Proposition 13 passed property tax revenue (adjusted for inflation) for cities and counties increased over 100 percent. In comparison, hotel, sales, and utility taxes increased over 600 percent. The significant increase in these other local taxes reflects cities’ and counties’ efforts to replace lost property tax revenue. Adjusted for inflation, Proposition 13 reduced cities and counties property tax revenue by almost $10 billion in the first year. Compared to their revenues in 1978–79, local sales, hotel, and utility taxes generated roughly $8.5 billion in additional revenue in 2014–15.
Cities and Counties Rely Less on Property Tax Revenues Today. Figure 15 shows the share of revenue by source for cities and counties before Proposition 13 through 2014–15. Before Proposition 13, cities and counties relied almost entirely on property tax revenue. Over time, however, cities and counties increasingly relied on taxes they could raise with voter approval to replace lost property tax revenue. As a result, these other sources of revenue likely are paying for services that before Proposition 13 would have been paid with property tax revenue.
What Happened to Local Government Revenues After Proposition 13?
Cities’ and counties’ tax revenue per person has declined since Proposition 13. However, looking across all California local governments’ per–person revenue—excluding state and federal funds—revenues increased 36 percent since Proposition 13. In comparison, similar per–person revenues for local governments across the country increased by almost 70 percent over the same period.
Cities’ and Counties’ Local Tax Revenue Per–Person Declined. As discussed earlier, cities’ and counties’ increased their sales, hotel, and utility taxes to replace revenues lost due to Proposition 13. Despite these increases, on a per–person basis, cities’ and counties’ local tax revenue is lower today than it was in the year before Proposition 13 passed. Adjusted for inflation, cities and counties received roughly $790 per person in 1977–78, but only about $640 per person in 2014–15.
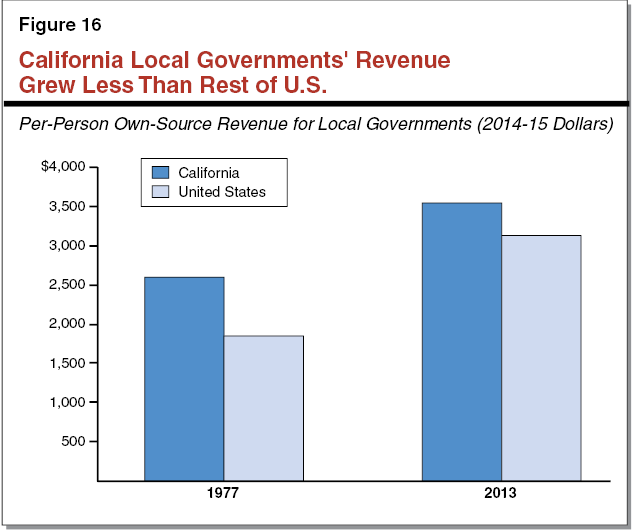
Overall, California Local Revenue Increased . . . In addition to property, hotel, sales, and utility taxes, local governments receive revenue from various fees and assessments levied for particular activities and services. (Later in this report, we discuss how these fees and assessments for land development have increased since Proposition 13.) Across these “own–source” revenues for all local governments, revenue rose from roughly $2,600 per person in 1977 to roughly $3,440 per person in 2013 (adjusted for inflation). This reflects an increase of over one–third across all own–source revenues for local governments.
. . . But Not as Much as in Other Areas of the Country. Figure 16 shows the increase in local revenue per person in California compared to local governments across the country. While per–person revenue increased in California from 1977 to 2013, local governments outside of California saw much larger increases in revenue. Particularly, per–person own–source revenue across all local governments in the country increased 69 percent from 1977 to 2013. The slower growth in California is somewhat unsurprising given California had above average per–person revenues in 1977. Other states with high 1977 per–person revenues also had below average growth. California, however, grew even slower than states with high 1977 per–person revenues.
Did Proposition 13 Reduce the Number of New Local Governments Formed?
After the passage of Proposition 13, the formation of local governments in California slowed compared to other states. Moreover, after a subsequent proposition passed expanding on Proposition 13, local government formation in California slowed even further. This trend is distinct from the rest of the country, which saw less population growth than California over this period.
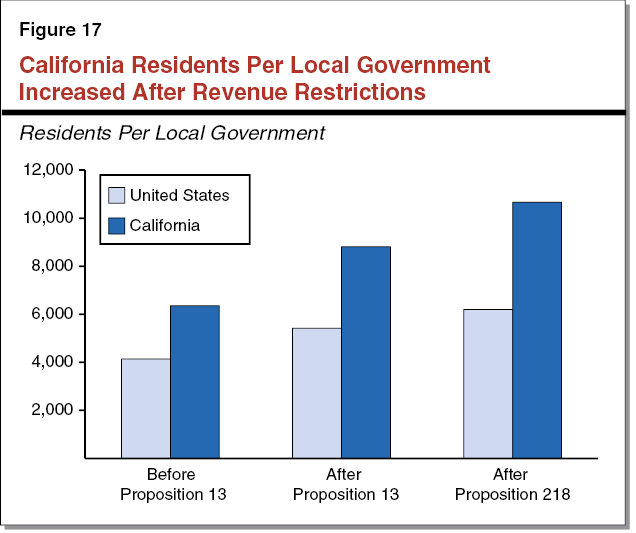
Propositions 13 and 218 Limited Local Governments’ Revenue. As a result of Proposition 13, local governments formed after 1978 were unable to receive a share of the 1 percent tax and existing local governments’ revenues were constrained by their share of the 1 percent tax. In response to Proposition 13, local governments turned to alternative sources of revenue like general taxes and assessments. To restrict these alternative taxes, the proponents of Proposition 13 proposed Proposition 218, which the voters approved in 1996. Among other provisions, Proposition 218 required voter approval for general taxes and established new requirements for levying assessments.
California Local Governments Served More Residents After Propositions 13 and 218. Figure 17 shows the average number of residents served by each local government in California and other states before Proposition 13, after Proposition 13, and after Proposition 218. After Propositions 13 and 218, California local governments served increasing numbers of residents compared to local governments in other parts of the country. Specifically, over the period in the figure (from 1952 to 2012), the average number of residents served by California local governments increased by over 4,900 residents. Local governments elsewhere in the country served an additional 2,400 residents roughly.
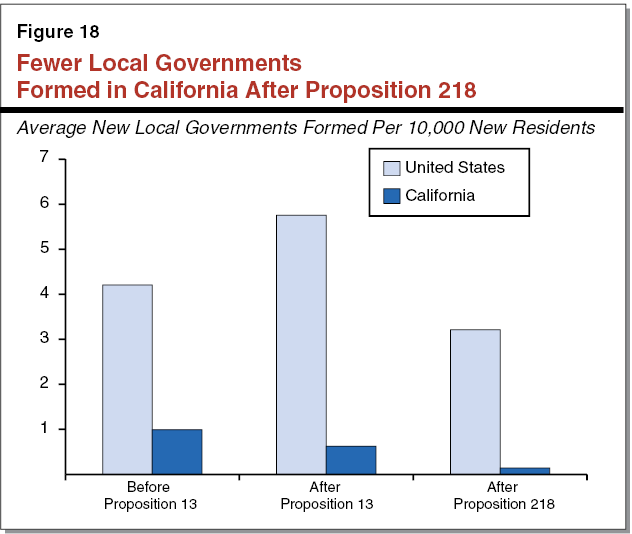
Local Government Formation Declined After Proposition 218. Local governments in California served increasing numbers of residents because fewer local governments were forming despite increases in population. As seen in Figure 18, new local government formations declined in California notably after Proposition 218, despite a 22 percent increase in population. This was not the case for local governments in other parts of the country, which saw lower population growth than California (19 percent since 1996). While some of the slowdown in local government formation likely reflects increased population density, Propositions 13 and 218 local government revenue restrictions likely inhibited local government formation in California compared to what might have occurred without the restrictions.
Does Proposition 13 Alter Local Government Land Use Decisions?
Proposition 13 created fiscal incentives for many communities to focus more on building retail stores, auto dealers, and hotels while focusing less on housing. We, however, did not find evidence that these incentives significantly influenced city zoning and permitting decisions in recent years.
Cities and Counties Weigh Fiscal Effects of Development. California’s cities and counties make most decisions about when, where, and to what extent development will occur. Different types of developments yield different amounts of tax revenues and service demands. In response, local governments commonly examine these fiscal effects when considering new development or planning for future development.
Under Proposition 13, Commercial Development Often Yields Greater Fiscal Benefits. Proposition 13 altered the fiscal effects of development for local governments in two key ways. First, the property tax allocation system created to implement Proposition 13 provides many cities and counties only a small portion of local property tax revenues. Second, as discussed previously, since Proposition 13’s passage local governments have become increasingly reliant on other taxes, such as sales and hotel taxes. Because of these changes, many cities and counties find that developments that generate sales or hotel taxes in addition to property taxes yield the highest net fiscal benefits. In contrast, housing developments, which do not produce sales or hotel tax revenues directly, often lead to more local costs than offsetting tax revenues.
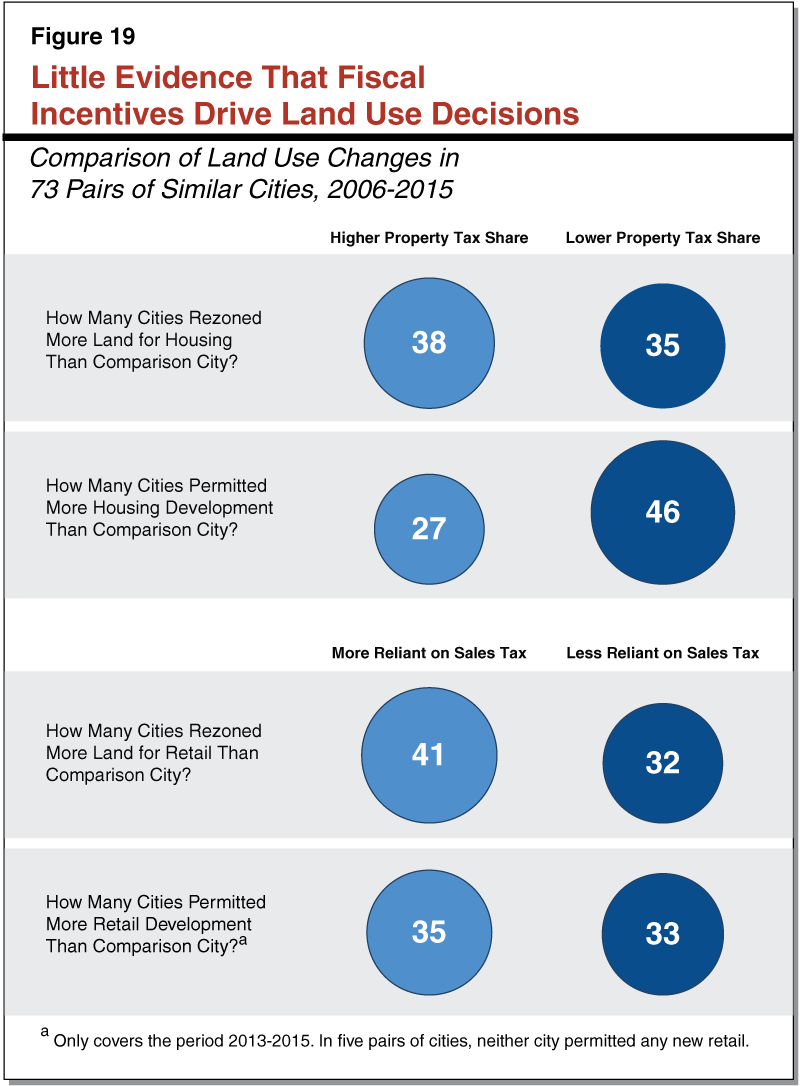
Fiscal Incentives Do Not Appear to Have Major Influence on Land Use Decisions. Given these fiscal incentives, cities and counties that receive lower shares of property taxes or that derive more of their revenues from sales taxes would be expected to prioritize developments that generate sales and hotel taxes, rather than home building. To gauge whether or not this occurs in practice, we looked at two measures of city development patterns over the last decade: rezoning decisions (changes in the allowable use of land) and building permits. We found little evidence that cities with lower property tax shares set aside less land for housing or built less housing. Similarly, our analysis suggests that cities that are more reliant on sales taxes are, at most, modestly more likely to prefer retail over other types of development.
Analysis of city development patterns is complicated by the fact that many factors beyond fiscal incentives can influence city land use decisions, such as each city’s size, type (urban, suburban, or rural), age, and real estate prices. To attempt to isolate the effect of fiscal incentives from these other factors, we identified 73 pairs of cities with similar populations, home prices, and dates of incorporation, but that differed in their property tax shares and reliance on sales taxes. We then compared each city’s land use decisions over the last decade to its comparison city. The results are summarized in Figure 19. As the figure shows, cities that were more reliant on sales taxes were slightly more likely to rezone more land for retail uses than their comparison city. Despite this, cities more reliant on sales taxes did not consistently permit more retail development. Fiscal incentives appear to have even less effect on housing decisions. Cities with higher property tax shares did not consistently rezone more land for housing. Further, in almost two–thirds of pairs, the city with the lower property tax share permitted more housing construction than their comparison city.
Cities May Change Behavior in Other Ways. While we did not find evidence that city land use decisions have been altered significantly by the fiscal incentives fostered by Proposition 13, cities may respond to these incentives in other ways. For example, some cities have offered perks such as tax breaks, publicly financed property improvements, and cheap land to retail stores to encourage them to locate in their communities.
Does Proposition 13 Alter Property Owners’ Development Decisions?
Land owners who have owned their property longer and therefore receive greater tax relief under Proposition 13 are less likely to develop their land. It is difficult to determine, however, how much of this can be attributed to Proposition 13 instead of other factors.
Long–Tenured Properties Are Less Likely to Be Developed. Figure 20 shows how likely vacant land in three large counties across the state (Los Angeles, Sacramento, and San Mateo) was to be developed over the last decade based on how long it has been owned. As shown, the chance that land was developed drops significantly the longer the property is owned. Properties owned for five to ten years were close to four times more likely to be developed than properties owned for 20 to 25 years (8 percent compared to 2 percent).
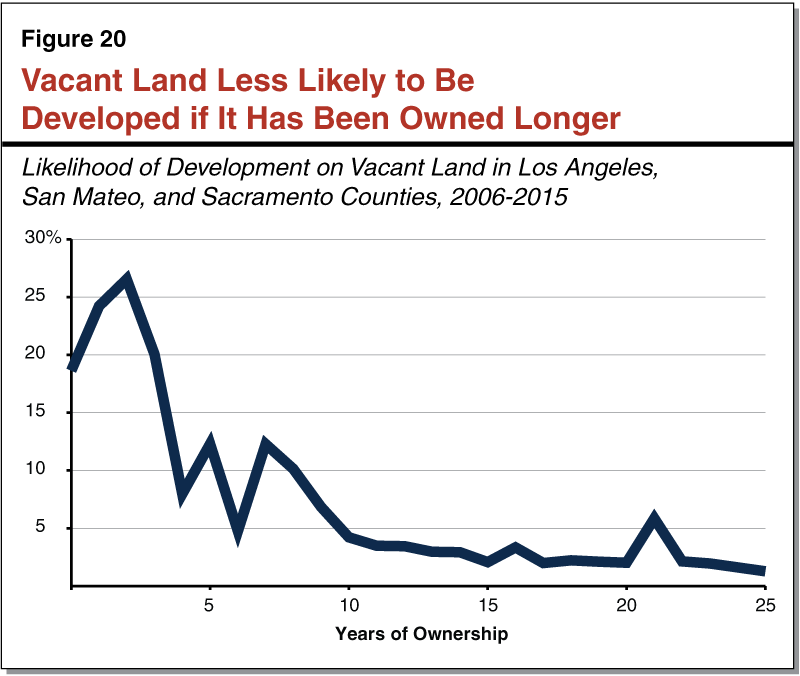
Proposition 13 May Play a Part in Explaining This Pattern. It is possible that Proposition 13 contributes to this pattern of development. Land owners typically seek to time the development of their land to maximize their financial gains. In many cases, greater gains can be achieved by delaying development until real estate markets are strong or holding out for the optimal development opportunity. Land owners also incur costs, including property taxes, to hold on to land for future development. If these costs exceed the potential gains of delaying development, then land owners may decide to develop sooner. On the other hand, if these costs are lower, land owners may be more inclined to hold off on development. In particular, land owners whose property tax costs are low because they have owned their property for many years may be more likely to delay development in hopes of greater future profits.
Other Factors Probably Matter Too. While Proposition 13 may have some part in explaining why properties that have been owned longer are less likely to be developed, it is almost certain that other factors also matter. For example, many properties that have sold more recently likely were purchased by buyers whose intent was to develop in the near future. This probably accounts for the much higher likelihood of development for properties owned for three years or less. It is also possible that properties that have been owned longer may be less likely to turn over or develop because they are in less desirable areas.
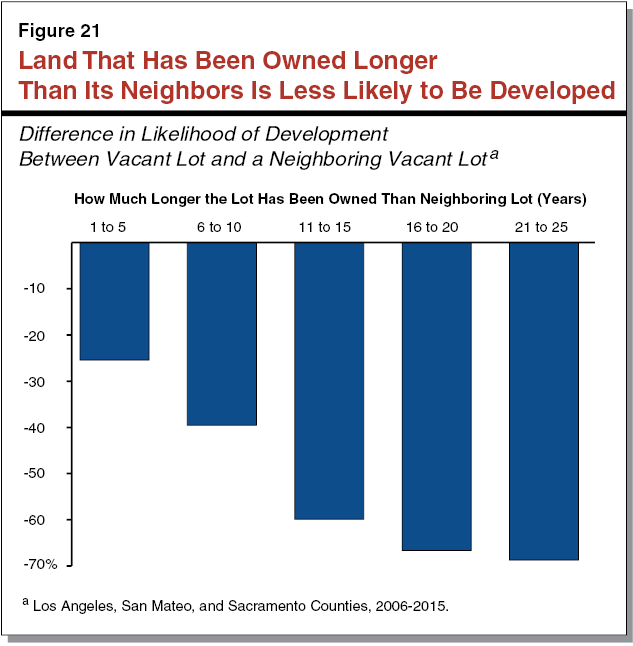
Comparing development patterns of neighboring lots offers one way to attempt to separate the effect of Proposition 13 from some of these other factors. This is because development on neighboring lots likely is influenced by many of the same local factors, making it more likely that differences in development arise from differences in property tax costs. For properties in three large counties (Los Angeles, San Mateo, and Sacramento), Figure 21 compares the frequency of development on vacant lots to frequency of development on neighboring vacant lots that have been owned for fewer years. As the figure shows, over the last decade vacant lots were less likely to be developed than neighboring vacant lots if they had been owned for longer. This effect is larger when the difference in ownership tenure is greater: properties owned one to five years longer than their neighbors were 25 percent less likely to be developed, compared to 69 percent for properties owned for 20 to 25 years longer. This lends some support to the role of Proposition 13 in explaining why properties owned for longer are less likely to be developed.
Did Proposition 13 Increase Fees on Developers?
Local governments appear to be increasingly using impact fees to pay for the costs associated with new development.
Impact Fees Are an Alternative to Property Taxes. Prior to Proposition 13, local governments could increase property taxes to pay for the costs associated with new development. After Proposition 13—which capped local governments’ property tax revenues—local governments had to use other sources of revenue to pay for the costs associated with development. Three options for raising additional revenue for new development include parcel taxes, impact fees, and Mello–Roos assessments (discussed in the next section). Typically, parcel taxes are set at a fixed amount per parcel and are paid by property owners. Impact fees are paid by the builders of new construction.
Impact Fees Do Not Require Voter Approval. Propositions 13 and 218 require local governments to obtain voter approval to levy parcels taxes and Mello–Roos assessments. Gaining voter approval can be challenging, especially for parcel taxes. Parcel taxes require the approval of two–thirds of voters. Of the roughly 200 parcel taxes put to city voters for approval between 2000 and 2014, only about half were approved. In comparison, local governments can adopt impact fees through ordinances or resolutions. To levy these fees, local governments must explain the connection between the development project and the fees imposed. The fee amount is based on the cost of paying for the services or improvements related to the development project. Impact fees typically are easier for cities to impose because they do not require voter approval.
California’s Impact Fees Higher Than Many States. Over half of states have impact fees, which pay for the costs associated with new development like new infrastructure. A recent survey of over half of these states (including most of the western states) found California to have the highest average impact fees for construction of a single–family home. Moreover, according to this study, California’s fees were almost three times as high as the average across all the states in the survey.
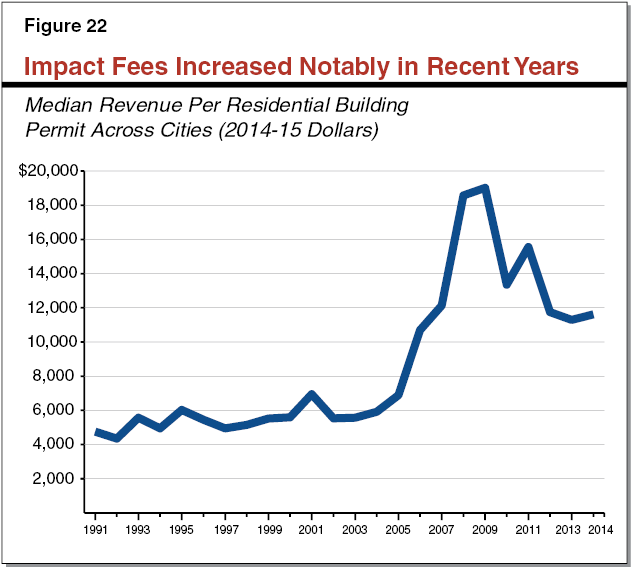
Impact Fees Increased in Recent Years. Figure 22 shows the statewide median impact fees per residential building permit issued by cities. Since 1991, this amount has increased almost 150 percent. Much of this increase was associated with the housing boom that preceded the last recession, though these fees remained high after the recession as well. Fees likely increased most during the housing boom because cities needed revenue to pay for the costs associated with the significant increase in new development.
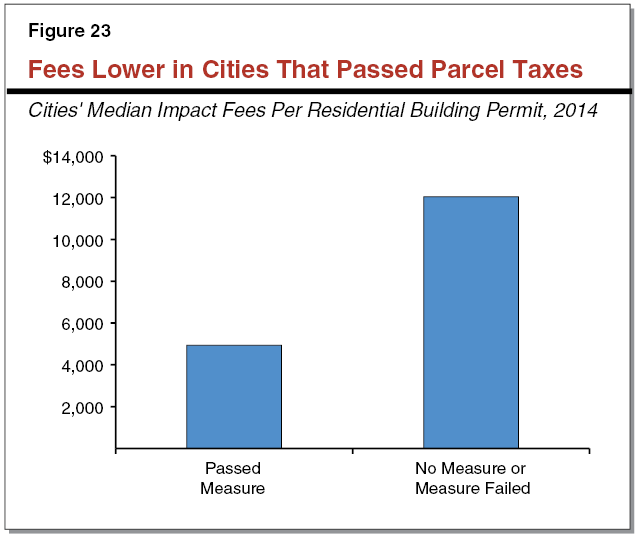
Impact Fees Are Higher in Cities Without Parcel Taxes. Figure 23 shows the median impact fee per residential building permit for cities in 2014. As seen in the figure, the median impact fees were roughly $5,000 per permit in cities that passed a parcel tax between 2000 and 2014. In comparison, those cities that did not propose a parcel tax or failed to pass a parcel tax had median impact fees of over $12,000. Looking at the difference in the fees, cities that could not pass a parcel tax likely relied on higher impact fees to pay for the costs associated with new development.
Did Assessments Associated With Development Rise After Proposition 13?
Local governments increasingly use Mello–Roos assessments to pay for infrastructure associated with new development.
Mello–Roos Assessments Support Infrastructure Improvements. Mello–Roos assessments are another option for local governments—like parcel taxes and impact fees—to pay for infrastructure improvements. Similar to parcel taxes, Mello–Roos assessments require approval of either a majority of local voters or a majority of property owners. Mello–Roos assessments, nonetheless, typically are easier to approve than parcel taxes. This is because developers usually own the land on which they are building and can unanimously approve the assessment prior to construction. Once construction is finished, the assessments are passed on to the new property owners. The new property owners do not vote on these assessments because the developer already approved them.
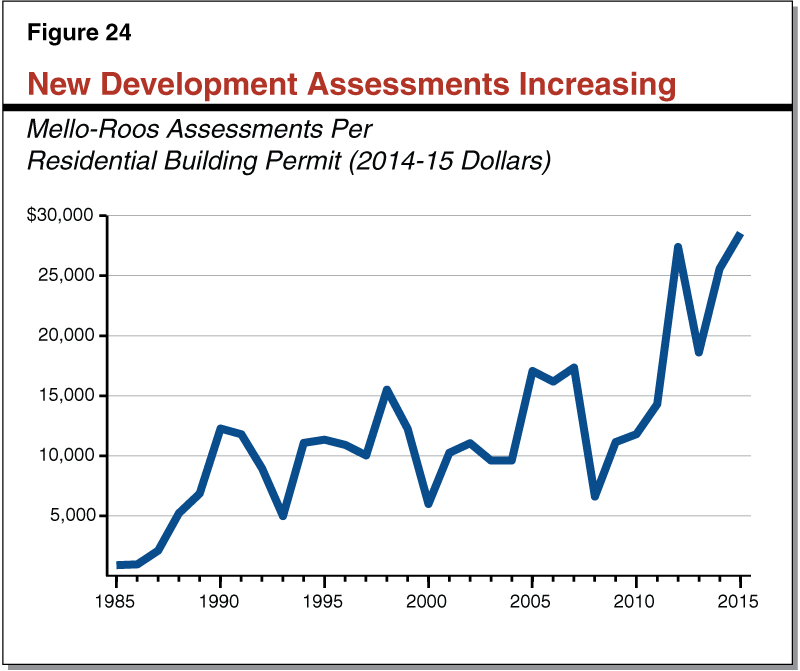
Mello–Roos Assessments Increasing Over Time. Figure 24 shows the average assessment per residential building permit over time. Since 1990—five years after Mello–Roos assessments were enacted—the amount per residential building permit has increased over 130 percent. In comparison, the statewide average property tax bill increased 50 percent since 1990. Like impact fees, local governments likely use Mello–Roos assessments to pay for infrastructure improvements that would have been paid by property taxes prior to Proposition 13.
Does Proposition 13 Increase Homeownership?
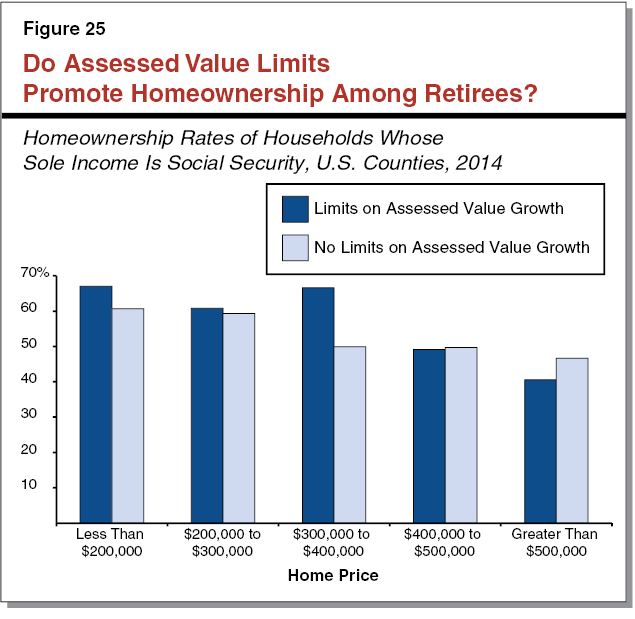
Shifts in homeownership are driven by complex relationships between economic and demographic trends. This makes it hard to measure the influence of any policy change on homeownership. Nonetheless, some evidence suggests that Proposition 13 may have increased homeownership for some older Californians, while decreasing it for younger Californians.
Homeownership Costs Decreased for Some Households . . . Limits on assessed value growth result in lower, more predictable property tax payments for homeowners that do not move often. This would seem to promote homeownership for these households, particularly retirees with fixed incomes. Evidence of this is mixed. As Figure 25 shows, in places with less expensive housing across the country, assessed value limits are linked with higher rates of homeownership among Social Security retirees. This does not appear to be true in places with more expensive housing—such as much of coastal California. This could be because the difficulty of qualifying for and paying a home loan (rather than the cost of property taxes) becomes an increasingly important driver of homeownership as home prices rise.
. . . But Likely Increased for Others. As discussed in the prior two sections, local governments in California appear to have responded to Proposition 13 by increasing fees on home builders and assessments on owners of newer homes. These higher charges increase costs for homebuyers. Faced with these higher costs, fewer young households are able to afford to buy a home. Figure 26 shows that homeownership among Californians 45 and younger has fallen by around one–third since 1980, despite little change in the state’s overall homeownership rate. Many factors contribute to this trend, making it difficult to accurately pinpoint its cause. Nonetheless, the rising cost of development fees and assessments on new homebuyers likely have some role.
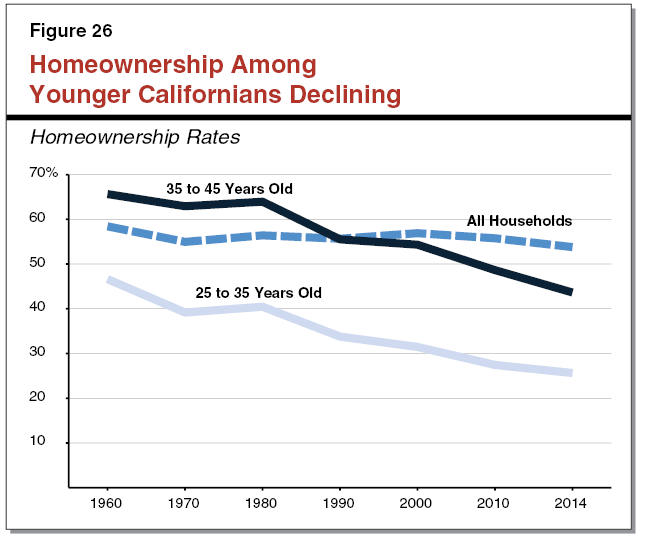
Figure Data Sources
The list below provides the data sources for each of the figures contained within this report. Much of the data used in the report is accessible online or in historical publications. Some data was requested from federal, state, and local government entities.
Figure 1: Board of Equalization, Annual Report: Statistical Tables, Table 14.
Figure 2: California Association of Realtors.
Figure 3: Los Angeles County Assessor Parcels Data.a
Figure 4: Ibid.
Figure 5: IPUMS–USA, University of Minnesota, www.ipums.org (American Community Survey).a
Figure 6: Board of Equalization, A Report on Budgets, Workloads, and Assessment Appeals Activities in California Assessors’ Offices, Table F.
Figure 7: IPUMS–USA, University of Minnesota, www.ipums.org (American Community Survey).a
Figure 8: Board of Equalization, A Report on Budgets, Workloads, and Assessment Appeals Activities, Tables E and F.
Figure 9: Los Angeles County Assessor Parcels Data.
Figure 10: Secretary of State Business Filings, Counties of Los Angeles, Sacramento, and San Mateo Assessor Parcels Data.
Figure 11: Employment Development Department New Employer Registrations, Counties of Los Angeles, Sacramento, and San Mateo Assessor Parcels Data.
Figure 12: Board of Equalization, Annual Report: Statistical Tables, Table 14.a
Figure 13: Ibid.a
Figure 14: Board of Equalization, Annual Report: Statistical Tables, Table 14 and Table 21A. State Controller’s Office data (Hotel and Utility Taxes).a
Figure 15: Ibid.
Figure 16: U.S. Census, State and Local Government Finances by Level of Government and by State.
Figure 17: U.S. Census, Government Organization: 1942 to 2012.a
Figure 18: Ibid.a
Figure 19: Counties of Los Angeles, Riverside, Sacramento, San Diego, San Mateo, Assessor Parcels Data. U.S. Census Building Permits Survey.
Figure 20: Counties of Los Angeles, Sacramento, and San Mateo Assessor Parcels Data.a
Figure 21: Ibid.
Figure 22: State Controller’s Office, Construction Development Tax Revenues and U.S. Census Building Permits Survey.
Figure 23: Construction Development Tax Revenues and Sacramento State: Institute for Social Research, California Elections Data Archive.a
Figure 24: California State Treasurer, California Debt and Investment Advisory Commission, Mello–Roos.
Figure 25: IPUMS–USA, University of Minnesota, www.ipums.org (American Community Survey).a
Figure 26: Ibid.
a With authors’ calculations.