
California's Employment Development Department released statewide jobs data for October 2016 on November 18. (The U.S. Bureau of Labor Statistics released October jobs data for all U.S. states the same day and for metropolitan regions across the country on November 30.)
Workers Pouring Back Into California Job Market. The monthly survey of employers showed that the number of nonfarm jobs in the state grew by a net 31,200 in October on a seasonally adjusted basis. The October jobs report also showed continuing strong growth in the state's labor force--that is, the number of Californians actively working or searching for work. In the monthly survey of households, the labor force grew by 90,000 on a seasonally adjusted basis. Monthly labor force figures are rough estimates subject to a lot of sampling error, but if they are accurate, California's labor force now has grown more in the past four months than it did in the previous 21 months combined.
With the growth of the labor force, the official unemployment rate (the number of those employed divided by civilian labor force) held steady at 5.5% in October. This is somewhat higher than the current nationwide 4.9% unemployment rate, but far below the peak California unemployment rate of 12.2% six years ago. California's 5.5% unemployment rate ties with that of Nevada and Rhode Island, now ranking 40th among the 50 states.
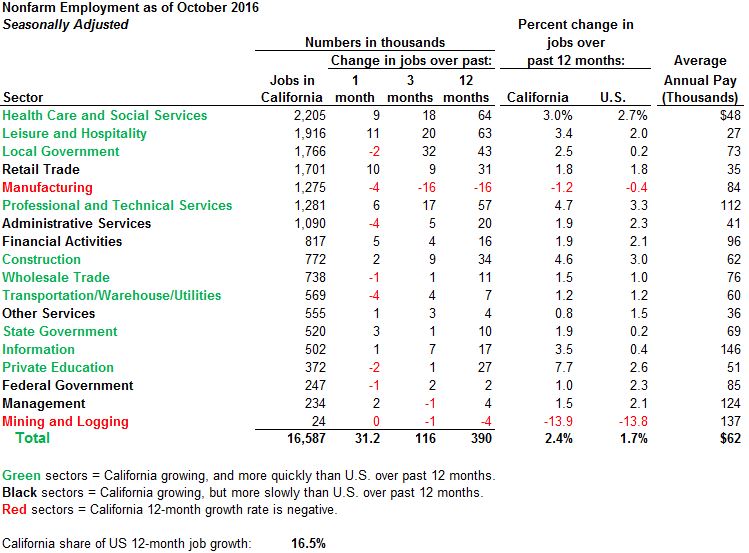
As shown below, nonfarm employment in California is up 390,000 (2.4%) over the last 12 months. For the 18 major job sectors we track, California jobs expanded at a faster rate than the nation's over the past year in 10 sectors (shown in green below), expanded at a slower rate than the nation in 6 sectors (in black), and contracted in 2 sectors (in red). (A month ago, in the September jobs report, 11 sectors were green on this chart.) Over the past year, the sectors with the strongest growth rates have been private schools and universities, professional and technical services (including a lot of the technology subsectors), and construction. Manufacturing and mining (oil and gas) jobs have declined. In the latter case, that decline has slowed in recent months.
Most of California Has Seen Faster Job Growth Than the Nation. Over the past year, around two-thirds of California metropolitan statistical areas (MSAs) have recorded job growth at a faster rate than the nation as a whole, as shown below. Los Angeles County (shown below as the Los Angeles-Long Beach-Glendale metropolitan division [MD], a part of a larger MSA) has had a job growth rate roughly mirroring the nation as a whole, but lagging most other parts of California, such as the Bay Area, Sacramento, Orange County (shown below as the Anaheim-Santa Ana-Irvine MD), San Diego, and the Inland Empire.

As shown here, among the U.S.'s 51 largest MSAs, this past year's rate of job growth in both the Silicon Valley and the Sacramento region ranked in the top 10.
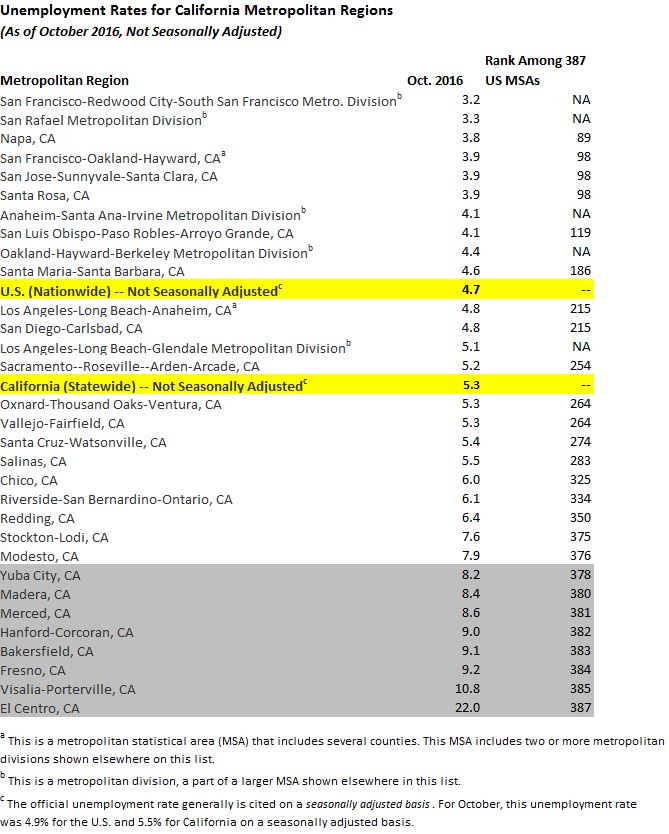
Unemployment Rates Remain Elevated in Some Regions. As shown below, most California metropolitan regions continue to have unemployment rates higher than those of the nation as a whole. While the Bay Area, Orange County, and Santa Barbara County, among other regions, recorded unadjusted unemployment rates below that of the U.S. in October, most other California metro regions had higher jobless rates than the U.S. Shaded in gray below are the eight California metropolitan regions on the top 10 list of U.S. metro unemployment rates in October. As is often the case in the monthly statistics, California's inland and agricultural regions have some of the highest jobless rates in the country.
Follow @LAOEconTax on Twitter for regular California economy and tax updates.