California’s house prices have risen rapidly in recent years. Since bottoming out in late 2011, California’s median house price has increased by 45 percent—or about 10 percent per year—reaching around $450,000 as of September 2015. In some markets, increases have been more dramatic. Median house prices in San Francisco ($1.1 million) and Santa Clara ($926,000) counties grew by 15 percent and 13 percent, respectively, over the past year. Since 2011, house prices in these counties have grown by over 60 percent.
This rapid growth in house prices may raise some concerns that California is entering another housing bubble. A look at two conventional housing markets measures—price-to-rent and price-to-income ratios—shows somewhat mixed evidence. Prices appear to be in line with the underlying demand for housing suggested by rent levels. On the other hand, both prices and rents appear to be high relative to household incomes. This could suggest that the housing market is slightly overheated. Alternatively, it could reflect—as we discussed in detail in our March report California High Housing Costs: Causes and Consequences—increasing competition for housing which is in increasingly short supply. Taken together, this quick review of the state’s housing market shows, at most, limited evidence of overheating.
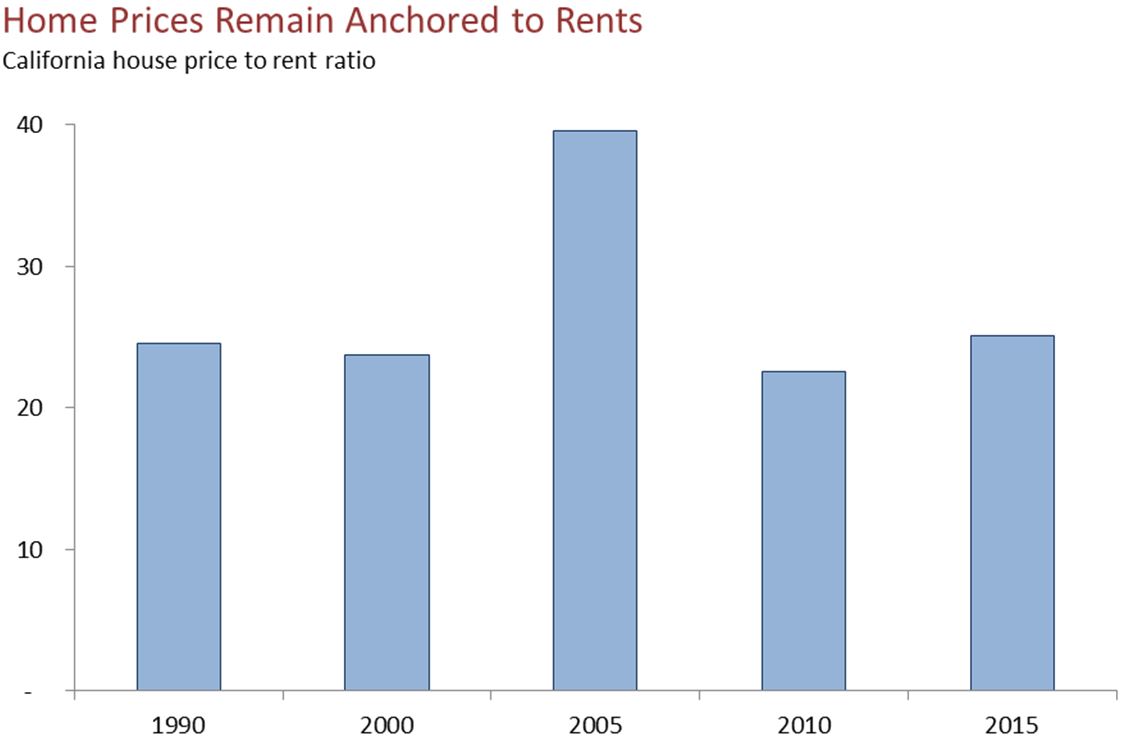
Rents Have Been Rising As Well. Housing rents are considered to better reflect underlying demand for housing and less prone to increases during periods of speculation than housing prices. For this reason, the ratio of home prices to rents is commonly used as a metric of whether or not housing markets are overheated. California’s price-to-rent ratio (median home price divided by twelve months of median rent) has hovered somewhere around 25 over the last few decades. During the housing bubble of the mid-2000s, the price-to-rent ratio exceeded 40. Currently, California’s price-to-rent ratio sits at about the historic norm of 25, as shown below. This reflects the fact that while home prices have been rising rapidly, rents in many parts of the state have been growing quickly as well.
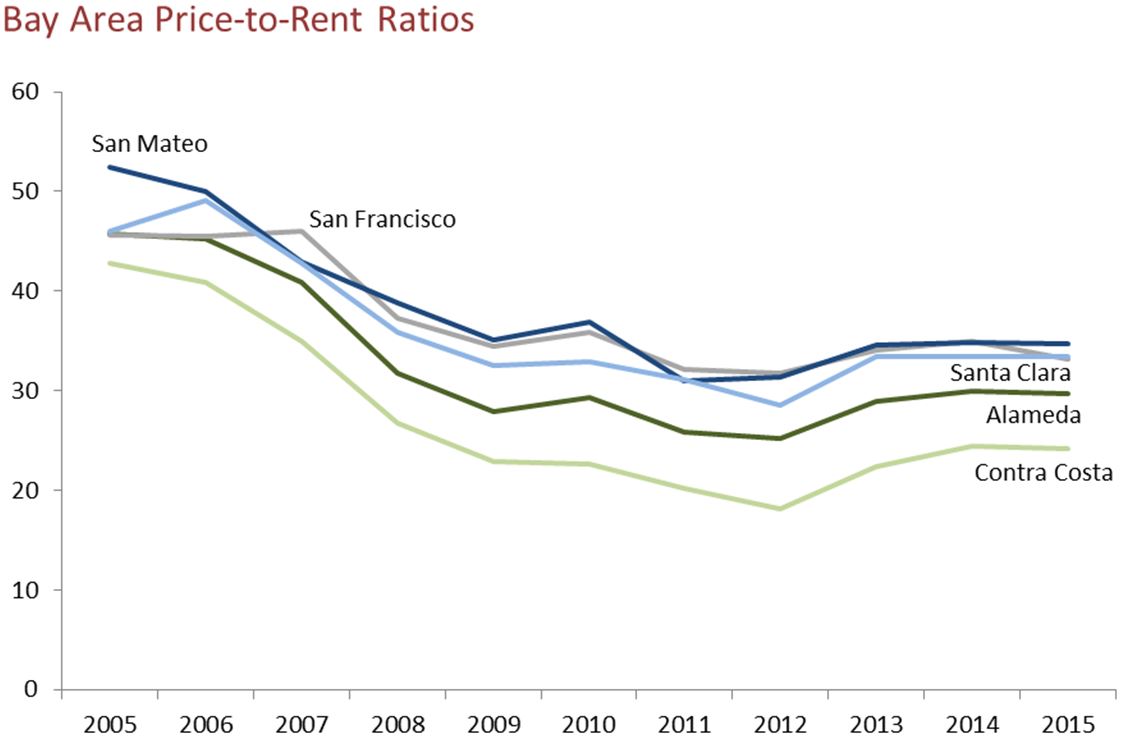
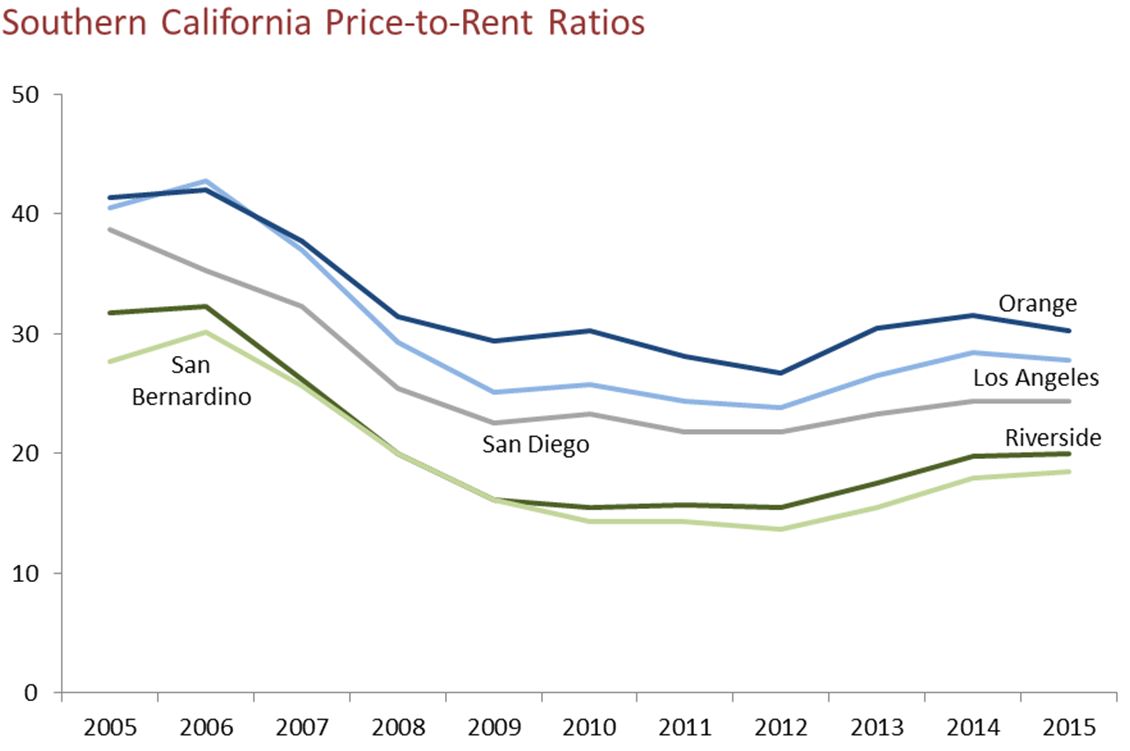
Price-to-rent ratios are higher in some parts of the state, particularly the Bay Area. San Francisco, Santa Clara, and San Mateo Counties all have ratios in excess of 30, as shown below. Nonetheless, price-to-rent ratios in these areas remain well below those seen during the mid-2000s. Southern California price-to-rent ratios also are displayed below.
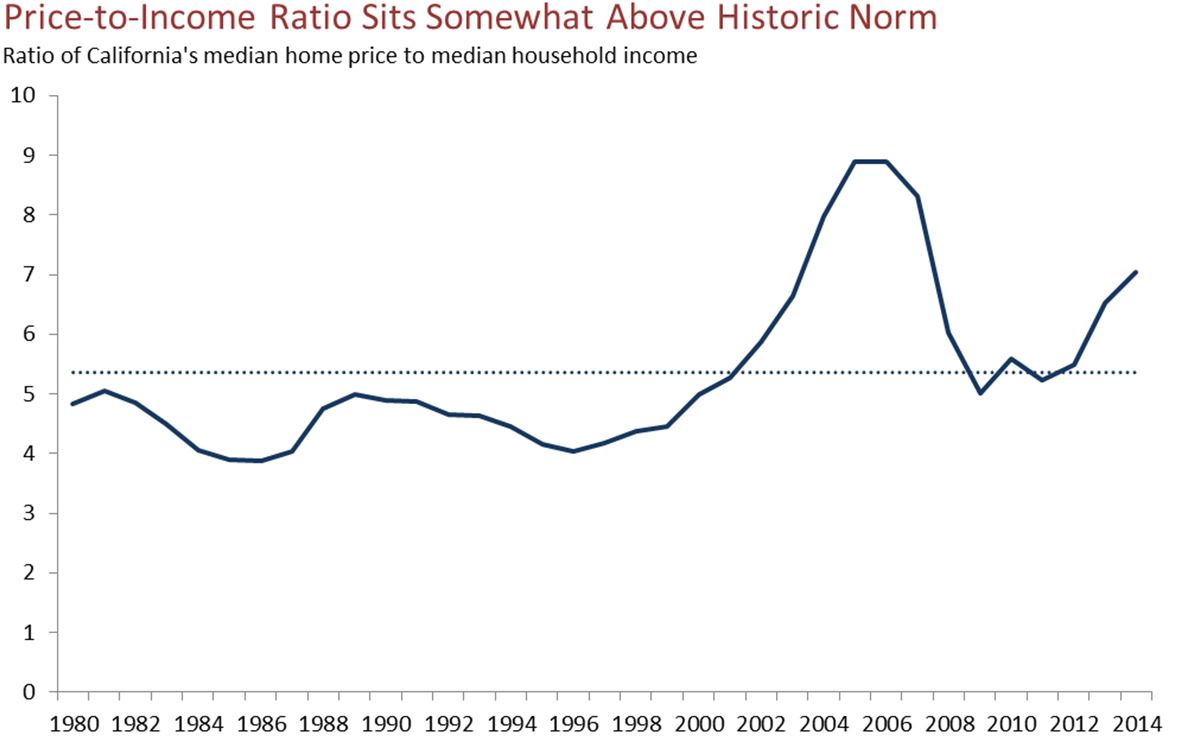
Prices and Rents Have Outpaced Incomes. Another metric often used to gauge the status of housing markets is the price-to-income ratio (median home price divided by median household income). If price-to-income ratios deviate significantly from historical trends, it can be an indication that prices are higher than can be supported in the long term by household incomes. As of 2014, California’s price-to-income ratio was about 7, as shown below. This is considerably higher than the state’s long-run average of 5.4, but well below levels seen during the mid-2000s housing boom when this ratio nearly reached 9. While California’s somewhat elevated price-to-income ratio could suggest prices are slightly overheated, it is possible that the recent rise largely reflects increasing competition for housing in many of the state’s extremely tight housing markets. As households in these markets compete for limited housing, they may be forced to spend a larger share of their income on housing to secure desirable locations.