
This morning, the U.S. Bureau of Labor Statistics (BLS) released state-level jobs and unemployment data for the month of August 2015. California's Employment Development Department (EDD) released more detailed data for California as well.
California seasonally-adjusted job growth rates over the past year, as reported by BLS, exceeded the nationwide growth rate for 13 of the 18 job sectors we track, as illustrated below. (Among these 13 job sectors, California's strongest annual job growth rates are in the technology-heavy professional and technical services sector and construction.) In 3 of the 18 sectors, California employment has grown, but more slowly than the nation as a whole. In manufacturing and mining/logging (principally oil sector jobs), California lost jobs over the past year, according to the BLS seasonally-adjusted data.
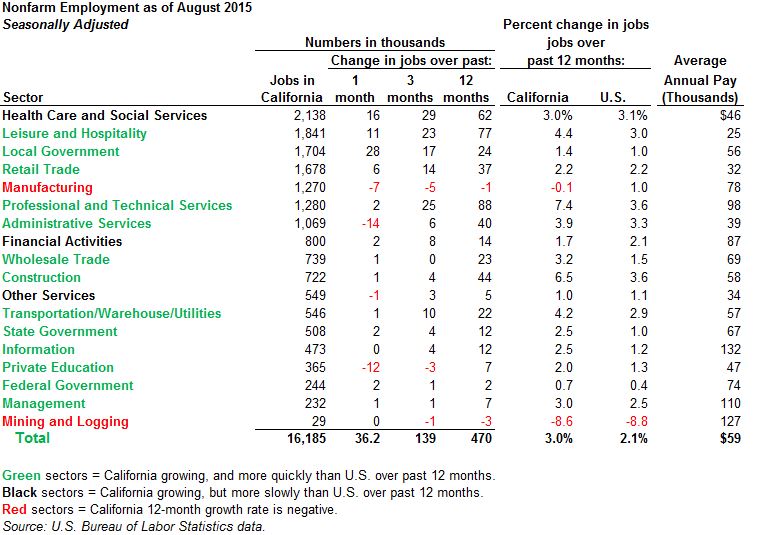
Key Numbers from Jobs Report. According to the BLS seasonally-adjusted data, California nonfarm employment increased by 36,200 in August. (The EDD numbers were slightly different, showing growth of 36,300 jobs in August.) As shown above, local government job growth in August was the key factor behind the increase, with the entirety of that sector's increase apparently attributable to school and community college district employment. (Despite this late-summer hiring growth, local government education employment remains just slightly above last August's totals in non-seasonally-adjusted data.) As shown here, California's 3.0% job growth over the past year ranks 7th among the 50 states, trailing South Carolina slightly. The official unemployment rate for the state, which was 7.4% one year ago, fell from 6.2% in July to 6.1% in August.
The number of farm wage and salary jobs recorded in seasonally-adjusted data from the monthly employers' survey increased by 1,800 in August to 416,000, according to EDD. (One year ago, there were 416,900 farm jobs reported in this dataset, or 0.2% more than there were last month.)
EDD County Data. EDD releases a large amount of local job data, including summary maps, with its monthly jobs reports.
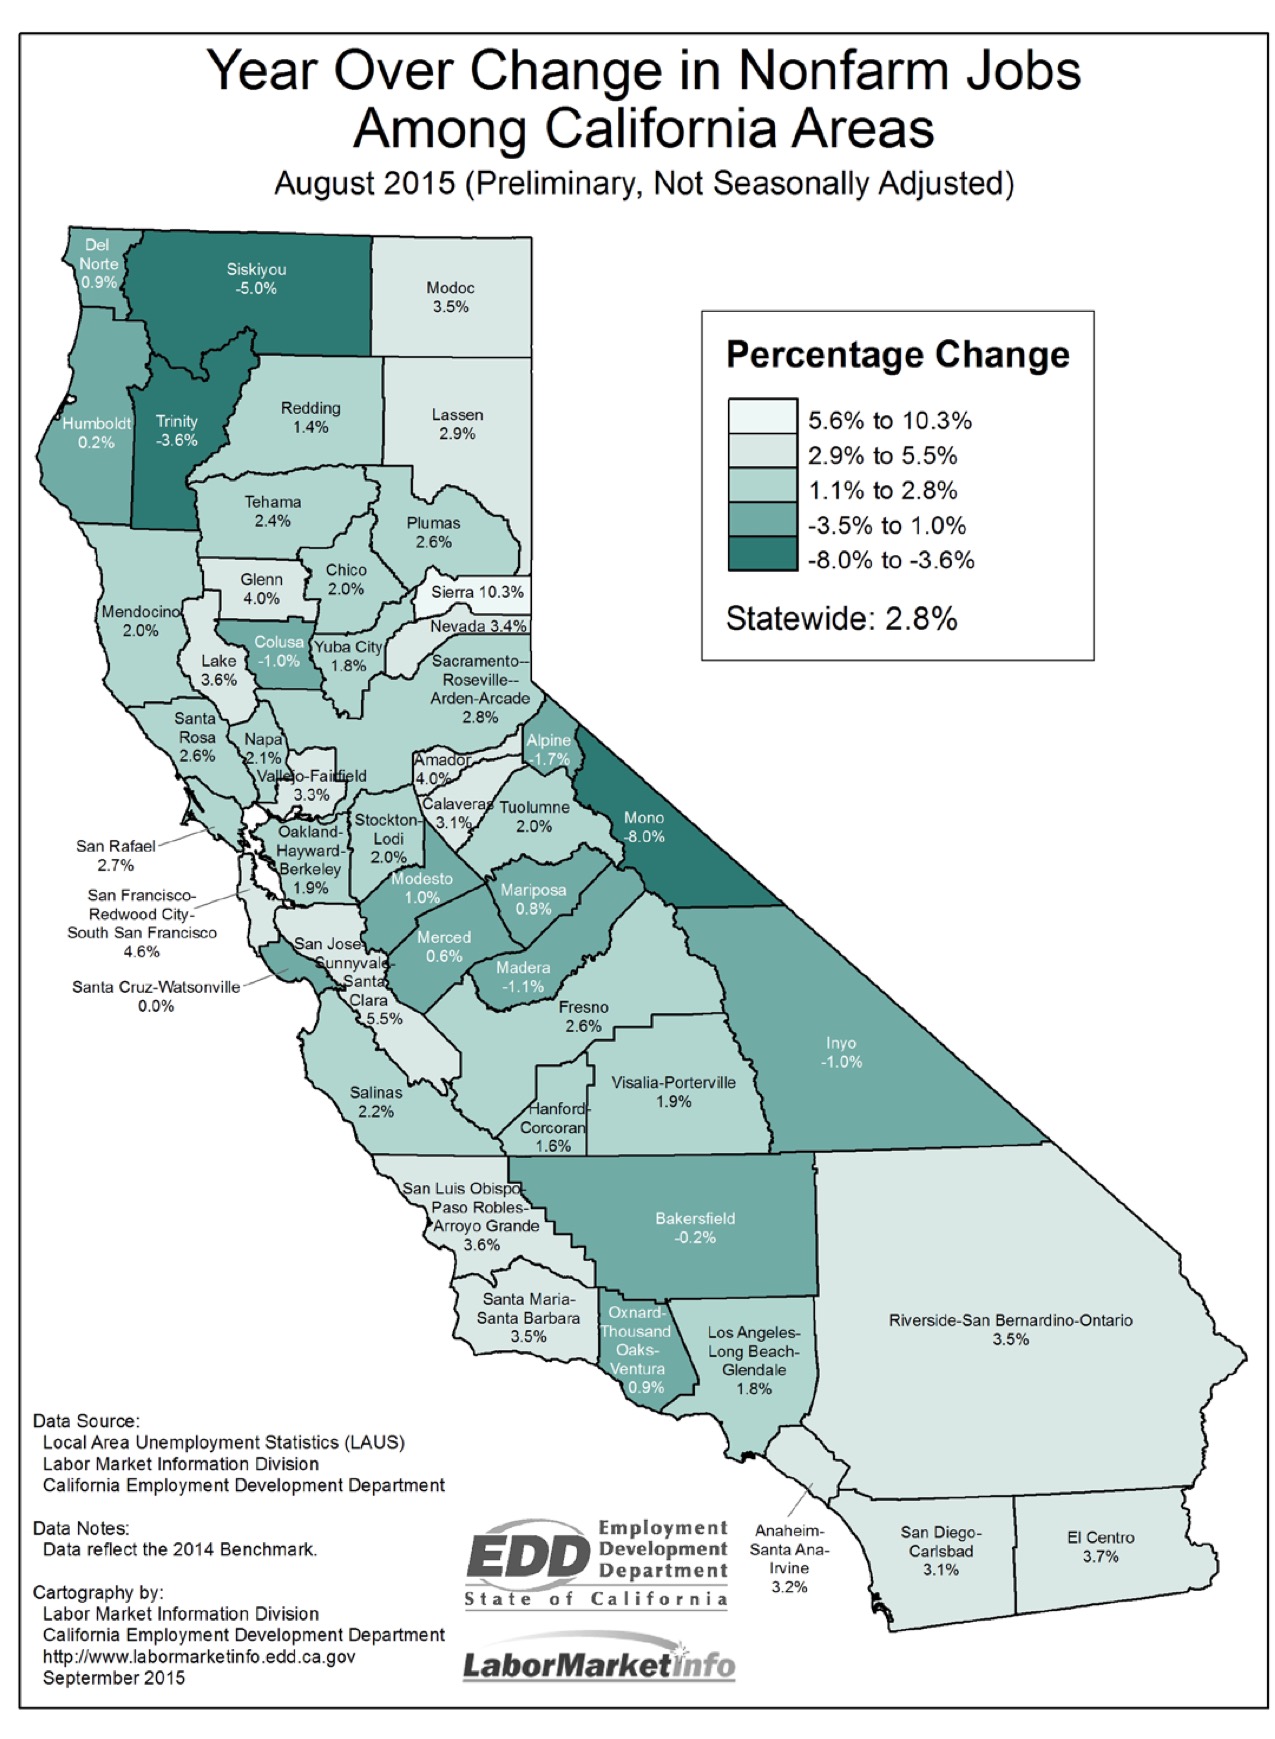
As shown in the EDD map below, where lighter shades of green mean more job growth over the past year, parts of the Bay Area (specifically, the San Jose and San Francisco metropolitan regions) have among the highest job growth rates in the state over the past year at well over 4% on a non-seasonally-adjusted basis. The Bay Area has benefited from strong growth in technology employment (as discussed later in this post). Various smaller jurisdictions also are reported to have had significant job growth over the past year. Sierra County's 10.3% job growth, for instance, came from private-sector job growth, according to EDD data. The Inland Empire (3.5%), Orange County (3.2%), and San Diego County (3.1%) are among other areas that have had faster job growth rates than the state as a whole (2.8%) over the past year on a non-seasonally-adjusted basis. Job growth rates in the Sacramento region and Fresno County are similar to the statewide growth rate. (The Sacramento area, we note, has experienced a 10% jump in restaurant jobs [up 6,700 in that sector alone] over the past year.) In Los Angeles County, the 1.8% year-over-year job growth rate trails the state as a whole. In Kern County, the number of jobs is down 0.2% over the past year, driven in large part by declines in oil prices and oil-sector employment.
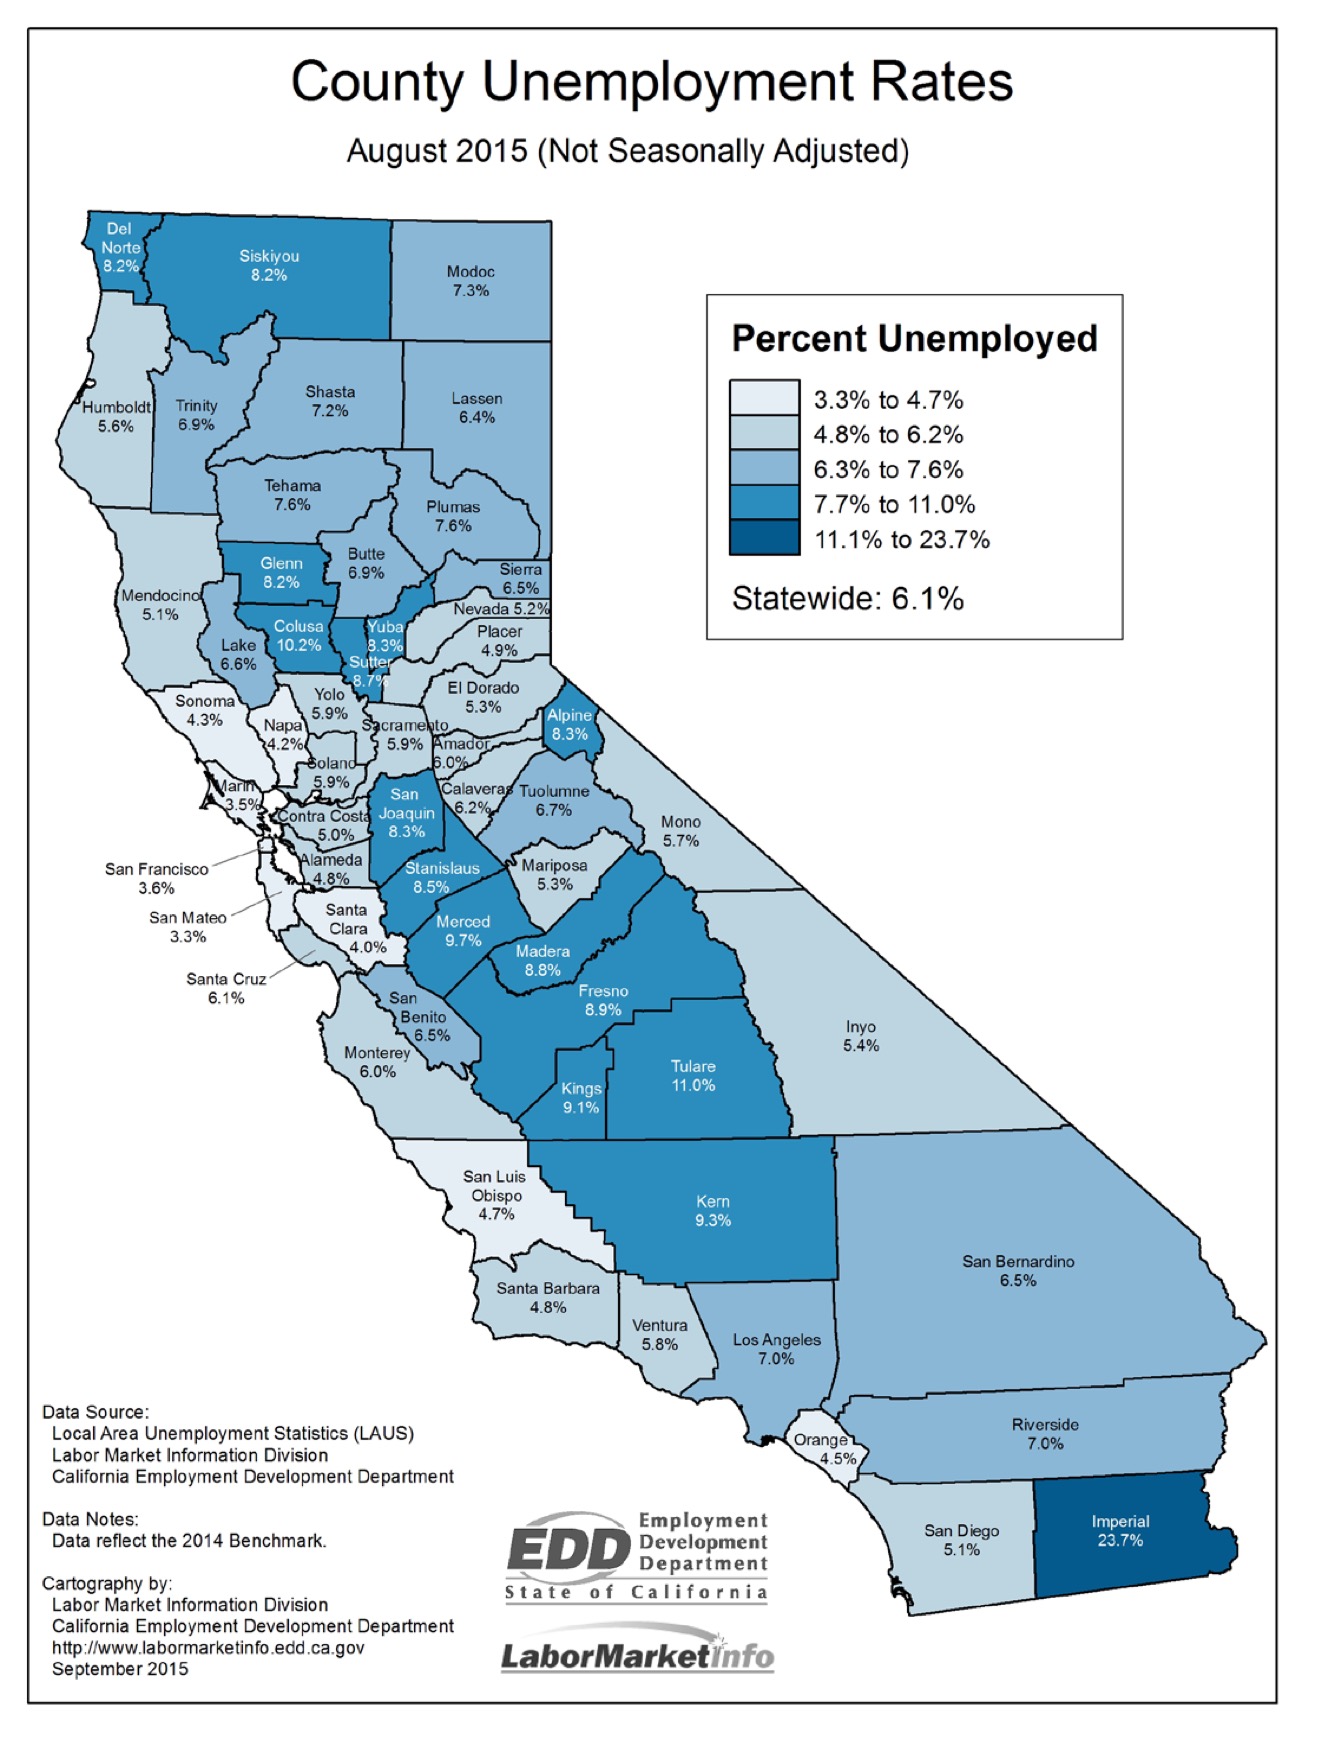
In the EDD map below, lighter shades of blue signify lower non-seasonally-adjusted unemployment rates as of August 2015. County unemployment rates under this measure ranged from 3.3% in San Mateo County to 23.7% in Imperial County. On a seasonally-adjusted basis, the unemployment rate for Los Angeles County has fallen 0.6 percentage points in just two months, dropping to 6.9% in August.
Bay Area Technology Sector. The strength of the Bay Area technology sector—and its important effects on state job and income growth of recent years—continues to be noteworthy. As of 2014, for example, California had 1.2 million (14%) of the nation's 8.3 million jobs in the professional and technical services sector, which includes a significant number of technology-related jobs, as well as jobs in law, non-technology consulting, scientific research, and some other highly-skilled sectors. Over the past year, BLS non-seasonally adjusted data shows that 81,200 of the 307,000 net new jobs created in this sector—fully 26% of the total—are in California. Of those 81,200 new professional and technical services jobs in California, more than half were created in the Bay Area. If the Bay Area technology boom were to slow in the near term, it could cause California's overall job and economic trends to weaken considerably.
Seasonal Adjustments. Most analysts, including ourselves, focus much of our attention on jobs reports' seasonally-adjusted data (described here and here). It seems possible that changes of recent years in seasonal hiring trends—in school district employment, for example—could have affected this month's key seasonally-adjusted job numbers. This may become apparent in the coming few months as additional data becomes available about employment trends in the state.