Lisa Qing

March 5, 2026
The 2026-27 Budget
California Community Colleges
- Introduction
- Overview
- Apportionments
- Select Categorical Programs
- Enrollment
- Calbright College
- Healthy School Food Pathways
- Common Cloud Data Platform
- Credit for Prior Learning
Summary
Brief Covers the California Community Colleges (CCC). This brief analyzes the Governor’s Proposition 98 spending proposals for CCC. It focuses on apportionments, enrollment growth, Calbright College, and several smaller proposals involving ongoing funding.
Recommend Prioritizing Apportionments Cost‑of‑Living Adjustment (COLA). The Governor’s largest ongoing CCC proposal is $241 million to support a 2.41 percent COLA for apportionments. This general purpose funding would help districts cover core operating costs while also providing flexibility to address local conditions. The Legislature will receive an updated COLA rate in the spring. We recommend prioritizing this proposal for available Proposition 98 funding at that time.
Recommend Funding Enrollment Growth Beginning in 2026‑27. The Governor’s budget provides $55 million for additional systemwide enrollment growth in 2025‑26, increasing the current‑year target from the enacted level of 0.57 percent to 1.57 percent. The Governor also proposes $32 million ongoing for further growth of 0.5 percent in 2026‑27. We recommend prioritizing funding enrollment growth, as about half of districts are exceeding their current targets and districts could continue to see enrollment pressure from factors including regional population growth, elevated unemployment rates, and dual enrollment expansion efforts. Depending on available resources, the Legislature could consider supporting a higher or lower amount of growth than the Governor proposes. Regardless, we recommend funding growth beginning in 2026‑27, without revising the 2025‑26 growth target. The state sets growth targets based in part on the amount of enrollment it has deemed it can afford, and covering the higher costs when districts exceed those targets could incentivize districts to disregard the state’s budget constraints.
Recommend Bringing Calbright Onto Student‑Centered Funding Formula (SCFF). The Governor’s budget proposes a $38 million ongoing increase for Calbright College, bringing its ongoing funding level to $53 million. Over the past seven years, this statewide online college has made progress toward startup milestones related to enrolling students, designing programs, and receiving accreditation. Nonetheless, questions remain about whether it is serving its target student population in a cost‑effective way. Moreover, the administration has not provided a clear rationale for its proposed funding level for Calbright or linked that funding to any specific expectations. As an alternative, we recommend transitioning Calbright to SCFF by 2027‑28. This approach would link Calbright’s funding to enrollment expectations, provide a known funding rate per student, and treat Calbright consistently with other districts. During the transition, the Legislature could consider providing $28 million one time (instead of the proposed $38 million ongoing) in 2026‑27 if it wishes to sustain Calbright’s current spending level.
Recommend Rejecting Three Smaller Proposals. The Governor proposes $14 million ongoing for Healthy School Food Pathways, a set of training programs for K‑12 school food service staff operated by a nonprofit organization. We recommend rejecting this proposal because the programs have unusually high state costs, mixed student outcomes, and a large amount of unspent funds. In addition, the Governor proposes another round of funding for two CCC initiatives supported in last year’s budget—the Common Cloud Data Platform ($36 million one time and $5 million ongoing) and credit for prior learning ($35 million one time and $2 million ongoing). We think both of these proposals are premature, as last year’s funding remains available to support activities over the next couple of years and the outcomes of those activities are not yet known.
Introduction
Brief Focuses on CCC. The CCC system is one of California’s three public higher education segments. The system consists of 115 colleges operated by 72 locally governed districts located throughout the state, plus one statewide online community college. The colleges offer a breadth of academic programs, including lower‑division transferable coursework, career technical education, precollegiate basic skills instruction, and baccalaureate degrees in certain occupational fields. This brief analyzes the Governor’s 2026‑27 Proposition 98 budget proposals for CCC. We begin by describing the Governor’s overall budget plan for CCC. The next seven sections of the brief focus on the Governor’s proposals relating to (1) apportionments, (2) select categorical programs, (3) enrollment growth, (4) Calbright College, (5) Healthy School Food Pathways, (6) the Common Cloud Data Platform, and (7) credit for prior learning.
Overview
In this section, we describe the Governor’s overall budget plan for CCC and provide a few overarching comments about it.
Governor’s Budget Plan
Total CCC Funding Is $20 Billion in 2026‑27 Under Governor’s Budget. This reflects a 7.1 percent increase over the revised 2025‑26 level. As Figure 1 shows, $14 billion (71 percent) of CCC support in 2026‑27 would come from Proposition 98 funds. Under Proposition 98, the state calculates an annual “minimum guarantee” for school and community college funding based on certain inputs, including General Fund revenues. This funding covers community colleges’ main operations. An additional $803 million in non‑Proposition 98 General Fund would cover other costs, including debt service on certain state facilities bonds, a portion of faculty retirement costs, and Chancellor’s Office operations.
Figure 1
Total CCC Funding Increases Under Governor’s Budget
(Dollars in Millions Except Funding Per Student)
|
2024‑25 |
2025‑26 |
2026‑27 |
Change From 2025‑26 |
||
|
Amount |
Percent |
||||
|
Proposition 98 |
|||||
|
General Fund |
$9,794 |
$8,441 |
$9,371a |
$930 |
11.0% |
|
Local property tax |
4,335 |
4,558 |
4,785 |
227 |
5.0 |
|
Subtotals |
($14,129) |
($12,999) |
($14,156) |
($1,157) |
(8.9%) |
|
Other State |
|||||
|
Other General Fund |
$625 |
$670 |
$803 |
$133 |
19.8% |
|
Lottery |
300 |
308 |
308 |
— |
— |
|
Special fundsb |
53 |
106 |
93 |
‑13 |
‑12.1 |
|
Subtotals |
($979) |
($1,084) |
($1,205) |
($120) |
(11.1%) |
|
Other Local |
|||||
|
Enrollment feesc |
$440 |
$440 |
$441 |
$1 |
0.3% |
|
Other local revenued |
3,485 |
3,513 |
3,540 |
28 |
0.8 |
|
Subtotals |
($3,925) |
($3,953) |
($3,982) |
($29) |
(0.7%) |
|
Federal |
$457 |
$457 |
$457 |
— |
— |
|
Totals |
$19,489 |
$18,493 |
$19,799 |
$1,306 |
7.1% |
|
FTE studentse |
1,096,150 |
1,090,231 |
1,094,809 |
4,578 |
0.4% |
|
Funding per studentf |
$12,889 |
$11,923 |
$12,930 |
$1,007 |
8.4 |
|
aIncludes $44 million in withdrawals from the Proposition 98 Reserve. bIncludes reimbursements. cThe most recent data available is for 2024‑25. Under the administration’s estimates, these amounts are held flat for 2025‑26. For the budget year, the administration grew the current‑year amount mainly to reflect proposed enrollment growth under the Governor’s budget. dPrimarily consists of revenue from student fees (other than enrollment fees), sales and services, and grants and contracts, as well as local debt‑service payments. eReflects the administration’s estimates of budgeted FTE students. Estimates for 2025‑26 and 2026‑27 reflect proposed enrollment growth of 1.57 percent and 0.5 percent respectively, as well as other enrollment adjustments. fReflects Proposition 98 funding, including reserve withdrawals, per budgeted FTE student. |
|||||
|
FTE = full‑time equivalent. |
|||||
Beyond State Funds, CCC Receives Support From Various Other Sources. Much of CCC’s remaining funding comes from enrollment fees, other student fees, and various local sources (such as revenue from facility rentals and community service programs). The Governor proposes no increase to enrollment fees for 2026‑27. Since summer 2012, CCC enrollment fees have been $46 per unit, or $1,380 for a full‑time student taking 30 semester units per year. Community college fees in California remain the lowest of any state and significantly below the average at other community colleges nationally (about $5,300 in 2024‑25).
Proposition 98 Per‑Student Funding Grows Under Governor’s Budget. Under the Governor’s budget, Proposition 98 funding per student at CCC would be $12,930 in 2026‑27—an increase of $1,007 (8.4 percent) over the revised 2025‑26 level. Per‑student funding would reach an all‑time high in unadjusted dollars. Adjusting for inflation, however, the 2026‑27 level would be below the 2024‑25 peak by about $800 per student.
Governor Has Several Proposition 98 Spending Proposals for CCC. As Figure 2 shows, the Governor proposes a total of $1.2 billion in new Proposition 98 spending for CCC across the budget window (2024‑25 through 2026‑27). Of this amount, $363 million is for ongoing augmentations and $857 million is for one‑time purposes. The largest ongoing proposal is a 2.41 percent COLA for apportionments. Notably, the Governor also proposes ongoing funding to support 0.5 percent systemwide enrollment growth in 2026‑27, on top of an additional 1 percent enrollment growth above the enacted level in 2025‑26. The largest one‑time proposal is to repay a deferral adopted in last year’s budget.
Figure 2
Governor Proposes New CCC Ongoing and
One‑Time Spending
2024‑25 Through 2026‑27 (In Millions)
|
Ongoing Spending |
|
|
COLA for apportionments (2.41 percent) |
$241 |
|
Calbright College |
38 |
|
Enrollment growth (0.5 percent) |
32 |
|
COLA for select categorical programs (2.41 percent)a |
31 |
|
Healthy School Food Pathways program |
14 |
|
Common Cloud Data Platform |
5 |
|
Credit for prior learning |
2 |
|
Subtotal |
($363) |
|
One‑Time Spending |
|
|
2025‑26 deferral repayment |
$408 |
|
Deferred maintenance |
121 |
|
Student support block grant |
100 |
|
Higher 2025‑26 apportionments costs |
89 |
|
Additional 2025‑26 enrollment growth (1.0 percent)b |
55 |
|
Common Cloud Data Platform |
36 |
|
Credit for prior learning |
35 |
|
Higher apprenticeship costsc |
13 |
|
Subtotal |
($857) |
|
Total Changes |
$1,220 |
|
aApplies to the Adult Education Program, apprenticeship programs, CalWORKs student services, campus child care support, Disabled Students Programs and Services, Extended Opportunity Programs and Services, and mandates block grant. bIncreases budgeted growth from the enacted 2025‑26 level of 0.57 percent to 1.57 percent. The associated ongoing cost is built into apportionments in 2026‑27. cRelated and supplemental instruction costs for apprenticeship programs in 2024‑25 and 2025‑26 are higher than budgeted. |
|
|
COLA = cost‑of‑living adjustment. |
|
Governor’s CCC Budget Plan Includes Proposition 98 Reserve Funding. The Proposition 98 Reserve is an account designated for school and community college programs. Under the Governor’s budget, a mandatory withdrawal from this reserve covers $44 million in community college apportionments costs (and $363 million in school district costs) in 2026‑27. In addition to this mandatory withdrawal, the Governor’s budget also includes mandatory deposits into the reserve in 2024‑25 and 2025‑26 due to higher estimated capital gains revenue, as well as a discretionary deposit in 2025‑26. After all of these actions, the reserve would have a balance of $4.1 billion at the end of 2026‑27.
Governor’s Budget Creates Proposition 98 Settle‑Up Obligation. As we discuss in The 2026‑27 Budget: Proposition 98 Guarantee and K‑12 Spending Plan, the Governor’s budget appropriates $5.6 billion less for schools and community colleges in 2025‑26 than the estimated minimum guarantee in that year. If revenues meet the Governor’s estimates in 2025‑26, this would create a $5.6 billion settle‑up obligation to schools and community colleges that the state would need to pay in the future. State law does not specify what share of these funds would go to community colleges. If the Legislature were to allocate the funds in proportion to the current split of Proposition 98 spending between the two segments, an estimated $608 million would go to community colleges.
LAO Comments
Underlying Revenue Estimates Have Downside Risk. The Governor’s estimates of the Proposition 98 minimum guarantee are based on revenue projections that do not account for the risk of a stock market downturn. As we discuss in The 2026‑27 Budget: Overview of the Governor’s Budget, several signs suggest the stock market is overvalued and at elevated risk of a downturn. If revenues were to fall short of the Governor’s projections in the budget year, the guarantee would decrease by about 40 cents for each dollar of lower revenue, leaving less capacity for community college spending. We recommend the Legislature prepare for the possibility that the guarantee comes in lower than the Governor projects. Preparing for such a scenario means being cautious about new commitments; building budget resiliency to protect existing programs; and identifying spending proposals that the Legislature would be willing to reduce, delay, or reject.
CCC Spending Plan Contains a One‑Time Cushion. The Governor’s budget allocates some ongoing 2026‑27 Proposition 98 funds for one‑time spending at the community colleges. This budgeting approach creates a cushion that helps protect ongoing programs. The one‑time spending will expire in 2027‑28, freeing up funds that could help the state accommodate a possible decrease in the minimum guarantee before having to reduce programs. Under the Governor’s budget, the amount of the cushion is $241 million, equating to 1.7 percent of Proposition 98 spending on the community colleges in 2026‑27. (This amount reflects the use of $286 million in ongoing funds for one‑time spending, partly offset by the use of $44 million in one‑time Proposition 98 Reserve funds for ongoing program costs.) This is a moderately sized cushion, relative to those included in previous budgets. If the Legislature uses the Governor’s revenue estimates, we recommend maintaining a cushion of at least this size to mitigate the risk of future declines in the guarantee. This would be a helpful tool for managing volatility, though it would not on its own address the range of declines in the guarantee that could potentially occur.
Recommend Using One‑Time Funds to Build Budget Resiliency. Between the one‑time cushion and upward revisions to the 2024‑25 and 2025‑26 minimum guarantee, the Governor’s budget includes a significant amount of one‑time funding for CCC. The Governor uses these funds for various one‑time purposes, including a deferral repayment, deferred maintenance projects, a student support block grant, and prior‑year and current‑year costs for apprenticeship related and supplemental instruction (RSI). Of these proposals, we first recommend prioritizing the repayment of the deferral adopted in last year’s budget. This would restore the state’s community college apportionments payments to their regular schedule and reduce future cost pressures. We recommend prioritizing funding next for deferred maintenance projects. The CCC system reports a $2.2 billion deferred maintenance backlog. Addressing this backlog could help avoid higher project costs in the future as well as potential programmatic disruptions. Beyond these priorities, we think the proposed student support block grant is reasonable. This block grant provides districts with flexible funding they could use for a range of student services linked to local conditions. Lastly, although we do not have major concerns with covering higher prior‑year and current‑year costs for apprenticeship RSI, we view this proposal as a lower priority. The RSI program reimburses apprenticeship sponsors (typically employers and labor unions) for a portion of their classroom instruction costs. The state is not required to increase funding for this program when costs come in higher than budgeted, and it is unclear if retroactive funding impacts the amount of instruction that sponsors choose to provide.
Recommend Focusing Ongoing Spending on Core Programs. The remainder of this brief focuses on seven budget proposals that have ongoing spending components. (Some of these proposals also have one‑time spending components.) The largest of these augmentations is for an apportionments COLA and enrollment growth. We recommend prioritizing these proposals within available ongoing funding, as they help districts cover core cost pressures while providing some flexibility to address local conditions. The Governor also proposes smaller ongoing augmentations for various targeted purposes, including Calbright College, the Healthy School Food Pathways program, the Common Cloud Data Platform, and credit for prior learning. We have concerns about each of these targeted proposals, as we discuss in later sections of the brief.
Apportionments
In this section, we focus on general purpose funding for community college districts, which is known as “apportionments.” We begin this section by providing background on community college districts’ core operating costs. We then explain how the state provides funding for those costs. Next, we describe the Governor’s proposal to provide a COLA for apportionments, assess the proposal, and provide a recommendation.
Cost Pressures
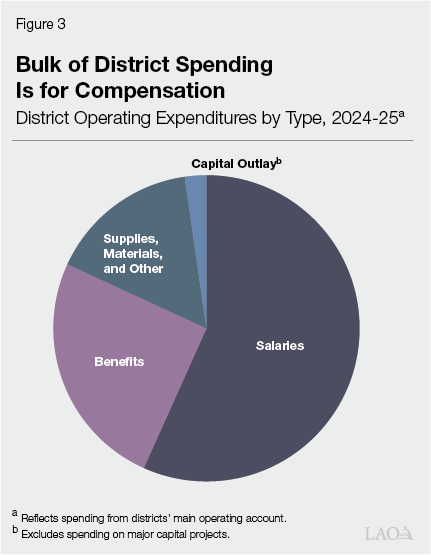
Compensation Is Largest Community College Operating Cost. Community college districts use the bulk of their apportionment funding for employee compensation. As Figure 3 shows, salaries and benefits (including retirement benefits, health care benefits, workers’ compensation, and unemployment insurance) accounted for more than 80 percent of district spending in 2024‑25. The remainder of district spending was for various other core operating costs, including insurance, utilities, software, equipment, and supplies.
Staffing Levels Have Rebounded Since Pandemic. At the start of the pandemic, community college districts decreased their staffing levels in response to steep enrollment declines. Over the past three years, however, staffing has gradually rebounded. As of fall 2024, districts employed about 66,100 full‑time equivalent (FTE) employees systemwide—up about 400 FTE employees (0.6 percent) from fall 2019. Staffing has somewhat outpaced enrollment, which decreased by 0.3 percent during this period. Slightly more than half of total FTE employees systemwide are in academic positions, including faculty and educational administrators. The remainder (known as “classified employees”) are in non‑academic positions, including many types of staff and other administrators.
Salary Decisions Are Made Locally. Most community college employees are represented by labor unions. Several unions represent faculty throughout the state, with the largest two being the California Federation of Teachers and the California Teachers Association. The California School Employees Association is the largest union for classified staff. Each community college district negotiates with the local branches of these unions. Community college districts and their local unions make key compensation decisions, including salary decisions, through collective bargaining. In negotiating salary increases with their local unions, districts typically account for a number of factors, including the COLA the state is providing for apportionments, changes in housing and other costs for employees, salary competitiveness, and the need to address non‑salary cost pressures.
Salaries Have Generally Increased With Inflation. Over the past five years, salaries for community college employees have generally grown at rates similar to inflation, with some variation by employee group. From fall 2019 to fall 2024, the systemwide average salary increased by 25 percent for tenured and tenure‑track faculty, while it increased by 20 percent for classified support staff. For comparison, the California consumer price index increased by an estimated 23 percent during this time.
Districts’ Pension Costs Also Have Been Rising. Community college academic employees participate in the California State Teachers’ Retirement System (CalSTRS), while non‑academic employees participate in the California Public Employees’ Retirement System (CalPERS). Because employer contribution rates for these two systems are set by their respective state boards, all community college districts statewide are subject to the same rates. Districts’ pension costs have generally been increasing over time. In 2014‑15, districts’ employer contribution rate was 8.9 percent of payroll for CalSTRS and 11.8 percent of payroll for CalPERS. In 2025‑26, those rates are up to 19.1 percent of payroll for CalSTRS and 26.8 percent of payroll for CalPERS.
Districts Regularly Face Various Other Cost Pressures. Similar to the other education segments, community college districts have faced recent increases in costs for health benefits, insurance, equipment, supplies, and utilities. Health benefits are the largest of these remaining cost pressures. In the past few years, districts have faced greater pressure in this area than normal because premiums have been increasing at historically high rates. District contributions to employee health premiums are collectively bargained. Districts commonly cover a large share of the premium increases for their full‑time employees. Coverage for part‑time employees varies widely among districts. When districts provide benefits to part‑time employees, they often cover a lower share of the premium increases.
Funding
Community Colleges Rely Heavily on Funding From Apportionments. All 72 locally governed community college districts receive funding from apportionments. Apportionments account for about 70 percent of total Proposition 98 CCC funding. Based on February 2026 estimates from the Chancellor’s Office, districts are collectively generating $10.1 billion in apportionment funding in 2025‑26.
State Has Formula to Determine Districts’ Apportionment Funding. Historically, districts received apportionment funding based almost entirely on student enrollment. In 2018‑19, the state adopted a new formula—SCFF. This formula is intended to create stronger incentives for colleges to enroll lower‑income students and improve outcomes for them and students overall. Under SCFF, districts receive apportionment funding for regular credit courses based on three components: (1) a base allocation linked to enrollment, (2) a supplemental allocation linked to low‑income student counts, and (3) a student success allocation linked to specified student outcomes. These three components account for about 70 percent, 20 percent, and 10 percent of apportionment funding, respectively. Districts continue to receive apportionment funding for noncredit courses, as well as credit courses for dual enrollment students and incarcerated students, based entirely on enrollment.
Some Districts Receive Additional Funding Through Certain Funding Protections. Each year, a district’s apportionment funding is based on the highest of three amounts: (1) the amount calculated under SCFF, (2) the amount calculated under a funding protection called “stability,” and (3) the amount calculated under another funding protection called “hold harmless.” A district’s stability amount is its SCFF‑calculated amount in the previous year, adjusted for any COLA provided by the state. Beginning in 2025‑26, a district’s hold harmless amount is its total apportionment funding in 2024‑25, with no COLA adjustment. Based on February 2026 estimates from the Chancellor’s Office, 34 districts are receiving their SCFF‑calculated amounts in 2025‑26, 25 districts are on stability (receiving a combined $76 million in apportionment funding above their SCFF‑calculated amounts), and 13 districts are on hold harmless (receiving a combined $86 million above their SCFF‑calculated amounts). On average, apportionment funding per student is higher across districts on hold harmless ($9,491) and districts on stability ($9,189), compared to districts receiving their SCFF‑calculated amounts ($8,882). This is largely because these funding protections provide districts with more apportionment funding than they would generate based on their enrollment and other factors.
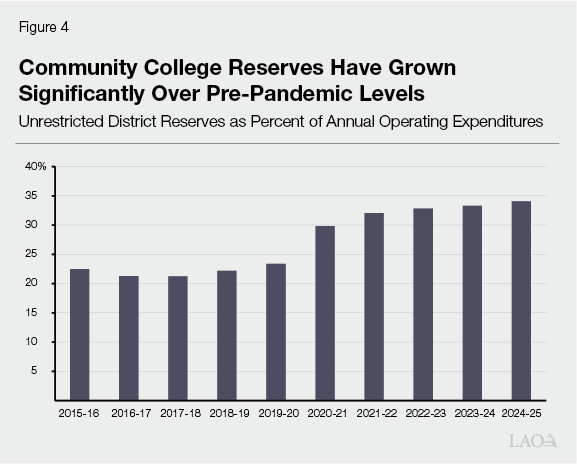
Systemwide Reserves Continue to Increase. Community college districts maintain local reserves to help manage revenue declines or unexpected costs. Based on best practices from the Government Finance Officers Association, the Chancellor’s Office recommends that districts maintain unrestricted reserves worth a minimum of 16.7 percent (two months) of annual expenditures. As Figure 4 shows, districts’ unrestricted reserves have increased over the past several years. Whereas unrestricted reserves totaled $2 billion (23 percent of expenditures) in 2019‑20, they grew to $3.8 billion (34 percent of expenditures) in 2024‑25. The increase in reserves over the past five years is likely the result of several factors—including significant increases in state funding, an influx of federal relief funds during the pandemic, and savings from lower staffing levels during the pandemic.
Proposals
Governor Proposes to Cover Higher Apportionments Costs in 2025‑26. The Governor’s budget increases current‑year apportionment funding by $89 million Proposition 98 General Fund, reflecting that apportionments costs are coming in higher than projected at budget enactment. Under SCFF, apportionment costs can come in higher than projected for a number of reasons, including higher low‑income student counts, better student outcomes, or enrollment adjustments other than growth. (The $89 million excludes costs associated with the Governor’s proposal to increase the current‑year growth target, which we discuss in a later section.) Whether or not this proposal is approved, the current‑year revisions carry forward into ongoing apportionment costs in 2026‑27.
Governor Proposes COLA for Apportionments in 2026‑27. The Governor’s budget includes $241 million ongoing Proposition 98 General Fund to cover a 2.41 percent COLA for apportionments. This is the same COLA rate the Governor proposes for the Local Control Funding Formula (LCFF) for school districts.
Assessment
Covering Higher Apportionments Costs in 2025‑26 Is Reasonable. Although the state is not required to increase current‑year apportionments funding when costs come in higher than projected, providing such an increase is a reasonable way to help districts address their core operating costs. If the state does not provide an increase, then each district would see its apportionments prorated downward to fit within the previously enacted funding level. Under the administration’s apportionments cost estimates at the Governor’s budget, each district’s apportionments would be reduced by less than 1 percent. The administration typically updates its apportionments cost estimates at the May Revision to reflect more recent data from districts. Any updates would in turn affect the amount of the current‑year funding increase proposed for apportionments.
Districts Will Continue to Face Basic Cost Increases in 2026‑27. Similar to nearly all local and state entities, districts will likely face continued salary pressures in 2026‑27. In addition, district administrators report that health care premiums are continuing to grow faster than normal. Districts will see less pressure, however, from their pension costs, as the employer contribution rate is projected to remain flat at 19.1 percent of payroll for CalSTRS and decrease slightly to 26.4 percent of payroll for CalPERS (0.4 percentage points lower than in 2025‑26). Beyond these employee compensation costs, districts generally are expecting increases in other costs, such as utilities and insurance.
Providing a COLA for Apportionments Helps Districts Cover Cost Increases. Although the state is not statutorily required to provide a COLA for apportionments, it has a long‑standing practice of doing so when Proposition 98 funds are available. (In contrast, the state is statutorily required to provide a COLA for the LCFF for school districts.) The Legislature has historically made this a top CCC budget priority because it helps districts address increases in their core operating costs and, in turn, maintain the quality of their instructional programs. Because districts have broad discretion over how to spend apportionments, providing a COLA also gives districts the flexibility to address local spending priorities.
Proposed COLA Rate Could Change by May. The Governor’s proposed COLA rate is based on a federal price index that reflects the cost of goods and services purchased by state and local governments. Due to the fall 2025 federal government shutdown, some of the data typically used to estimate this rate was not available in time for the Governor’s budget this year. As a result, the proposed COLA rate is more uncertain and potentially subject to larger changes than usual. Based on updated data released in late February, we estimate the COLA rate is 2.68 percent—slightly higher than estimated under the Governor’s budget. This higher rate would cost $27 million more than the amount included in the Governor’s budget. The federal government is expected to release the last round of data used in the calculation in late April, in time to inform an updated COLA rate at the May Revision.
Recommendation
Prioritize Apportionments Proposals Within Available Funds. We recommend the Legislature treat covering current‑year apportionments costs and providing an apportionments COLA as priorities for available funds. Prioritizing apportionments helps districts address their core operating costs, while allowing them some flexibility in making their spending decisions. We recommend deciding on the COLA rate after better information is available this spring. By the May Revision, the Legislature will have finalized data on the price index typically used to calculate the COLA rate. At that time, it will also have better information on state revenues, which will in turn affect the amount of funding available for ongoing Proposition 98 augmentations.
Select Categorical Programs
In this section, we focus on CCC categorical programs. We first provide background on these programs, next describe the Governor’s proposal to provide a COLA for a subset of programs, and then raise an issue for legislative consideration.
State Funds Many CCC Categorical Programs. Whereas most CCC Proposition 98 funding is for general purpose apportionments, about 30 percent is for categorical programs designated for specific purposes. In 2025‑26, the state is providing a total of $3.8 billion ongoing Proposition 98 General Fund for nearly 50 CCC categorical programs. The largest of these programs provide funding for certain types of instruction (such as adult education or career technical education), student support, and financial aid. The remaining programs serve various purposes ranging from faculty support to information technology. Our EdBudget table, California Community Colleges Categorical Programs, lists all of these programs and their associated ongoing funding level.
Underlying Costs Tend to Grow Over Time. As with apportionments, statute does not require the state to provide a COLA for any CCC categorical program. Nonetheless, categorical programs tend to experience cost increases over time. The key cost drivers for some categorical programs are employee‑related, with costs rising as compensation increases. Some categorical programs also have enrollment‑related cost drivers, with costs rising as the number of students eligible for the program increases.
State Has Provided Increases for Select Categorical Programs. Historically, the Legislature’s COLA decisions have been driven by the availability of Proposition 98 funding and its budget priorities. As Figure 5 shows, the state has consistently provided a COLA for seven specific categorical programs in almost every year since 2019‑20. (In 2020‑21, the state did not provide a COLA for any CCC programs because it anticipated a significant budget shortfall due to the pandemic.) The state has also provided a COLA for certain other categorical programs in one or two of these years. Separate from providing a COLA, the state sometimes provides other funding increases to expand categorical programs. For example, the state increased funding for the Student Equity and Achievement Program by $24 million (5 percent) in 2021‑22 and another $25 million (5 percent) in 2022‑23.
Figure 5
Certain Categorical Programs Have Received a COLA in Recent Years
|
2019‑20 |
2020‑21 |
2021‑22 |
2022‑23 |
2023‑24 |
2024‑25 |
2025‑26 |
|
|
Academic Senate |
✓ |
||||||
|
Adult Education Program |
✓ |
✓ |
✓ |
✓ |
✓ |
✓ |
|
|
Apprenticeship programs |
✓ |
✓ |
✓ |
✓ |
✓ |
✓ |
|
|
CalWORKs student services |
✓ |
✓ |
✓ |
✓ |
✓ |
✓ |
|
|
Campus child care support |
✓ |
✓ |
✓ |
✓ |
✓ |
✓ |
|
|
Disabled Student Programs and Services |
✓ |
✓ |
✓ |
✓ |
✓ |
✓ |
|
|
Extended Opportunity Programs and Services |
✓ |
✓ |
✓ |
✓ |
✓ |
✓ |
|
|
Mandates Block Grant |
✓ |
✓ |
✓ |
✓ |
✓ |
✓ |
|
|
MESA program |
✓ |
✓ |
|||||
|
Middle College High School |
✓ |
||||||
|
NextUp foster youth program |
✓ |
||||||
|
Part‑time faculty compensation |
✓ |
||||||
|
Part‑time faculty office hours |
✓ |
||||||
|
Puente Project |
✓ |
✓ |
|||||
|
Rapid rehousing |
✓ |
||||||
|
Student basic needs centers |
✓ |
||||||
|
Student mental health services |
✓ |
||||||
|
Umoja program |
✓ |
✓ |
|||||
|
Veteran resource centers |
✓ |
||||||
|
COLA = cost‑of‑living adjustment and MESA = Mathematics, Engineering, Science Achievement. |
|||||||
Governor Proposes to Provide a COLA for Seven Categorical Programs. The Governor’s budget includes a total of $31 million ongoing Proposition 98 General Fund to provide seven CCC categorical programs with a 2.41 percent COLA. (As we explain in the “Apportionments” section, the proposed rate may change at the May Revision, after the data used to calculate the COLA is finalized.) These are the same seven programs that have received a COLA in almost every year since 2019‑20. Figure 6 lists these programs and the cost of the associated COLA. More than half of the cost is for the California Adult Education Program, which supports precollegiate instruction at both community colleges and adult schools operated by school districts.
Figure 6
Governor’s Budget Includes Increases
for Select Categorical Programs
Reflects Funding for 2.41 Percent COLA (In Millions)
|
Program |
Cost |
|
Adult Education Program |
$16.1 |
|
Extended Opportunity Programs and Services |
5.4 |
|
Disabled Student Programs and Services |
4.3 |
|
Apprenticeship programs |
2.4 |
|
CalWORKs student services |
1.4 |
|
Mandates Block Grant |
1.0 |
|
Campus child care support |
0.1 |
|
Total |
$30.6 |
|
COLA = cost‑of‑living adjustment. |
|
Proposal Is a Reasonable Starting Point, but Legislature Could Consider Other Options. Given that the Governor’s proposal includes many of the categorical programs the Legislature has prioritized for a COLA in recent years, it is a reasonable starting point for 2026‑27 budget deliberations. The Legislature could adopt the proposal, or it could choose to provide a COLA for a different set of categorical programs based on its priorities this year. However, with limited room for ongoing CCC Proposition 98 spending commitments, the Legislature will face a trade‑off between providing more funding for categorical programs and directing those funds toward other ongoing budget priorities, such as enrollment growth.
Enrollment
In this section, we provide background on how the state funds community college enrollment, discuss recent enrollment trends, describe the Governor’s enrollment growth proposals, assess those proposals, and offer an associated recommendation.
Background
State Sets Enrollment Growth Targets for CCC. The state decides how much systemwide enrollment growth to fund in a given year through the budget process. Historically, the state has considered several factors in making this decision, including changes in the adult population, the unemployment rate, recent enrollment trends, and the availability of Proposition 98 funding. To meet the state’s growth targets, districts may use various enrollment management strategies. For example, districts may expand outreach and program offerings in response to a higher target, or they may reduce course sections in response to a lower target. In last year’s budget, the state set a systemwide enrollment growth target of 0.57 percent for 2025‑26. In a departure from historical practice, the state also revised the systemwide enrollment growth target for 2024‑25 from 0.5 percent to 2.28 percent.
State Funds Enrollment Growth at a Per‑Student Rate. The state provides funding for enrollment growth at a per‑student rate that varies by enrollment type. In 2025‑26, the base rate for regular credit enrollment is $5,416 per FTE student, with districts generating additional funding on top of this rate for enrolling students who are low income or for attaining specified student outcomes. Beyond regular credit enrollment, community colleges also enroll dual enrollment students, incarcerated students, and noncredit students. In most cases, the base rate for these other enrollment types is higher ($7,595 per FTE student), as districts do not earn additional funding based on these students’ income level or outcomes.
State Has Certain Rules for Allocating Enrollment Growth Funds Across Districts. State law directs the Chancellor’s Office to allocate enrollment growth funding across districts using a formula that accounts for several local factors. These factors include the number of individuals within the district’s service area who do not have a college degree, are unemployed, or are in poverty. If a district does not fully use its enrollment growth funding, then the remaining funding is redistributed to other districts that are growing beyond their initial growth target. State law caps the total amount of enrollment growth funded at any given district at 10 percent annually. Separate from this growth funding, some districts receive funding for enrollment increases through a provision called “restoration,” as the nearby box describes.
Enrollment Restoration
State Funds Certain Enrollment Increases Through “Restoration.” When a district begins recovering from a recent enrollment decline, it first generates restoration funding. Under the restoration provision, a district may receive funding for adding back as many full‑time equivalent (FTE) students as it has lost funding for over the past three years. Based on February 2026 estimates from the Chancellor’s Office, 17 districts (most of which are located in the South Central Coast, Los Angeles/Orange County, and Bay Area regions) are receiving funding to add back a combined 15,700 FTE students in 2025‑26. The associated funding is included in these districts’ baseline apportionments costs. It is in addition to the funding the state provides for enrollment growth.
Enrollment Growth Funds Are Added on Top of Other Base Funding. Under SCFF, a district’s growth target is one component in determining its funded enrollment level. The method for calculating a district’s total funded enrollment level varies by enrollment type. For regular credit students, the state first takes a three‑year average of the district’s FTE student count in a given year and the two previous years, prior to applying any new growth. Then, the state adds the district’s growth target on top of that three‑year average. For other enrollment types, the state does not take a three‑year average and simply adds the growth target to the FTE student count in that year. In 2025‑26, the funded enrollment level across all enrollment types is estimated to be 1,076,238 FTE students systemwide.
Trends
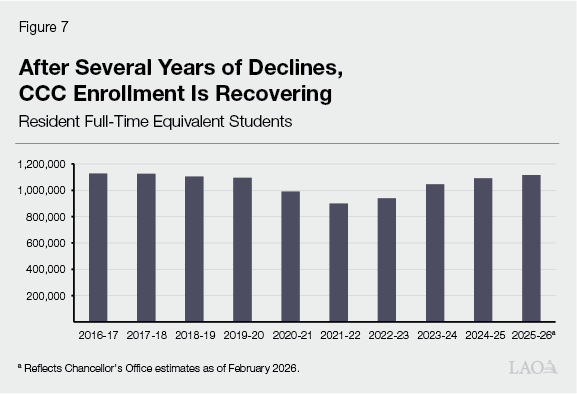
CCC Enrollment Has Recovered From Pandemic Declines. As Figure 7 shows, CCC enrollment dropped notably during the pandemic, declining by about 204,000 FTE students (18 percent) from 2018‑19 to 2021‑22. These declines likely reflect a number of factors related to the public health emergency, including the abrupt shift to online instruction and increased child care responsibilities for student parents. Enrollment has rebounded over the past four years. Based on February 2026 estimates from the Chancellor’s Office, enrollment increased by about 215,500 FTE students (24 percent) from 2021‑22 to 2025‑26. With these recent increases, just over half of districts are estimated to be back at or above their pre‑pandemic enrollment levels in 2025‑26.
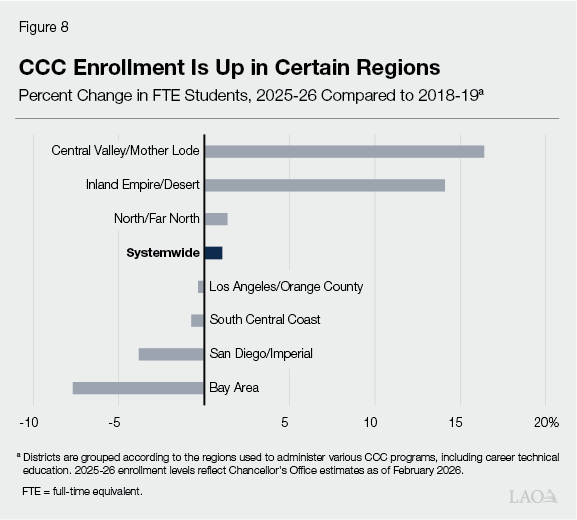
Enrollment Trends Vary Notably by Region. As Figure 8 shows, CCC enrollment in 2025‑26 is estimated to be higher than pre‑pandemic levels in three regions: the Central Valley, the Inland Empire, and the North/Far North. Estimated CCC enrollment remains below pre‑pandemic levels in other regions, with the largest decrease in the Bay Area. These enrollment trends generally align with broader demographic trends, with the regions seeing the most enrollment growth also seeing the most population increases. Within each region, enrollment trends vary among districts. In every region experiencing declining enrollment, one or more community college districts are growing despite the regional trend.
Several Factors Are Likely Contributing to Recent Enrollment Increases. In addition to regional demographic growth, several other factors are likely contributing to the recent rebound in community college enrollment. One key factor is the state’s unemployment rate, which has generally increased over the past three years, from 3.8 percent in August 2022 to 5.5 percent as of December 2025. Historically, increases in unemployment have generally been accompanied by increases in community college enrollment, with more individuals returning to school while the labor market is weak. Beyond this, districts are also pursuing a variety of growth strategies. These strategies include expanding high school partnerships, reengaging students who recently dropped out of college, and offering courses on more flexible schedules.
Mix of Enrollment Types Is Shifting. Though the overall enrollment level is recovering, the mix of enrollment has changed compared to before the pandemic. In 2025‑26, regular credit enrollment is estimated to be 30,440 FTE students (3 percent) lower than in 2018‑19, as Figure 9 shows. This decrease was more than offset by increases in other enrollment types, most notably dual enrollment for high school students. Dual enrollment at CCC has increased from 37,370 FTE students in 2018‑19 to an estimated 65,620 FTE students in 2025‑26—a 76 percent increase in just six years. During this time frame, enrollment also increased among noncredit students and incarcerated students, though at slower rates (19 percent and 4 percent, respectively).
Figure 9
Dual Enrollment Is Growing Much Faster Than Other Types of Enrollment
Full‑Time Equivalent Students
|
Enrollment Type |
Description |
2018‑19 |
2025‑26a |
Change |
|
|
Number |
Percent |
||||
|
Regular Credit |
Students generally enrolled in lower‑division academic or CTE courses. |
990,925 |
960,485 |
‑30,440 |
‑3% |
|
Noncredit |
Adult students enrolled primarily in precollegiate basic skills, ESL, or CTE courses. |
70,300 |
83,795 |
13,495 |
19 |
|
Dual Enrollment |
High school students enrolled in credit‑bearing community college courses. |
37,370 |
65,620 |
28,250 |
76 |
|
Incarcerated Students |
Students currently incarcerated enrolled in credit‑bearing community college courses. |
4,697 |
4,863 |
166 |
4 |
|
Totals |
1,103,292 |
1,114,763 |
11,471 |
1% |
|
|
aReflects reflect Chancellor’s Office estimates as of February 2026. |
|||||
|
CTE = career technical education and ESL = English as a second language. |
|||||
Half of Districts Have Grown Beyond Their Enrollment Targets. In 2025‑26, CCC is estimated to be fully using the $40 million in enrollment growth funding provided in the enacted budget to support the systemwide growth target of 0.57 percent. Moreover, of the 72 local districts, 36 districts spanning all regions of the state are on track to exceed their current‑year growth target. These districts are estimated to be exceeding their targets by a combined 27,051 FTE students. Of those students, an estimated 25,488 FTE students are within the 10 percent cap on growth funded at any given district. The Chancellor’s Office estimates it would cost the state an additional $144 million to cover enrollment costs for all students within that cap.
Proposals
Governor Proposes to Fund More Enrollment Growth in 2025‑26. The Governor’s budget provides $55 million Proposition 98 General Fund for an additional 1 percent systemwide enrollment growth in 2025‑26, increasing the current‑year growth target from 0.57 percent to 1.57 percent. This equates to an estimated 10,790 additional FTE students. The administration indicates the proposal was based on an earlier projection from the Chancellor’s Office (made before the above data became available) of how much districts were exceeding their existing growth targets in 2025‑26.
Governor’s Budget Funds Further Enrollment Growth in 2026‑27. On top of the revised current‑year enrollment level, the Governor’s budget provides $32 million ongoing Proposition 98 General Fund for further systemwide enrollment growth of 0.5 percent in 2026‑27. This equates to an estimated 5,484 FTE students in 2026‑27. The proposed budget‑year growth rate is the same rate that has been included in the Governor’s budget every year from 2020‑21 onward.
Assessment
Revising Current‑Year Enrollment Target Creates Poor Fiscal Incentive. In setting a growth target, the state signals to districts how much enrollment it has deemed it can afford. Districts can manage toward the target by adjusting the course sections they offer, among other actions. Providing additional funding when districts exceed the target creates an incentive for districts to enroll more students than the state has committed to supporting, potentially leading to cost pressures that the state might not be able to cover within available resources. Prior to the 2024‑25 Budget Act, the state typically did not increase CCC’s current‑year growth target when districts exceeded those targets. Instead, it typically expected districts that exceeded their targets to absorb the costs in the current year, then apply the additional students toward any growth targets in the budget year.
Demographic Trends Are Not Likely to Create Statewide Enrollment Pressure. In setting growth targets for the budget year, demographic trends are one key factor to consider. In 2026‑27, these trends are not likely to generate significant statewide enrollment pressure among either traditional college‑age students (age 18‑24) or working‑age students (age 25‑64). Regarding the former group, the number of public high school graduates in California recently peaked. The administration projects that high school graduates will decline by 1.4 percent in 2025‑26, which could lead to a smaller incoming class of college students in 2026‑27. Under the administration’s projections, California’s working‑age population—which accounts for about one‑third of FTE students at CCC—is also expected to decline slightly (0.6 percent) in 2026‑27.
Population Growth Could Lead to Enrollment Pressure in Certain Regions. Though demographic trends are not likely to lead to significant enrollment pressure statewide, they could lead to heightened pressure in certain parts of the state. Under the administration’s projections, the adult population (ages 18‑64) is expected to continue growing in the Central Valley, Inland Empire, and North/Far North regions in 2026‑27. This could lead to continued enrollment pressure in these regions, where enrollment growth has already been concentrated over the past several years. Under current law, the Chancellor’s Office will account for local demographic factors when allocating new enrollment growth funding among districts.
Labor Market Trends Could Continue to Generate Enrollment Pressure. Economic factors can also contribute to enrollment pressure at CCC. California’s labor market has been weak over the past few years, with the unemployment rate generally increasing over this period. Under our office’s projections, unemployment continues to increase from an estimated 5.8 percent in 2025‑26 to 6.3 percent in 2026‑27. This trend could lead more individuals to enroll in college while the labor market remains weak.
Dual Enrollment Is Creating a New Kind of Enrollment Pressure. Beyond demographic and economic factors, some of the recent enrollment pressure at CCC is due to the state’s efforts to expand college access to new populations—most notably high school dual enrollment students. This enrollment pressure is likely to continue into 2026‑27. School and community college districts have a fiscal incentive to expand a particular model of dual enrollment called College and Career Access Pathways (CCAP), as both segments can generate funding for participating students. Over the years, the Legislature has enacted several bills further facilitating the expansion of CCAP, including most recently Chapter 789 of 2024 (SB 1244, Newman) allowing community college districts to establish partnerships with school districts outside their service area. (The Governor’s budget includes $100 million one‑time Proposition 98 General Fund for school districts to expand dual enrollment partnerships. We discuss this proposal in The 2026‑27 Budget: K‑12 Proposals.)
Recommendation
Prioritize Funding Enrollment Growth Beginning in 2026‑27. Given that many districts are already exceeding their current‑year growth targets and that certain factors could generate further enrollment pressure in the budget year, we recommend the Legislature treat enrollment growth as a priority for ongoing Proposition 98 funding. Depending on the amount of ongoing funding available, the Legislature could consider supporting a higher or lower amount of growth than the Governor proposes. Regardless of the amount of growth, we recommend the Legislature begin providing the funds in 2026‑27. Revising the 2025‑26 growth target as the Governor proposes could create an incentive for districts to disregard the state’s enrollment targets in the future, potentially leading to growth beyond the level the state can support.
Calbright College
In this section, we begin by providing background on Calbright College, a statewide online college established in 2018‑19. Next, we describe Calbright’s programs and students, followed by its budget and staffing. Then, we cover the Governor’s proposal to increase Calbright’s ongoing funding level, assess that proposal, and provide associated recommendations.
Background
State Created Calbright in 2018‑19. In the 2018‑19 budget package, the state established an online community college district overseen by the systemwide Board of Governors. The district consists of one college, since named Calbright. Under statute, Calbright’s objective is to provide flexible online programs that lead to industry‑valued credentials, particularly for working adults not currently accessing higher education. Statute also directs Calbright to use competency‑based education, a model in which students progress through programs at their own pace according to how quickly they master the content. Statute expresses legislative intent that Calbright “create unique content and deliver it in a manner that is not duplicative of programs offered at other local community colleges.” As the box nearby describes, all other community colleges offer flexible online programs, but only a few are currently offering competency‑based education.
Online and Competency‑Based Education
Nearly Half of Community College Instruction Is Online. In 2024‑25, 46 percent of instruction at the California Community Colleges (CCC) occurred online. This is up significantly from the pre‑pandemic level of 17 percent in 2018‑19. At the start of the pandemic, community colleges shifted a majority of their instruction online due to public health concerns. Since then, they have continued to offer many of their courses online in order to provide flexibility for students. All local community colleges currently offer online courses. The share of instruction occurring online varies notably across colleges, ranging from less than 15 percent to more than 70 percent. Beyond offering their own courses online, most colleges are participating in the California Virtual Campus, a course exchange that helps students find and enroll in online courses offered by other colleges across the system.
A Few Community Colleges Are Piloting Competency‑Based Education. In June 2021, the Chancellor’s Office launched a pilot to develop competency‑based education programs at local community colleges. Seven colleges are currently participating in this pilot, and three have since launched their first programs. Specifically, Coastline College has launched an associate degree in management, Southwestern College has launched an associate degree in automotive technology, and Shasta College has launched a credit certificate in early childhood education. While these programs vary in design, all three are delivered fully or primarily online and allow students to progress at their own pace.
Statute Established a Seven‑Year Startup Period. Statute established various milestones for Calbright to meet during this startup period, which was scheduled to last from 2018‑19 through 2024‑25. Most notably, these milestones included enrolling students by the last quarter of 2019; designing and validating at least 16 programs by July 1, 2023; and receiving accreditation by April 1, 2025. Calbright is required to report by August 1 annually on its progress toward these milestones. In addition, statute directs the Board of Governors to submit an independent evaluation of the college by January 1, 2026, shortly after the completion of the start‑up period. The Chancellor’s Office overlooked this deadline and is currently working to get a contract in place for the evaluation to begin.
State Provided One‑Time and Ongoing Funds for Calbright. The 2018‑19 budget provided $100 million one‑time Proposition 98 General Fund for Calbright’s startup activities, as well as $20 million ongoing Proposition 98 General Fund for its operations. Trailer legislation indicated the one‑time funds were for various purposes including developing a business plan, establishing administrative processes, preparing for accreditation, and scaling efforts. The same legislation further indicated the ongoing funds were to support employee salaries and benefits, professional development, technology licensing and maintenance, and other operating expenses. In 2020‑21, in response to a projected decrease in state revenues at the start of the pandemic, the state reduced funding for Calbright. Specifically, it lowered Calbright’s ongoing funding level to $15 million, while also sweeping $40 million in unspent funds previously allocated to the college.
Statute Authorizes Calbright to Receive Funding Under SCFF. Generally, statute indicates that SCFF is to apply to Calbright in the same way it applies to all other districts (with funding linked to enrollment, low‑income student counts, and student outcomes). One key exception is that statute expresses intent to appropriate enrollment growth funding for Calbright separately from enrollment growth funding for other districts. To date, Calbright has not received apportionments, presumably because it is still spending its startup funds. The Chancellor’s Office indicates there have also been various implementation barriers to transitioning Calbright onto SCFF, including the lack of an FTE student count for Calbright based on established attendance accounting methods.
Calbright Received Accreditation in 2023. In July 2023, Calbright received accreditation from the Distance Education Accrediting Commission (DEAC), an organization that specializes in accrediting primarily online institutions. DEAC accredits 18 other institutions in California, all of which are private for‑profit or nonprofit institutions. (The other community colleges are accredited by the Accrediting Commission for Community and Junior Colleges.)
Programs and Students
Calbright Currently Offers Ten Noncredit Certificate Programs. As Figure 10 shows, these programs are primarily in the information technology (IT) and business sectors. The programs are designed to be short term. For each program, Calbright provides an estimated time to completion that generally ranges from between 8 weeks to 34 weeks, assuming ten hours per week of study. Students, however, may set their own pace, as long as they complete within a maximum of three years. Upon completion, students receive a noncredit certificate. Although statute does not limit Calbright to noncredit programs, all of the programs it currently offers are noncredit. In addition to the ten current programs, Calbright indicates it has designed and validated eight other programs that it plans to launch over the next couple of years.
Figure 10
Most of Calbright’s Programs Are in IT and Business
Noncredit Certificate Programs Designed to Date
|
Current Programs |
Planned Programs |
|
Community Health Worker |
3D Animation and Game Design |
|
Customer Relationship Management |
Entrepreneurship |
|
Data Analysis |
Generative AI |
|
Defensive Cybersecurity |
Medical Billing |
|
HR Learning and Development |
Nonprofit Management |
|
HR Talent Acquisition |
Offensive Cybersecurity I |
|
IT Support |
Offensive Cybersecurity II |
|
Medical Coding |
User Interface/User Experience |
|
Network Technology |
|
|
Project Management |
|
|
IT = information technology; HR = human resources; and AI = artificial intelligence. |
|
Enrollment Has Increased Notably Over Past Few Years. Calbright enrolled its first students in October 2019. As Figure 11 shows, Calbright got off to a somewhat slow start, but student headcount has ramped up in recent years. On June 30, 2025, Calbright enrolled 7,660 students—an increase of 67 percent over the previous year. Currently, the state does not have reliable data on the number of FTE students at Calbright. While other districts report their FTE student counts based on established attendance accounting methods used for budgetary purposes, Calbright does not submit such data. (Although the Chancellor’s Office’s DataMart platform includes estimated FTE student counts for all districts, including Calbright, those reflect only estimates. These estimates are based on a different methodology that might yield different results from established attendance accounting methods, particularly for noncredit asynchronous online programs.)
Figure 11
Calbright’s Enrollment and Completions Ramped
During Startup Period
|
2020 |
2021 |
2022 |
2023 |
2024 |
2025 |
|
|
Student headcounta |
545 |
487 |
1,076 |
2,875 |
4,582 |
7,660 |
|
Award completionsb |
33 |
43 |
109 |
248 |
639 |
1,019 |
|
aReflects students enrolled on June 30 of each year, as reported in Calbright’s annual milestone reports. bReflects data for each calendar year, based on data provided by Calbright in February 2026. |
||||||
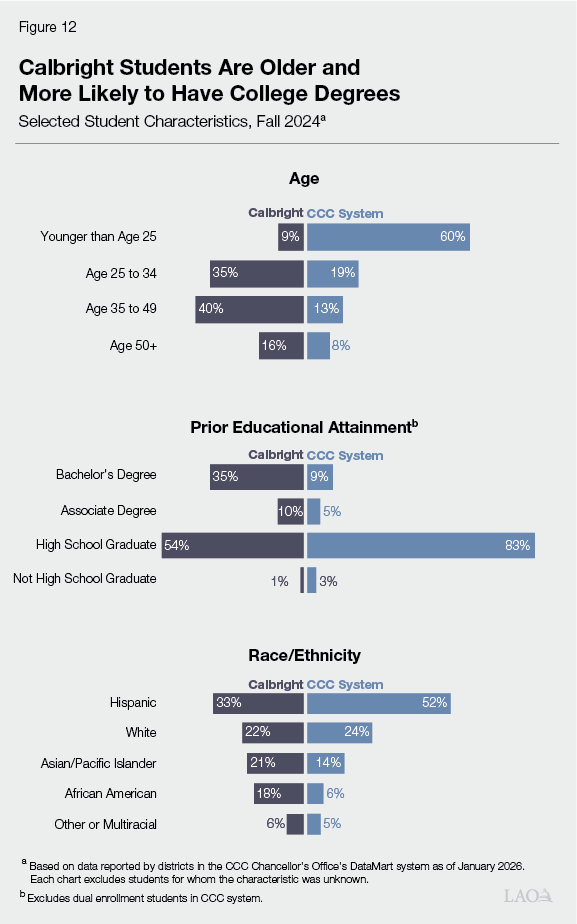
Calbright’s Student Body Differs From Broader CCC Student Body. As Figure 12 shows, there are a few notable differences. First, a much higher share of students are age 25 and older at Calbright, compared to the broader CCC system. Second, Calbright students are more likely than other CCC students to already have a college degree. In fall 2024, 35 percent of Calbright students already had a bachelor’s degree, and another 10 percent already had an associate degree. Third, the racial/ethnic distribution of students is different. Compared to the broader CCC system, Calbright has a lower share of students who are Hispanic and higher shares of students who are Asian or African American.
Small but Growing Number of Students Are Completing Programs. Figure 11 also shows the number of certificates awarded by Calbright has increased annually. In calendar year 2025, Calbright awarded 1,019 certificates—a 59 percent increase over the previous year. When reporting its completion rate, Calbright uses a DEAC measure that reflects the percentage of students who complete within 150 percent of the median completion time for their program. Using this measure, Calbright’s completion rate was 13.6 percent in 2024. Because this measure is calculated differently from the completion measures that other community colleges report, we do not have a comparable figure for the rest of the CCC system.
Calbright Collects Data on Students’ Employment Outcomes in Various Ways. Calbright recently began tracking the labor market outcomes of its completers through a partnership with CredLens, a nonprofit organization that matches student records with employment and earnings data. Based on this data, 86 percent of Calbright’s program completers in 2024 were employed 12 months after completion. (Data was not available on the share of these students who were employed before enrolling or the share of program completers at other community colleges who were employed after completion.) In addition, Calbright collects earnings data through surveys. In a recent survey of completers, respondents reported median annual earnings of about $53,400 after program exit—up from $41,600 before program entry. This survey had a response rate of approximately 20 percent, and we do not know whether respondents were representative of completers more broadly. Furthermore, the earnings data available for Calbright is not comparable to what is available for other community colleges. Although the Chancellor’s Office has a data sharing agreement with the Employment Development Department (EDD) to track earnings data for former CCC students, that data set excludes most Calbright students. Calbright indicates this is because CCC’s systemwide application for noncredit programs does not collect sufficient data to match student records with EDD wage records.
Budget and Staffing
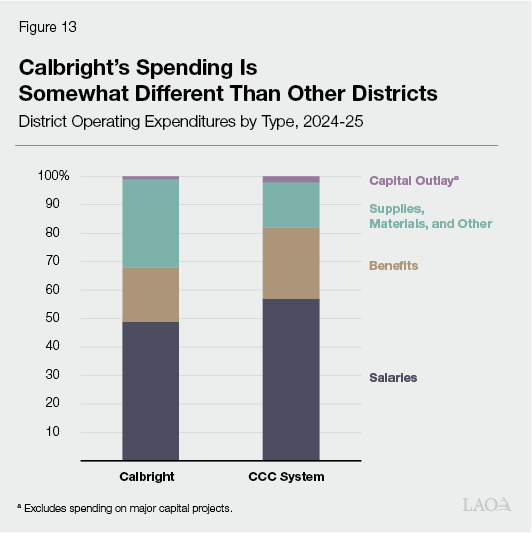
Employee Compensation Is Largest Part of Calbright’s Budget. Like other community college districts, Calbright spends a majority of its budget on employee salaries and benefits. As Figure 13 shows, however, employee salaries and benefits account for a somewhat smaller share of expenses at Calbright (a combined 68 percent) than across the broader CCC system (a combined 82 percent). Compared to the broader system, Calbright spends a larger share of its budget on supplies, materials, and other operating expenses. This category includes the technology that supports Calbright’s online model for delivering instruction and student support. State law generally requires districts to spend at least 50 percent of their unrestricted funds on instructor salaries and benefits. As of 2024‑25, Calbright is spending 29 percent of its ongoing funds on those purposes. The district has applied for an exemption from the requirement in that year on the basis of financial hardship, citing that it was unable to increase spending on instructor compensation without jeopardizing its other core functions.
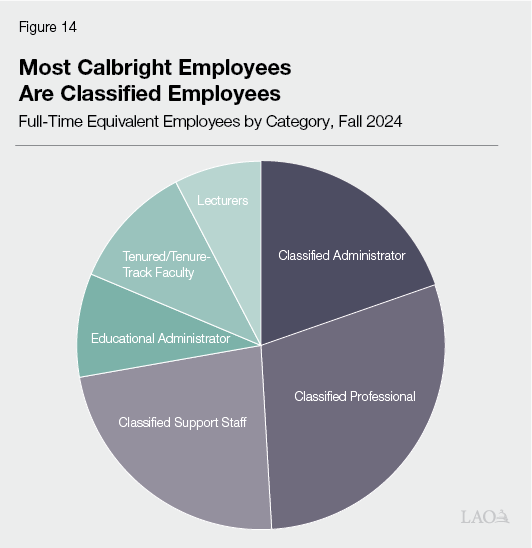
Calbright Increased Staffing Levels During Startup Period. Calbright increased its staffing levels from 51 FTE employees in fall 2020 (the first year for which this data is reported) to 171 FTE employees in fall 2024. As Figure 14 shows, about three‑quarters of Calbright’s FTE employees are classified employees, and about one‑quarter are academic employees. Calbright estimates that 53 percent of its employees are represented. The California School Employees Association represents classified employees, excluding management. The California Teachers Association currently represents Calbright’s full‑time faculty, and it recently announced that it intends to add Calbright’s part‑time faculty to the same bargaining unit.
Calbright Is Using One‑Time Funds for Employee Compensation. Over the past few years, Calbright has covered a notable share of employee compensation costs using its one‑time startup funds. In 2024‑25, these one‑time funds accounted for 44 percent of Calbright’s total spending on salaries and benefits. Calbright indicates these funds supported employees who worked on various startup activities, including developing new programs, establishing student support services, and implementing technology and data systems. Although its startup period has ended, Calbright believes the employees are needed to continue supporting these functions on an ongoing basis.
Calbright Is Taking Several Actions to Reduce Spending as One‑Time Funds Run Out. Calbright is on track to spend the remainder of its one‑time funds in 2025‑26. With these funds running out, it has taken several actions to contain or reduce costs in the current year. Most notably, it has forgone a COLA for all employee groups, furloughed management for one day per month, reduced hours for some part‑time faculty, and delayed filling some vacancies. It has also reduced spending on certain non‑personnel costs, including marketing and supplies. Combined, these actions have brought Calbright’s budgeted expenses down to $43 million in 2025‑26—$2.5 million (5.4 percent) lower than in the prior year. This spending level, however, is still nearly three times Calbright’s ongoing funding level of $15 million. At the $15 million level, Calbright indicates it would need to make significant reductions in enrollment, program offerings, and staffing in 2026‑27. Given this possibility, Calbright’s board recently authorized the college to reduce staffing by 93 FTE employees (approximately half its workforce), with most of the reduction occurring among classified staff and administrators. This action is intended to meet a statutory deadline to provide preliminary layoff notices to any potentially affected employees by March 15. Funds permitting, Calbright (like other community college districts) may rescind layoff notices after they have been issued.
Proposal
Governor Proposes Ongoing Augmentation for Calbright. The Governor’s budget proposes to increase Calbright’s ongoing funding level by $38 million, bringing it to $53 million ongoing Proposition 98 General Fund. The administration indicates the increase is to support the college’s operating costs as it transitions out of its startup period. The administration further indicates that it intends to provide an annual COLA for the college beginning in 2027‑28. There is no provisional or trailer bill language associated with this proposal.
Assessment
Calbright Has Made Progress Toward Statutory Goals. The state created Calbright to provide more flexible higher education options for working adults. During its startup period, the college generally made progress toward this objective, meeting key milestones related to enrolling students, designing and validating programs, and receiving accreditation. It also has seen substantial increases in enrollment and completions over the past few years.
Certain Questions Remain Around Calbright’s Programs, Enrollment, and Outcomes. Although statute requires that Calbright not duplicate programs at local community colleges, its offerings are similar in some ways. Some of its largest programs (including IT support and data analysis) are in subject areas commonly taught at local community colleges and often taught online. In these cases, the main factor differentiating Calbright’s programs is their competency‑based format, which remains uncommon at other colleges. Regarding Calbright’s students, the evidence is mixed as to how well the college is reaching its target population of working adults not already accessing higher education. While the college is primarily enrolling working‑age students, many of these students already have bachelor’s degrees. Furthermore, it is difficult to assess student outcomes. Although Calbright collects data on completion rates, employment, and earnings, its metrics are not comparable to those reported by other community colleges.
Questions Also Remain Around Calbright’s Cost‑Effectiveness. It is also difficult to assess the cost‑effectiveness of Calbright’s model, as we cannot determine how much the college is spending per student without a reliable FTE student count. We can, however, use systemwide data on certificates and degrees awarded to estimate how much the college is spending per award completed. In 2024‑25, we estimate that Calbright spent about $53,000 per award completed, compared to about $35,000 across other community colleges. (These amounts include spending from both ongoing and one‑time funds.) Spending per award was notably higher at Calbright, even though its awards are shorter term. This raises questions about Calbright’s cost‑effectiveness, at least at its current scale and completion rates.
Proposed Funding Level Lacks Clear Rationale. Under the Governor’s budget, Calbright’s proposed ongoing funding level is $53 million. Calbright indicates the amount is based on its estimates of the ongoing operating costs needed to maintain its core functions, including instruction, student support, research and development, and administrative activities. The proposed funding level, however, is high relative to Calbright’s recent spending. Specifically, it is 23 percent higher than Calbright’s current‑year spending level (and 16 percent higher than its prior‑year spending level, before it made any budget reductions).
Proposed Funding Approach Lacks Accountability and Incentives. Under the Governor’s proposal, the state would provide Calbright with funding that is not tied to any specific expectations, beyond the college’s original statutory objectives. Importantly, the Governor’s proposal does not link Calbright’s funding to an enrollment target. Thus, Calbright would have no incentive to maintain or increase enrollment under the proposed approach. Its funding level moving forward would remain the same (aside from any COLA) regardless of how many students it serves. Similarly, the administration’s proposal does not link funding to student outcomes, such that Calbright would have no fiscal incentive to improve these outcomes. This approach is much less transparent and provides less accountability than the state’s approach to funding other community college districts, which generate funding through SCFF. Additionally, while there was some initial justification for providing Calbright with categorical funding to account for the unique cost structure of a startup institution, the justification is less clear now that Calbright’s startup period has ended.
Recommendations
Recommend Transitioning Calbright to SCFF. Now that Calbright’s startup period has ended, we recommend beginning to fund the college through SCFF, as statute originally envisioned. Such an approach links funding with enrollment, provides a known funding rate per student, and treats Calbright consistently with other districts. While this approach would lead to a different funding level than the Governor proposes, we cannot provide a reliable estimate without better data on Calbright’s FTE student count. To give the Chancellor’s Office time to work through this attendance accounting issue and other implementation barriers, the Legislature could adopt trailer bill language specifying that Calbright shall be funded under SCFF beginning in 2027‑28. In the meantime, if the Legislature wishes to maintain Calbright’s current service level in 2026‑27, it could consider providing one‑time funding for this purpose. Sustaining Calbright’s current‑year spending level for another year would require $28 million in one‑time funding, on top of existing ongoing funding. This is somewhat less than the $38 million ongoing increase the Governor proposes.
Consider Revisiting Noncredit Funding Approach Under SCFF. Unlike funding for credit courses, funding for noncredit courses is based entirely on enrollment under SCFF. Given that all of Calbright’s programs are currently noncredit, funding Calbright through SCFF still would not create any incentives for the college to improve student outcomes. In the future, the Legislature may wish to consider revisiting this broader approach to noncredit funding. In particular, we encourage the Legislature to link a portion of noncredit funding to performance, as we discuss in Redesigning California’s Adult Education Funding Model. Doing so would improve incentives for all colleges, including Calbright, to improve student outcomes in noncredit programs.
Continue to Monitor Calbright. Though Calbright met key statutory milestones during its startup period, the Legislature likely will want to continue closely monitoring the college’s enrollment, program offerings, spending, and outcomes over the next few years. Whether the Legislature chooses to fund Calbright through SCFF or through other means, it will have an opportunity to review the college annually as part of the regular budget process. In particular, statute indicates the Legislature is to make Calbright enrollment growth decisions as part of the annual budget process. The Legislature also will be better positioned to assess the college’s cost‑effectiveness once a consistent methodology is applied to its attendance accounting. In addition, the Legislature likely will have better information on the college’s student outcomes and overall performance once the statutorily required independent evaluation of Calbright has been completed. Continued monitoring will help determine whether Calbright is providing cost‑effective service to its target population.
Healthy School Food Pathways
In this section, we first provide background on Healthy School Food Pathways (HSFP), which is a set of training programs for school food service staff. We then describe the Governor’s proposal to provide ongoing funding for HSFP, assess that proposal, and provide an associated recommendation.
Background
Apprenticeships and Pre‑Apprenticeships Are Specific Training Models. Both training models combine hands‑on learning with classroom instruction. Apprenticeship programs are designed to prepare participants to enter a specific profession. They vary in length but commonly take a few years to complete. Pre‑apprenticeship programs are designed to prepare participants to enter an apprenticeship program, and they typically take a few months to complete. In California, the Department of Industrial Relations’ Division of Apprenticeship Standards (DAS) oversees both types of programs. Based on DAS data, the state currently has about 88,700 registered apprentices and about 9,300 registered pre‑apprentices. Although the majority of apprentices and pre‑apprentices have traditionally been in the construction trades, the state has made efforts over the past decade to expand both models to other industry sectors, often called “nontraditional sectors.”
Several State Programs Support Apprenticeships and Pre‑Apprenticeships. Traditional apprenticeships are sponsored by employers and labor unions, with those sponsors covering the majority of program costs. However, the state has a longstanding CCC categorical program called RSI that reimburses apprenticeship sponsors for a portion of the costs of classroom instruction. The state currently provides $98 million ongoing Proposition 98 General Fund for this program, with sponsors partnering with districts to access the funds. Since 2015‑16, the state has also funded a CCC categorical program called the California Apprenticeship Initiative (CAI), which provides grants to support the development of apprenticeship and pre‑apprenticeship programs in nontraditional sectors. The state currently provides $30 million ongoing Proposition 98 General Fund for this program. Outside the CCC budget, the state has also funded several recent one‑time initiatives at other agencies, including DAS, to provide additional grants for apprenticeships and pre‑apprenticeships. In addition, apprenticeship and pre‑apprenticeship programs may access state and federal funding through various broader workforce development programs.
HSFP Provides Training for School Food Service Staff. In 2022, a nonprofit organization called the Chef Ann Foundation launched HSFP to train K‑12 school food service staff in “scratch cooking,” or preparing meals using fresh, unprocessed ingredients. The initiative has three main components: (1) a 7‑week pre‑apprenticeship program that introduces participants to scratch cooking, (2) a 9‑month apprenticeship program for pre‑apprenticeship completers interested in furthering their skills, and (3) a 13‑month fellowship program for experienced school food professionals interested in leadership skills. Each program involves a combination of paid hands‑on learning at a host school district, as well as online courses provided by the nonprofit and a partnering research institute. Both the pre‑apprenticeship and apprenticeship programs are approved by DAS. As Figure 15 shows, more than 1,400 California participants have enrolled in the three programs to date, with the majority enrolling in the pre‑apprenticeship program. (HSFP is also available in a few other states, but this analysis and all related budget actions are specific to California’s HSFP.)
Figure 15
Most HSFP Participants Are in Pre‑Apprenticeship Program
Number of California Participants
|
2022‑23 |
2023‑24 |
2024‑25 |
2025‑26 |
Total |
|
|
Pre‑apprenticeship program |
47 |
255 |
500 |
294a |
1,096 |
|
Apprenticeship program |
3 |
16 |
81 |
180 |
280 |
|
Fellowship program |
13 |
11 |
12 |
12 |
48 |
|
Totals |
63 |
282 |
593 |
486a |
1,424 |
|
aPre‑apprenticeship data reflects fall 2025 cohort. A second cohort is expected in spring 2026. |
|||||
|
HSFP = Healthy School Food Pathways. |
|||||
State Has Provided One‑Time Funding for HSFP. The 2022‑23 budget package provided $45 million one‑time Proposition 98 General Fund to CCC for HSFP. The Chancellor’s Office, working with a community college district as the fiscal agent, provided the funds to the Chef Ann Foundation. Provisional language specified that the funds were intended to support HSFP costs over a three‑year period. Subsequently, the 2025‑26 budget package provided an additional $10 million one‑time Proposition 98 General Fund for HSFP. Based on data provided by the administration, these appropriations are the primary funding source for HSFP. The fellowship program has also received about $1 million in other state funds, primarily through a grant from the California Workforce Development Board’s High Road Training Partnerships initiative. In addition, HSFP is receiving a small amount of reimbursements through federal workforce development programs.
School Districts Provide Training for Food Service Staff. Most school food service positions do not have specific education or training requirements for entry. Under federal law, however, school food service staff are required to complete four to six hours of training annually while employed. School districts may provide this training directly or refer their staff to online resources. Districts typically cover training costs from their school nutrition program’s operating budget, which is primarily supported by federal and state reimbursements. For school food service staff interested in higher education, CCC and other institutions offer programs in nutrition, culinary arts, and related fields. There are also a small number of pre‑apprenticeships and apprenticeships in these fields, though HSFP is the only example we are aware of that focuses specifically on school food services.
Proposal
Governor Proposes Ongoing Funding for HSFP. The Governor’s budget provides $14 million ongoing Proposition 98 General Fund for this purpose. According to the administration, the proposal is intended to support its broader efforts to improve school nutrition, particularly by helping address high vacancy and turnover rates among food service staff. The amount of the proposal is roughly based on the annual amounts provided for this purpose in previous budgets. As with those with previous amounts, the administration indicates the proposed funds would go to the Chef Ann Foundation to support expenses across the pre‑apprenticeship, apprenticeship, and fellowship programs.
Assessment
Rationale for Designating Funding for HSFP Is Weak. Although there is some evidence of high vacancy and turnover among school food service staff, it is unclear whether the root cause of those problems is insufficient training, as opposed to other factors such as low wages or part‑time hours. Moreover, if additional training is needed, the administration has not provided justification for selecting this particular set of programs. Notably, the state typically does not designate ongoing funding for specific pre‑apprenticeship and apprenticeship programs in the budget. Instead, other programs apply for funding through competitive processes (as under the CAI) or as reimbursement for services provided (as under the RSI program).
HSFP Has Unusually High State Costs. Based on data provided by the administration, $26 million in state funding for HSFP has been spent to date. As Figure 16 shows, the majority of this spending has gone toward contracted services, management, and indirect costs. Curriculum and training costs account for a small share (less than 10 percent) of the reported expenses. Across all expense types, we estimate the state cost per HSFP participant has been about $13,700 for pre‑apprentices and about $32,900 for apprentices. For comparison, state costs are much lower under CAI, which in recent rounds has provided grantees with a maximum of $2,500 per pre‑apprentice and $15,000 per apprentice. State costs are even lower in the RSI program, which under the current reimbursement rate would provide only $1,486 per apprentice for a program comparable to HSFP.
Figure 16
Bulk of HSFP Spending Is Related to
Program Administration
Proposition 98 General Fund (In Millions)a
|
Expense Type |
Amount |
|
Contracted servicesb |
$10.4 |
|
Management |
7.3 |
|
Indirect costs |
3.5 |
|
Curriculum, training, and engagement |
2.2 |
|
Participant wages and support |
2.0 |
|
Program evaluation |
0.4 |
|
Total |
$25.8 |
|
aReflects spending from the 2022‑23 Budget Act allocation for this program, as of February 2026. bIncludes marketing campaign, recruitment, technology, and other expenses. |
|
|
HSFP = Healthy School Food Pathways. |
|
HSFP Outcomes Are Mixed. Figure 17 shows the outcomes of California participants who enrolled in the HSFP pre‑apprenticeship program since fall 2022, based on data provided by the administration. Across the seven cohorts, 63 percent of those who enrolled in the seven‑week pre‑apprenticeship program went on to complete it. This is somewhat lower than the statewide completion rate across all pre‑apprenticeship programs, which has fluctuated between 64 percent and 76 percent over the past four years, based on DAS data. Only 38 percent of those who completed the HSFP pre‑apprenticeship program subsequently transitioned to the HSFP apprenticeship program. (Comparable data on transition rates is not available for other California programs.) Relative to the HSFP pre‑apprenticeship program, the HSFP apprenticeship program has a higher completion rate of 72 percent. This is somewhat higher than the statewide completion rate across all apprenticeship programs, which was 63 percent across the past five‑year period, based on DAS data. (The DAS data includes programs of longer duration, such that the completion rates are not exactly comparable.)
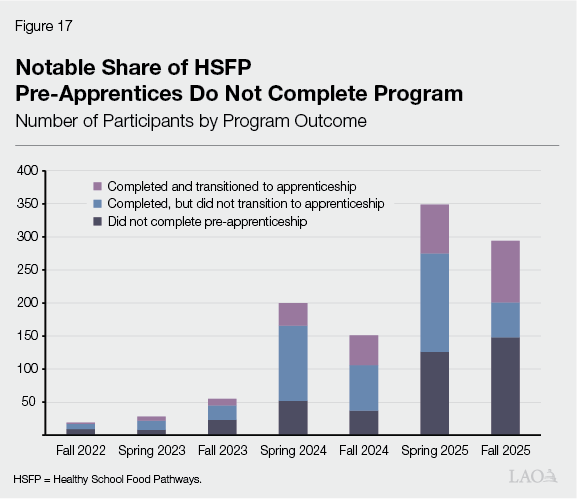
Evaluation of HSFP Is Underway. A research organization called the Food Insight Group is currently evaluating HSFP in California. In April 2025, it released an interim report based on surveys of participants and host school districts. Due to its timing, the report primarily focuses on short‑term outcomes, such as program satisfaction and self‑reported knowledge gains. Regarding workforce outcomes, 77 percent of pre‑apprentice respondents and 71 percent of apprentice respondents reported being employed in school food service at the time of the alumni survey (which for most respondents was less than one year after program completion). The administration anticipates that a more comprehensive final report will be completed at the end of 2026.
Previous Funding Remains Available. As of February 2026, a combined $27 million across the two previous allocations for HSFP remains unspent. (Of the original 2022‑23 appropriation, $1.8 million was reappropriated for other purposes in the 2025‑26 budget.) The administration indicates that an estimated $6 million will be spent this spring, leaving $21 million available for expenditure in future years. This amount could fully cover program costs in 2026‑27, making additional funding unnecessary in the budget year.
Recommendation
Reject Proposal. Given the issues above, we recommend rejecting the Governor’s proposal to provide ongoing funding for HSFP. The information currently available on HSFP raises questions about whether it is likely to be an efficient and effective way to address school food service staffing challenges. Furthermore, previous funding remains available to cover HSFP costs in the budget year.
Common Cloud Data Platform
In this section, we first provide background on the Common Cloud Data Platform, an IT project intended to facilitate the sharing of student data systemwide. We then describe the Governor’s proposal to provide a third round of funding for the project, assess that proposal, and provide an associated recommendation.
Background
Each District Maintains Its Own Student Data. Community colleges collect many types of student data, including data on enrollment and academic outcomes. Each district stores this data in its own IT platforms. The Chancellor’s Office does not have direct access to this data. Instead, it requires districts to report certain data periodically during the course of the year. It in turn uses this data for various systemwide purposes, including determining apportionment funding and complying with state reporting requirements.
Common Cloud Data Platform Is Intended to Facilitate Systemwide Data Sharing. In October 2023, the Chancellor’s Office launched a project called the “Common Cloud Data Platform.” The goal of the project is to develop a platform through which the Chancellor’s Office and participating districts could share student data on a “near real‑time” basis. By making the sharing of student data easier, the project is intended to streamline systemwide reporting processes. In addition, by providing access to data that is more timely and more complete (spanning multiple districts), the Chancellor’s Office suggests the project could improve decision‑making and student support.
Chancellor’s Office Issued First Round of Funding in 2023‑24. The Chancellor’s Office launched the Common Cloud Data Platform using $10 million Proposition 98 General Fund set aside from the Student Equity and Achievement Program. (Statute authorizes the Chancellor’s Office to designate up to 5 percent of funding for that program for systemwide activities each year.) This first round of funding is supporting a demonstration project to develop the initial infrastructure for the platform and deploy it across a subset of districts. The Chancellor’s Office began this work with an initial cohort of six districts, and it has since added a second cohort of seven more districts. These districts—which volunteered to participate in the project—vary in terms of size, region, and current IT platforms. The demonstration project is scheduled for completion by June 2026.
State Provided Second Round of Funding for Project in 2025‑26. The 2025‑26 budget provided an additional $12 million one‑time Proposition 98 General Fund for the Common Cloud Data Platform. The Chancellor’s Office plans to use these funds to deploy the initial infrastructure for the platform systemwide, as well as to continue implementing certain reporting functionalities that it is now testing with the first two cohorts of districts. It also plans to use the funds to integrate the platform with districts’ other technology tools (such as academic planning tools and learning management systems) to enable more data analytics. It intends to begin these activities in 2025‑26 and continue them through 2027‑28.
State Also Created Project‑Specific Reporting Requirements. The California Department of Technology (CDT) oversees the planning and implementation of IT projects at most state agencies. The Chancellor’s Office, however, is considered an independent agency outside of CDT’s authority. To ensure that the Common Cloud Data Platform receives adequate oversight, the state created certain reporting requirements in the 2025‑26 budget. These requirements direct the Chancellor’s Office to submit a report containing an implementation update on the platform and a plan for its further development and expansion by January 15, 2026. They further direct CDT and the Department of Finance to review that report and submit associated recommendations to the Legislature by March 31, 2026. As of this writing, the first report has been submitted, and the second report is in progress.
Proposal
Governor Proposes a Third Round of Funding in 2026‑27. The Governor’s budget provides an additional $36 million one‑time Proposition 98 General Fund, together with $5 million ongoing Proposition 98 General Fund, for the Common Cloud Data Platform. This would be the first ongoing funding for the platform. The Chancellor’s Office indicates these funds would support the completion of the project and the ongoing maintenance of the platform. The administration proposes trailer bill language codifying the project. Under this language, the project’s objectives are to “support community college student success initiatives, improve community college districts’ stewardship of resources and ability to use data‑driven decision making, and streamline community college administrative processes.” The language would also require the Chancellor’s Office to submit an interim report on the project by March 31, 2027 and a final report on January 31, 2029.
Assessment
Activities From Second Round Are Still in Early Stages. The Chancellor’s Office recently began spending the funds provided in last year’s budget for the Common Cloud Data Platform. These funds are intended to support activities through 2027‑28. At this early stage, the outcomes of the activities are uncertain. For example, the Chancellor’s Office has not yet determined whether the reporting functionalities supported by these funds are viable for systemwide deployment. According to the January 2026 report, it intends to make this determination at the end of 2026‑27, based on the results of the testing that is underway with the first two cohorts of participating districts.
Notable Uncertainty Around Whether All Districts Will Participate. In addition to technical viability, another source of uncertainty currently facing the project is district participation. This could have a large impact on the project’s benefits, as the new platform can only replace existing systemwide reporting processes if all districts participate. This would require expanding the platform from the 13 districts in the first two cohorts to all 73 districts systemwide. At this time, the Chancellor’s Office indicates seven additional districts have expressed interest in participation. Some districts, however, have expressed concerns around the workload or other operational costs associated with participating in the project.
Scope and Cost of Additional Activities Are Not Yet Known. At this stage of the project, certain key details relating to the proposed third round of funding are still being determined. Broadly, the Chancellor’s Office indicates the funding would be used for several purposes, including maintaining project infrastructure, enhancing reporting and analytics capabilities, and integrating additional technology tools. Based on the January 2026 report, the specific scope of activities will be confirmed after additional project milestones are completed. Relatedly, the cost of these activities is still being determined, with the Governor’s budget proposal based on preliminary estimates. The Chancellor’s Office indicates it will refine these estimates as the project progresses and more information becomes available on final deliverables, vendor pricing, and ongoing operational needs.
Need for Ongoing State Funding Is Unclear. Several of the project’s objectives, including streamlining administrative processes and improving districts’ stewardship of resources, are likely to lead to ongoing savings across the system. Without better information quantifying these savings, it is unclear whether any ongoing augmentation is needed for the project. Instead, districts and the Chancellor’s Office could redirect their savings toward covering all or part of the ongoing maintenance of the platform.
Recommendation
Reject Proposal at This Time and Strengthen Reporting Requirements. Given the concerns above, it would be premature to provide a third round of funding for the Common Cloud Data Platform at this time, particularly if it contains ongoing funding. The second round of funding provided in last year’s budget could support the project through 2027‑28, at which point more information will be available on the project’s outcomes to date and the additional costs of completing it. Based on that information, the Legislature could consider a future funding request for 2028‑29. To inform this decision, we recommend extending the reporting requirements from last year’s budget for two more years while the second round of funding is being spent. Under this approach, the Chancellor’s Office would submit implementation updates by January 15, 2027 and January 15, 2028, and CDT and the Department of Finance would submit their associated recommendations by March 31 of both years. Compared to the reporting requirements in the proposed trailer bill, this approach would provide the Legislature with more frequent and timely updates on the project as well as the benefits of external oversight.
Credit for Prior Learning
In this section, we provide background on credit for prior learning (CPL) at CCC, describe the Governor’s proposal to provide new ongoing and one‑time funding for this purpose, assess that proposal, and provide an associated recommendation.
Background
CPL Is Intended to Accelerate Degree Completion. CPL refers to the awarding of college credit for skills learned outside of college courses. This typically consists of skills learned through work or military experience, though it may also include skills learned in other academic settings (such as high school Advanced Placement courses). Some research has found that students who receive CPL are more likely to complete certificates or degrees and do so in less time, compared to their peers. Accordingly, CPL is often presented as a way to accelerate degree completion and reduce costs for students.
CPL Takes Various Forms. Students may earn CPL in various ways, including by passing an exam, submitting a portfolio of their work for faculty review, or demonstrating they have earned an industry credential that faculty have deemed equivalent to certain courses. Nationally, one of the most well‑established forms of CPL applies to military and veteran students. These students typically receive “joint services transcripts” from their branch of service documenting their military training and experiences. The American Council on Education, in turn, has developed recommendations that colleges may use for converting certain military training and experiences into college credit. For example, a college might award three introductory health sciences credits and two physical education credits for completing basic training.
CCC Currently Offers CPL on a Small Scale. Under systemwide regulations, all community college districts are required to have a policy for students to earn CPL. Nonetheless, the Chancellor’s Office indicates that CPL has not been implemented at scale at most colleges in the system. The Chancellor’s Office does not have reliable data, however, on the amount of CPL awarded. Colleges are currently reporting this data in two different platforms, yielding two very different data sets that are both likely incomplete. Based on one data set, colleges awarded CPL to a total of about 40,900 students, of whom 2,100 (5 percent) were military or veteran students, in 2024‑25. Based on the other data set, colleges awarded CPL to a total of about 17,500 students, of whom 8,100 (46 percent) were military or veteran students, in that same year. In both data sets, students earned on average about five to seven units through CPL—roughly the equivalent of two typical college courses.
State Provided One‑Time Funding for CPL in 2024‑25. The 2024‑25 Budget Act provided $6 million one‑time Proposition 98 General Fund for CCC to expand CPL. The Chancellor’s Office has allocated these funds toward a systemwide CPL initiative that it administers jointly with the Riverside Community College District. As Figure 18 shows, the funds are supporting a range of related activities. For example, $1.6 million is going toward faculty work groups that are developing systemwide credit recommendations for mapping certain forms of prior learning (such as specific industry certifications) to equivalent college courses. In addition, $1.3 million is going toward the development and maintenance of a technology platform to support CPL. The Chancellor’s Office is required to submit a report on the outcomes of the 2024‑25 funding by March 1, 2026. This information was not available in time for our analysis.
Figure 18
Recent CPL Funding Is Supporting Various Activities
Proposition 98 General Fund (In Millions)
|
2024‑25 |
2025‑26 |
|||
|
One Time |
Ongoing |
One Time |
||
|
Systemwide CPL Initiative |
||||
|
Staffing (15 positions) |
— |
$2.7 |
$0.3 |
|
|
Technology platform |
$1.3 |
1.2 |
— |
|
|
Faculty work groups |
1.6 |
— |
— |
|
|
Trades apprenticeship project |
1.3 |
— |
0.1 |
|
|
Professional development |
0.5 |
0.2 |
— |
|
|
Othera |
1.3 |
0.9 |
— |
|
|
Local Implementation Grants |
— |
— |
5.9 |
|
|
Unallocatedb |
— |
— |
8.7 |
|
|
Totals |
$6.0 |
$5.0 |
$15.0 |
|
|
aIncludes other special projects, operating expenses, and indirect costs. bThe Chancellor’s Office indicates it is currently reserving these funds for systemwide CPL initiative operations. If the Governor’s proposed $2 million ongoing increase for this initiative is approved, the Chancellor’s Office would instead use these reserved funds for additional local implementation grants. |
||||
|
CPL = credit for prior learning. |
||||
State Provided Second Round of Funding for CPL in 2025‑26. The 2025‑26 budget package provided an additional $15 million one‑time Proposition 98 General Fund, along with $5 million ongoing Proposition 98 General Fund, for CPL. As Figure 18 shows, the Chancellor’s Office has allocated the ongoing funds toward the systemwide CPL initiative. More than half of this funding is for about 15 staff positions based at the Riverside Community College District responsible for various activities related to CPL, including developing policies, managing technology, and providing training and support to colleges. The next largest share of the funding is for the maintenance of the technology platform. Of the one‑time funds, the Chancellor’s Office plans to distribute $5.9 million as local implementation grants, with each college receiving $50,000. Each college must commit to using these funds to (1) award CPL through joint services transcripts, (2) implement systemwide credit recommendations developed by faculty work groups, and (3) establish or strengthen local procedures to identify students eligible for CPL. The rest of the one‑time funds remain largely unallocated. The Chancellor’s Office indicates it is reserving these funds to help cover operating costs for the systemwide CPL initiative over the next few years. The Chancellor’s Office is required to submit a report on the outcomes of the 2025‑26 funding by January 31, 2028.
Proposal
Governor Proposes Third Round of Funding for CPL. On top of the amounts included in the last two budgets, the Governor’s budget provides $35 million one‑time Proposition 98 General Fund and $2 million ongoing Proposition 98 General Fund for CPL. The Chancellor’s Office indicates the proposed ongoing funds, when combined with the 2025‑26 ongoing funds, would fully cover operating costs for the systemwide CPL initiative. If the proposal is approved, the Chancellor’s Office indicates it would use the reserved 2025‑26 one‑time funds, as well as the proposed 2026‑27 one‑time funds, for additional local implementation grants. It intends to allocate these grants to colleges based on their attainment of CPL‑related outcomes. The proposed trailer bill language does not specify the allocation formula or the specific activities the grants would support.
Assessment
Proposal Might Not Address Key Barriers to Expanding CPL. Each year, hundreds of thousands of new students enter the CCC system with prior learning from many types of work experiences. Currently, the system does not have consistent rules for equating each type of experience to certain course credit. Though some faculty work groups have been established, their recommendations for translating students’ prior learning into college credit are still under development. Moreover, the extent to which colleges will in turn adopt these recommendations remains to be seen. Under the current plan, faculty at each college will make these decisions locally, very likely resulting in inconsistent implementation across colleges. Furthermore, colleges interested in implementing recommendations might not have the staff or technological capacity to do so. This could limit their ability to proactively identify students eligible for CPL or respond to student requests for CPL. It is unclear whether providing small amounts of largely one‑time funding for CPL can resolve the underlying barriers to bringing this practice to scale across the system.
Outcomes of Previous Rounds of Funding Are Not Yet Known. In the report due January 31, 2028, the Chancellor’s Office is expected to discuss the extent to which the CPL initiative is meeting its objectives—including implementing systemwide credit recommendations, designing systemwide processes to identify eligible students, and developing a systemwide technology infrastructure to facilitate the awarding of credits. This information would help the Legislature better understand how well the initiative is addressing the barriers to scaling CPL. In the meantime, the Legislature has little information on the initiative’s outcomes. It does not yet have complete and accurate data on the awarding of CPL across the CCC system. Moreover, it does not know whether CPL is having the intended policy impacts, including increasing completion rates and reducing time to degree. The Chancellor’s Office indicates it is working with districts to improve data collection around these topics. This data is also expected to be part of the 2028 report.
Existing Funding Remains Available to Support CPL. Under the Chancellor’s Office spending plan for CPL funds, the previous rounds of funding could cover the systemwide initiative’s operating costs through 2029‑30. In addition, these previous rounds are supporting local implementation grants that will be available to colleges through 2027‑28. Beyond this targeted funding for CPL, the state provides funding for broader categorical programs that colleges could use to further support CPL efforts. These include the Student Equity and Achievement Program, which provides $524 million ongoing for student support services, and the Strong Workforce Program, which provides $290 million ongoing for career technical education. Notably, Strong Workforce Program statute explicitly encourages colleges to develop workforce training that applies CPL. Given these various existing fund sources, there is not justification for additional funding for this purpose in 2026‑27.
Recommendation
Reject Proposal at This Time. Given the concerns above, we recommend rejecting the Governor’s proposal to provide additional funding for CPL. The Legislature will have better information on the outcomes of previous funding rounds after the Chancellor’s Office submits the report due by January 31, 2028. We think it would be premature to provide additional funding for this purpose before that information is available. Upon receiving the statutorily required report, the Legislature could reassess the likelihood that the initiative could be taken to scale successfully, and, if so, how much additional funding for CPL to provide. Even with no additional funding over the next few years, the system would continue to implement its CPL efforts using previous rounds of funding.