Update (3/13/17): We have updated these posts to include health insurance premium subsidies and cost-sharing reductions to insurers. In this update, we also revised some estimates of refundable tax credits to include more recent and accurate data.
LAO Contact
January 18, 2017
Federal Spending in California
Geographic Distribution of Federal Expenditures For Most Major Programs
In this post we present total and per capita federal expenditures by county for most major programs.
Total Federal Expenditures by County. In this post, estimates of total federal expenditures by county include: Social Security, Medicare, Medicaid, federal civilian wages, military wages, government contracts, veterans’ benefits, Supplementary Security Income (SSI), the refundable portion of the Earned Income Tax Credit (EITC), and Supplemental Nutrition Assistance Program (SNAP) benefits. Together, these programs represent 84 percent of total federal expenditures. (Note that these expenditures are distinct from those discussed in Post 5, which represent only the federal funding received by local governments.) The counties that receive the most federal expenditures are generally the state’s most populous. The top five recipient counties are: Los Angeles (with $81 billion in federal expenditures), San Diego ($37 billion), Orange ($21 billion), Santa Clara ($19 billion), and Sacramento ($15 billion).
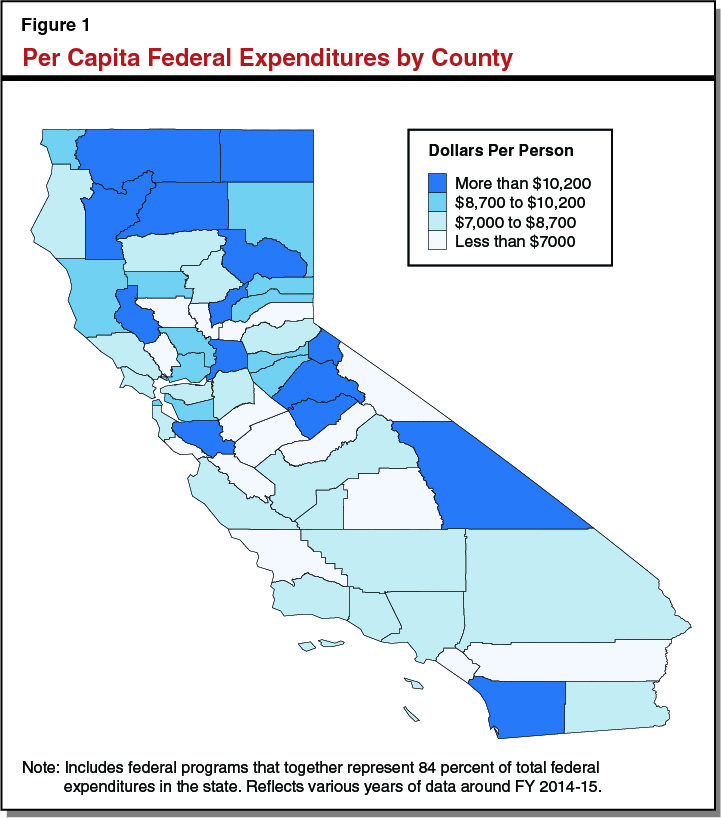
Per Capita Federal Expenditures by County. Figure 1 displays per-capita federal expenditures, by county, for major expenditures. The statewide average for this measure is around $8,700. (This per capita statewide average is lower than the one presented in Post 1 because it excludes programs for which we could not obtain county-level data.) In the figure, the two darker colors indicate counties with above-average per-capita federal expenditures and the lighter colors indicate counties with below-average amounts.

Other Counties With High Per-Person Federal Expenditures. Other counties with per-person expenditures above $10,200 have other significant drivers. Sacramento and Santa Clara both have high proportions of federal contracts per capita, particularly for procurements for the Department of Defense and Department of Veterans Affairs. Lassen has significantly more federal civilian wages per capita than average. Yuba, which has an Air Force base, and San Diego, which is home to multiple Naval bases, both have high military wages per capita. Finally, Alpine county receives high Medi-Cal expenditures per capita.
Counties with Low Per Person Federal Expenditures. Counties with the lowest per person federal spending, below $7,000 per person, include: Madera, Merced, Mono, Napa, Orange, Placer, Riverside, San Benito, San Luis Obispo, Santa Cruz, Stanislaus, Sutter, Tulare, and Yolo. These counties also generally have low per person expenditures in all, or nearly all, identified categories of spending. With no significant military presence, they mostly have low military wages per capita and fewer government contracts. These counties tend to have below average proportions of individuals aged 65 and older, with an average of 13 percent compared to the statewide average of roughly 15 percent. As a result, they also have lower per person spending in Medicare and Social Security.
