Update (3/13/17): We have updated these posts to include health insurance premium subsidies and cost-sharing reductions to insurers. In this update, we also revised some estimates of refundable tax credits to include more recent and accurate data.
LAO Contact

January 18, 2017
Federal Spending in California
How Much Money Does the Federal Government Spend in California?
In this post, we estimate total federal expenditures in California by major program.
How Federal Expenditures Reach California. As shown in Figure 1, we categorize federal funding according to the three major channels through which they reach Californians. These channels are: (1) direct payments to individuals, private entities, and universities; (2) payments to the state government; and (3) payments to local governments. Private entities include businesses, healthcare intermediaries, and nonprofit organizations.
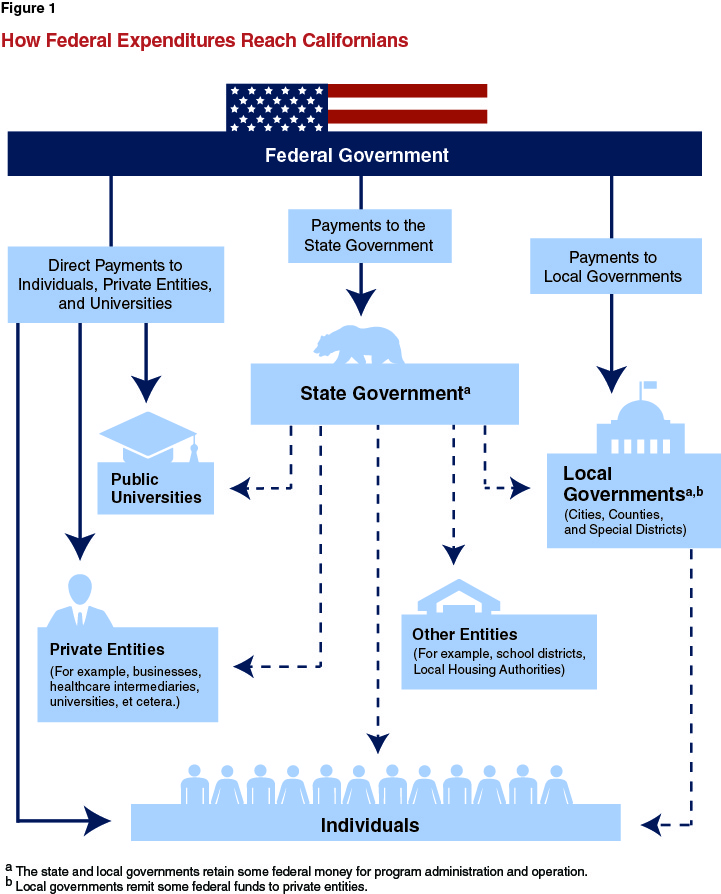
Intermediate Payments Attributed to Their First Recipient. As displayed in the figure, we categorize federal payments by their first recipient, not their ultimate beneficiary. This method is consistent throughout the blog series except in Post 5, where we discuss all federal expenditures received by counties. Federal Medicaid funding for child welfare services, for example, is distributed from the federal government, to the state, and then to counties for the provision of services. Similarly, most federal funding for the Supplemental Nutrition Assistance Program (SNAP) flows from the state to grocers (which we define as private entities). The state also distributes most federal funds for education to school districts and local education agencies. However, despite these ultimate beneficiaries, we categorize all federal payments that are first distributed to the state as “payments to the state government.” We take a similar approach for payments to local governments.
Federal Spending in California. Figure 2 shows federal spending in California by recipient, and then by program. (This list excludes some small programs. Please see the methodology post for more information). In general, the figure displays funding amounts paid during or around state fiscal year 2014-15 (in some cases the most recent data available are from an earlier time period). Some amounts are published on different bases that do not align with the state fiscal year (July 1st to June 30th). For example, the refundable portion of the EITC is estimated on a tax year basis (which runs from January 1st to December 31st) and defense contracts on a federal fiscal year basis (October 1st to September 30th) .
The figure shows total annual federal expenditures in California are around $376 billion. (As we note in the methodology post, the estimates in this figure are subject to some uncertainty and exclude some small federal spending amounts.) With an estimated population of 38.9 million in early 2015, this corresponds to federal payments of about $9,700 per person in the state of California.
Figure 2
Federal Spending on Major Programs in Californiaa
(In Billions)
|
Amount |
Year |
|
|
Direct Payments to Individuals, Private Entities, and Universities |
||
|
Income-Support and Retirement Benefits |
||
|
Social Security |
$82.6 |
2015 |
|
Medicare |
69.2 |
2015 |
|
Supplemental Nutrition Assistance Program (SNAP) - benefits |
7.6 |
FY 2014-15 |
|
Supplemental Security Income (SSI) |
7.2 |
FY 2014-15 |
|
Earned Income Tax Credit (EITC) (refundable portion) |
6.4 |
2014 |
|
Housing choice vouchers (Section 8) |
3.0 |
FFY 2014-15 |
|
Child Tax Credit (refundable portion) |
3.6 |
2014 |
|
Tax credits to low-income individuals for health insurance premiums |
2.1 |
2014 |
|
Cost-sharing reductions to insurers for healthcare expenses |
.7 |
2015 |
|
Railroad retirement and disability benefits |
0.6 |
2015 |
|
Payments to Private Entities and Universities |
||
|
Defense contracts (excludes universities) |
$33.8 |
FFY 2013-14 |
|
Non-defense contracts (excludes universities) |
10.7 |
FFY 2013-14 |
|
Research contracts and grants to public universities |
3.0 |
FFY 2012-13 |
|
Research contracts and grants to private universities |
1.8 |
FFY 2012-13 |
|
Wages, Salaries, and Benefits for Current and Former Federal Employees |
||
|
Federal civilian wages and salaries |
$19.4 |
2015 |
|
Veterans benefits (except education) |
12.8 |
FFY 2014-15 |
|
Military wages and salaries |
10.3 |
2015 |
|
Federal employee retirement |
5.7 |
FFY 2010 |
|
Financial Aid to Students |
||
|
Pell grants |
$4.0 |
FFY 2014-15 |
|
Education and vocational training for veterans |
1.8 |
FFY 2014-15 |
|
Refundable tax credits for tuition |
1.0 |
2014 |
|
Other major grants and funding for students |
0.3 |
FFY 2013-14 |
|
Education-Related Payments |
||
|
Head Start |
$1.0 |
FY 2014-15 |
|
Telecommunications and associated infrastructure for schools and libraries |
0.3 |
2014 |
|
Payments to State Government |
||
|
Health and Human Services |
||
|
Medicaid |
$54.7 |
FY 2014-15 |
|
Child welfare services |
2.1 |
FY 2014-15 |
|
Women, Infants, and Children (WIC) |
1.2 |
FY 2014-15 |
|
SNAP - administration |
1.1 |
FY 2014-15 |
|
Other major health and human services programs |
1.2 |
FY 2014-15 |
|
Education and Workforce |
||
|
Child nutrition |
$2.4 |
FY 2014-15 |
|
Supplemental services for low-income students |
1.8 |
FY 2014-15 |
|
Special education |
1.2 |
FY 2014-15 |
|
Workforce education and training |
0.7 |
FY 2014-15 |
|
Other major education programs |
1.5 |
FY 2014-15 |
|
Income Security |
||
|
Temporary Assistance to Needy Families (TANF) |
$3.7 |
FFY 2014-15 |
|
Unemployment Insurance - administration |
0.6 |
FY 2014-15 |
|
Transportation |
$5.1 |
FY 2014-15 |
|
Natural Resources and Environmental Protection |
$0.5 |
FY 2014-15 |
|
Other |
$1.1 |
FY 2014-15 |
|
Payments to Local Governments |
||
|
Direct payments to cities, counties, and special districts |
$8.2 |
FY 2014-15 |
|
Total |
$375.8 |
|
|
aThis table includes the refundable portions of several tax credits. As a result, readers should be cautious about using these figures to develop a comparison to federal taxes paid by the state. FFY = federal fiscal year and FY = fiscal year (California). |
||
Most Federal Spending in California for Direct Payments. Most federal payments to California are paid directly to individuals, private entities, and universities—representing about 77 percent of the total. The state government receives 21 percent of total payments, which it primarily distributes to individuals, private entities, school districts, and local governments (and keeps a small portion for state operations). Local governments directly receive the remaining 2 percent of federal expenditures. (Figure 2 displays only federal funds received directly by local governments. Including funds passed through the state government, local governments received over $18 billion in federal funds in 2014-15.)