With a state as big, as populous, and as complex as California, it would be impossible to quickly summarize how its economy or state budget works. The purpose of Cal Facts is more modest. By providing various "snapshot" pieces of information, we hope to provide the reader with a broad overview of public finance and program trends in the state.
Cal Facts consists of a series of charts and tables which address questions frequently asked of our office. We hope the reader will find it to be a handy and helpful document.
—Mac Taylor, Legislative Analyst

December 5, 2016

CAL FACTS Health and Human Services
What Are the Major Health and Human Services Programs?
2016-17 (In Billions)
|
Program |
Funding |
|
TF (GF) |
|
|
Medi-Cal. Provides health care services to low-income Californians. |
$84.0 ($17.8)a, b |
|
SSI/SSP. Cash assistance for low-income seniors and persons with disabilities (SPDs). |
10.0 (2.9)a |
|
IHSS. In-home personal care services for low-income SPDs. |
9.8 (3.5)a, c |
|
CalFresh. Food assistance for low-income individuals and families. |
8.9 (0.8)a |
|
Developmental Services. Services for individuals with developmental disabilities. |
6.7 (4.0)c |
|
Child Welfare. Services for children who have experienced abuse or neglect. |
6.0 (0.4) |
|
CalWORKs. Cash assistance and welfare-to-work services for very low-income families. |
5.4 (0.7)a |
|
State Hospitals. Mental health services at state-run hospitals and prisons. |
1.7 (1.7) |
|
WIC. Nutrition services for pregnant women, new mothers, and young children. |
1.3 (—) |
|
aLocal assistance only. bTotal funds amount is approximate and amounts exclude Medi-Cal spending for IHSS and developmental services. cIncludes cost of Medi-Cal benefits. TF = total funds; GF = General Fund; IHSS = In-Home Supportive Services; and WIC = Special Supplemental Nutrition Program for Women, Infants, and Children. |
|
How Many People Are Served in Major Health and Human Services Programs?
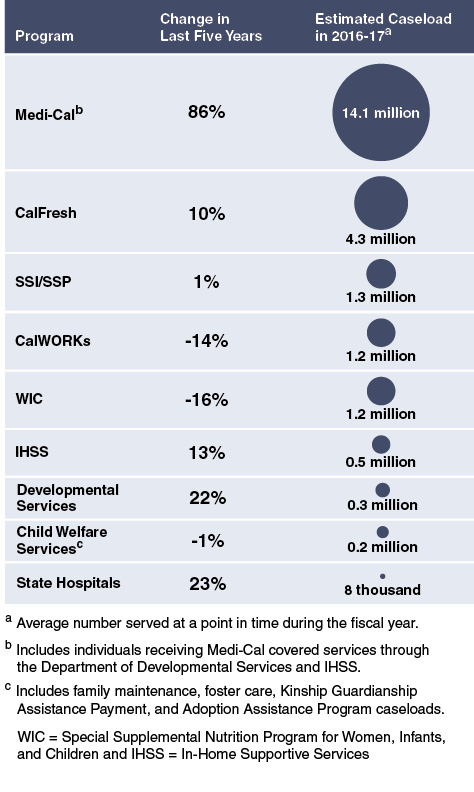
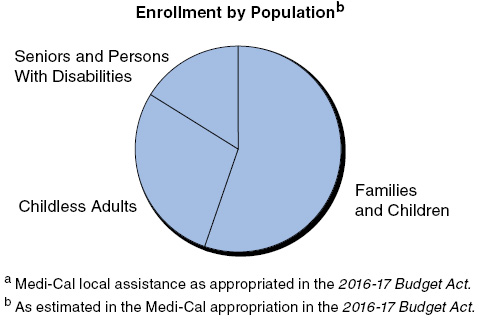
Medi-Cal at a Glance
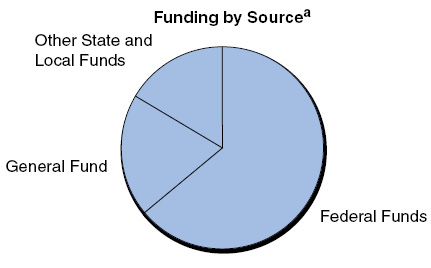
- The Medi-Cal program provides health coverage to approximately 14 million low-income Californians, and is by far the largest health program in the state budget ($17.8 billion General Fund in 2016-17).
Significant Growth in Medi-Cal Enrollment
(In Millions)
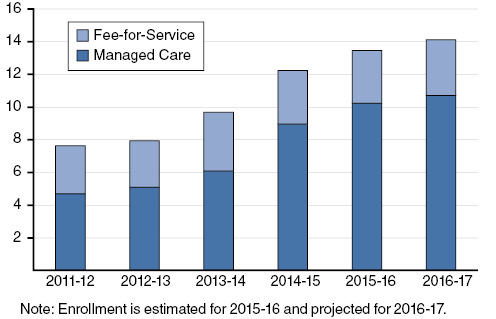
- Medi-Cal has grown from 8 million enrollees in 2011-12 to 14 million in 2016-17. Growth in Medi-Cal can be attributed to many factors, including (1) implementation of the Patient Protection and Affordable Care Act, and (2) the transition of the Healthy Families population into Medi-Cal.
- Nearly 3.5 million childless adults are estimated to have gained eligibility for Medi-Cal through California's optional Medicaid expansion, which extended eligibility to childless adults with incomes up to 138 percent of the federal poverty level.
- In 2011-12, approximately 60 percent of Medi-Cal enrollees were enrolled in managed care. Since 2011-12, the state transitioned seniors and persons with disabilities into managed care and expanded managed care to California’s rural counties. As a result, in 2016-17, over 75 percent of Medi-Cal enrollees are estimated to be enrolled in managed care.
Significant Decrease in Uninsured Population Between 2013 and 2015
Percent Change in Enrollment, Californians Aged 0-64
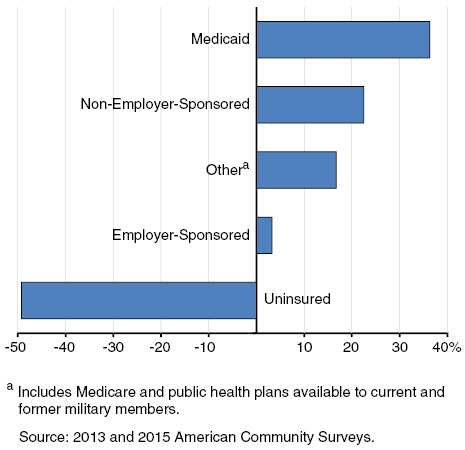
- Between 2013 and 2015, over 3 million Californians gained health coverage, reducing the number of uninsured adults under the age of 65 to approximately 3 million people. This reduction is driven in part by the expansion of Medi-Cal and by individuals obtaining subsidized health coverage through the state’s Health Benefit Exchange, Covered California.
Undocumented Persons Projected To Be Majority of State's Remaining Uninsured Population in 2017
Californians Aged 0–64
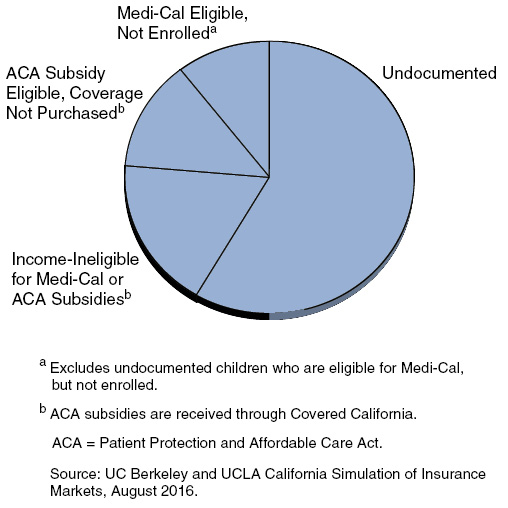
- In 2017, 1.8 million (58 percent) of the remaining 3.1 million uninsured statewide under age 65 are projected to be undocumented individuals.
- Most of the remaining uninsured, undocumented population are adults because undocumented children under the age of 19 became eligible for full-scope Medi-Cal in 2016. The administration estimates 250,000 undocumented children are eligible, out of whom 137,000 are enrolled as of August 2016.
Health of California’s Population Compared to the Nation
2014, Unless Otherwise Specified
|
California |
Nation |
|
|
Overall Health Status |
||
|
Percent of adults aged 18 years and older reporting fair or poor health status |
17.0 |
12.6 |
|
Mortality |
||
|
Deaths per 100,000 population |
633.8 |
823.7 |
|
Top two leading causes of death: |
Cancer |
Heart Disease |
|
Heart Disease |
Cancer |
|
|
Adult Health Risk Factors |
||
|
Percent of adults aged 18 or older who smoke |
11.7 |
17.0 |
|
Percent of adults aged 20 or older who are obese |
27.5 |
37.9a |
|
Percent of adults ever diagnosed with diabetes |
8.9 |
9.1 |
|
Infant, Child, and Adolescent Health |
||
|
Percent of low-weight births |
6.7 |
8.0 |
|
Infant deaths per 1,000 births |
4.3 |
5.8 |
|
Percent of children ages 19-35 months who did not complete a set of recommended childhood vaccinations |
22.1 |
28.4 |
|
Percent of obese adolescent students |
14.6b |
20.6b |
|
In the figure above, lower values are better. On all indicators except self-reported overall health status, California is doing better or about the same as the nation as a whole. |
||
|
aData from 2013-14. bCalifornia data is from 2015 covering ages 12-17. Federal data is from 2013-14 covering ages 12-19. |
||
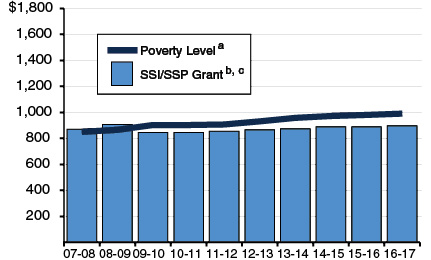
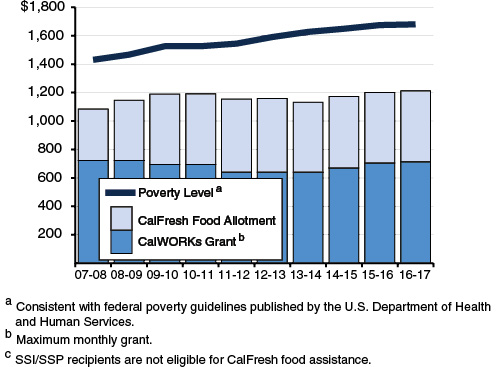
SSI/SSP Grant and Combined CalWORKs/CalFresh Assistance Remain Below Poverty Level
SSI/SSP Grant for Individuals Residing in Own Household
CalWORKs Grant and CalFresh Allotment for a Family of Three
Increases in IHSS Cost Per Consumer Accelerating
Average Cost Per Consumer (In Thousands)
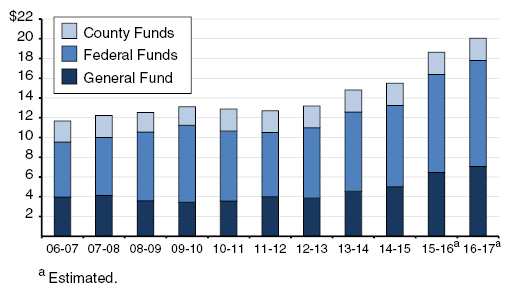
- Over the past decade, the average annual cost of providing personal care services to In-Home Supportive Services (IHSS) recipients has grown by 76 percent, from $11,387 per consumer in 2006-07 to an estimated $20,066 per consumer in 2016-17.
- The IHSS cost per consumer grew annually by an average of 5 percent between 2006-07 and 2009-10, slowing to an average of 3 percent per year through 2014-15. Since then, IHSS cost per consumer has grown significantly at an estimated average of 15 percent per year.
- The increased IHSS cost per consumer estimated for 2015-16 and 2016-17 is due, in part, to the implementation of new federal overtime regulations, rising wages, and increased hours per consumer.
State Aims to Reduce Reliance on Costly Group Home Foster Care Placements
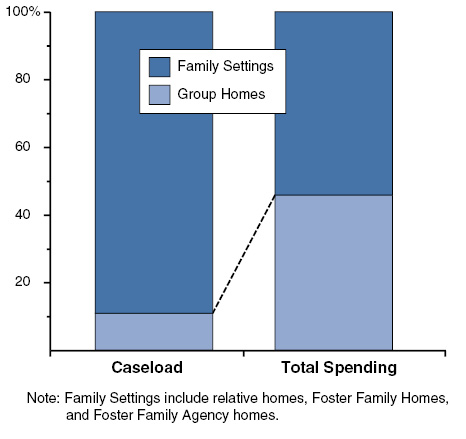
- While foster children living in family settings outnumber foster children living in group homes by approximately 9 to 1, total spending (all funds) is split roughly equally between the two groups. State policy gives preference to placement in home-based family settings.
- Recent legislative changes known as the Continuum of Care Reform aim to reduce the number of children living in group homes by increasing capacity in home-based family placements, reducing lengths of stays in group home settings, and improving access to mental health and other supportive services.
Community Developmental Services Spending Up Significantly
Percent Change Since 2006-07
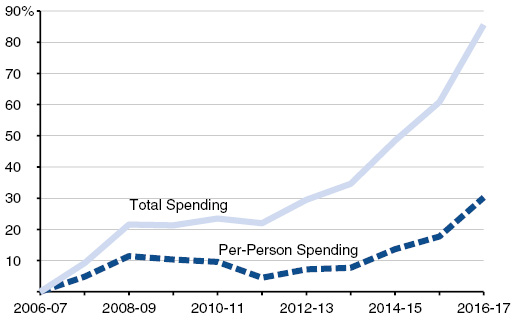
- California provides community-based services to over 300,000 developmentally disabled individuals through 21 nonprofit corporations known as regional centers (RCs). Between 2006-07 and 2016-17, total spending is estimated to grow by 86 percent, while average per-person spending is estimated to go up about 30 percent.
- The underlying reasons for the cost growth in the community services system are not fully understood. In addition to caseload growth, these reasons could include factors such as (1) an aging RC population, (2) individuals moving out of state developmental centers to the community who require more intensive services and supports relative to the average consumer, and (3) comparatively higher costs of treating the growing autistic population.