With a state as big, as populous, and as complex as California, it would be impossible to quickly summarize how its economy or state budget works. The purpose of Cal Facts is more modest. By providing various "snapshot" pieces of information, we hope to provide the reader with a broad overview of public finance and program trends in the state.
Cal Facts consists of a series of charts and tables which address questions frequently asked of our office. We hope the reader will find it to be a handy and helpful document.
—Mac Taylor, Legislative Analyst

December 5, 2016

CAL FACTS Education
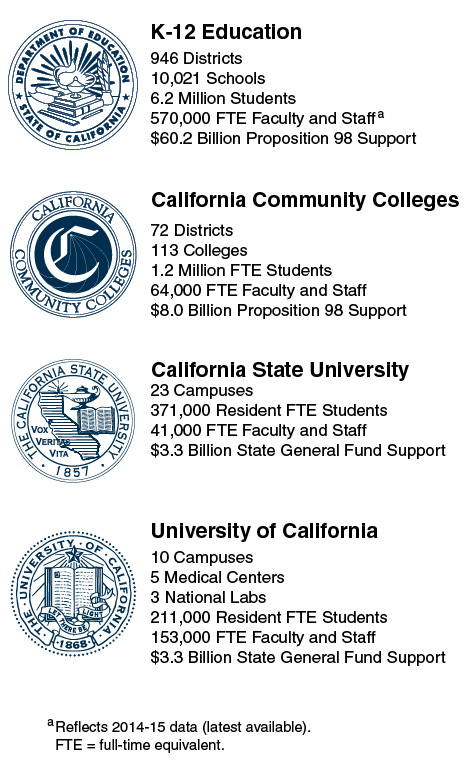
California's Public Education System Is Extensive
2015-16
State Is Primary Source of Revenue for K-12 Education
2015-16
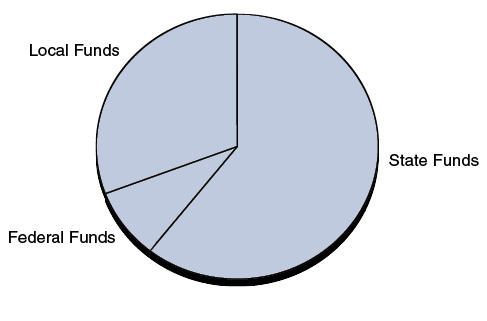
- Slightly more than 60 percent of school funding comes from the state. The California Lottery accounts for less than 2 percent of all school funding.
- About 30 percent of school funding comes from local sources—primarily property taxes.
- Slightly less than 10 percent of school funding comes from the federal government. This funding supports specific activities—primarily special services for low-income students and students with disabilities.
Most K-12 Spending Is for Instruction
2014-15
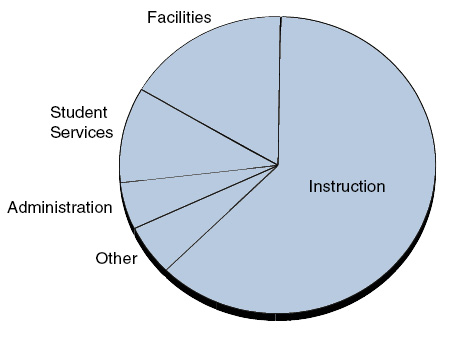
- More than 60 percent of school spending is for classroom instruction and instructional support, including teacher salaries and benefits.
- Almost 20 percent of school spending is for facilities, including the construction and renovation of school buildings and ongoing maintenance.
- About 10 percent of school spending is for student services, including school meals, home-to-school transportation, and counseling.
- Less than 10 percent of school spending is for administration, including the compensation of district superintendents, and other activities related to accounting, legal, and human resource services.
Inflation-Adjusted Proposition 98 School Funding Near All-Time High
Funding Per Studenta
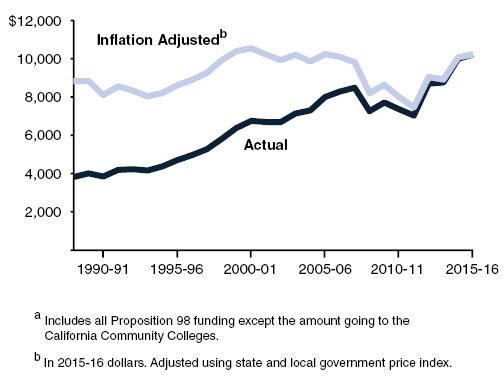
- School funding tends to fluctuate based on the condition of the state budget and the economic cycle.
- Corresponding with the most recent economic and fiscal cycle, school funding dropped notably during the 2008-09 through 2011-12 period and increased notably during the 2012-13 through 2015-16 period.
- Proposition 98 funding in 2015-16 was $10,217 per student—about $1,400 (16 percent) above the inflation-adjusted 1988-89 level.
Most K-12 Funding Provided Through Student-Based Formula
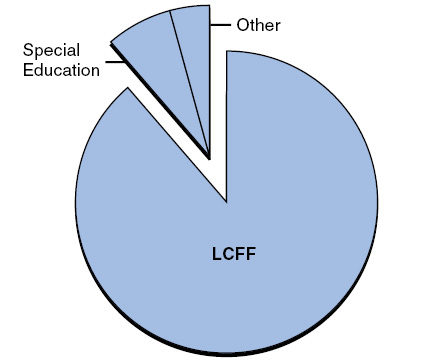
- The 2016-17 budget provided $63 billion for schools from a combination of state General Fund and local property tax revenues. The state provides the vast majority of funding—$56 billion—through the Local Control Funding Formula (LCFF).
- Under the LCFF, each student generates a base funding amount. The base rate varies by grade span, with higher grades generally funded at higher rates. The LCFF provides additional funding for low-income students, English learners, and foster youth.
- The state has set LCFF target funding rates and is working towards those targets. In 2016-17, the state was funding 96 percent of the target rates.
LCFF Provides Additional Funding For Certain Students
K-12 Students by Type
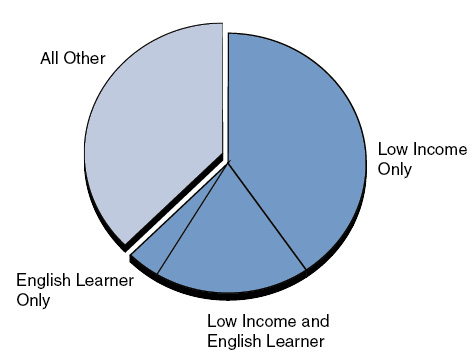
- More than 60 percent of K-12 students are low income, English learners, or foster youth (which are counted as low income).
- Under the Local Control Funding Formula (LCFF), these students generate supplemental funding equivalent to 20 percent of the base rate.
- If these students comprise more than 55 percent of a district’s enrollment, the district also receives concentration funding equal to 50 percent of the base rate for each student above the threshold.
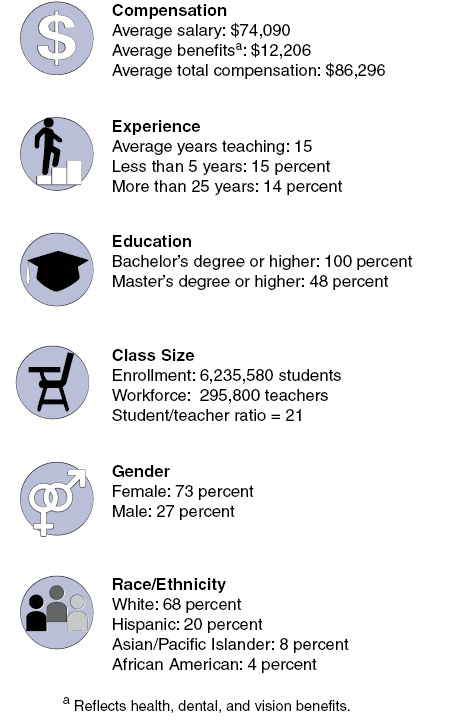
California Has Almost 300,000 Public School Teachers
2014-15
K-12 Enrollment Trends Vary Greatly Across State
Projected Change, 2015-16 to 2024-25
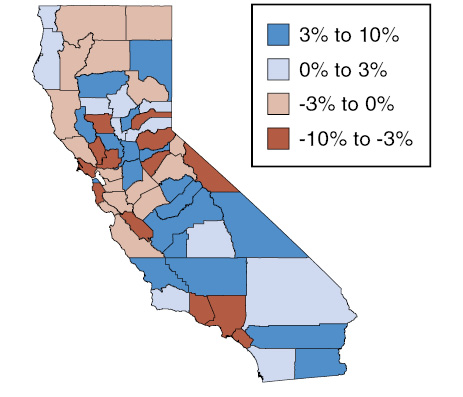
- Statewide K-12 enrollment is projected to decline by 1 percent from 2015-16 to 2024-25. Enrollment is projected to increase in half of the state’s counties and decrease in the other counties.
- Riverside and Kern Counties are projected to experience the greatest enrollment increases, with gains over the period of 5 percent (23,000 students) and 10 percent (18,000 students), respectively.
- Los Angeles and Orange Counties are projected to experience the greatest enrollment decreases, with declines over the period of 6 percent (89,000 students) and 8 percent (41,000 students) respectively.
Schools Provide Some Students With Special Education Services
Percentage of California Children, 2015-16
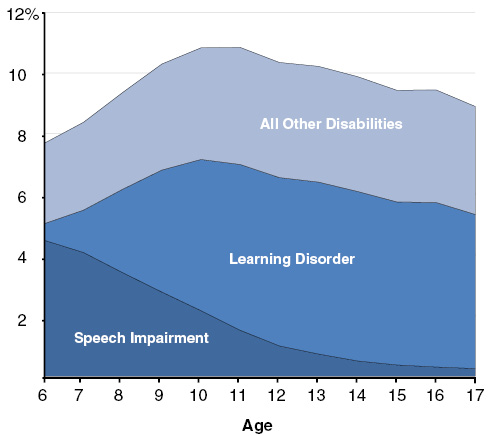
- Roughly 10 percent of school-aged children in California have disabilities affecting their education.
- Young students are most likely to have speech impairments, whereas older students are most likely to have learning disorders such as dyslexia.
- For students with disabilities, schools must develop individual education plans that set forth the extra support (such as language therapy) to be provided.
- About half of students with disabilities spend most of their day in mainstream classrooms, whereas the other half are in classrooms with only other special education students.
California Has Many English Learners
Second Language Students by Classification
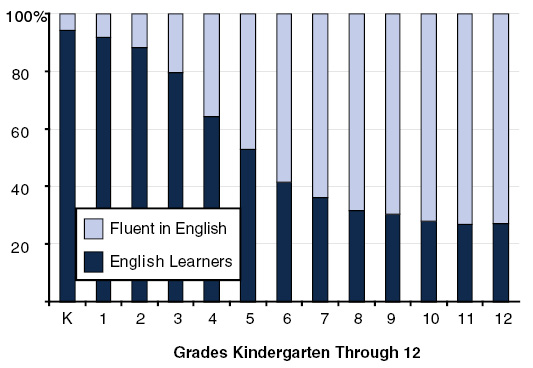
- About 40 percent of California students—almost 2.7 million students overall—speak a primary language other than English at home. The vast majority of these students (78 percent) speak Spanish.
- About half of these students (1.4 million) are classified as English learners whereas half are considered fluent in English.
- As reflected in the graph, students are much more likely to be classified as English learners in the early grades.
- Almost one-third of all English learners in the nation live in California.
Updated on 2/10/17
Student Achievement Gap Is Notable
2014-15
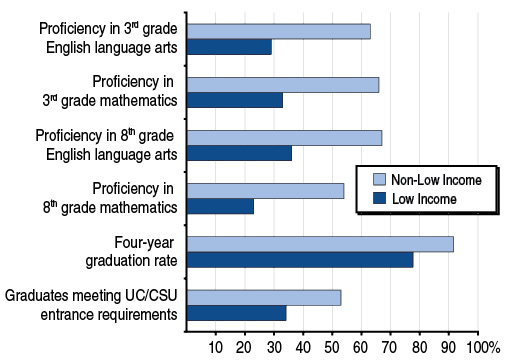
- California’s low-income students perform significantly below non-low-income students in English language arts and math.
- Low-income students also are less likely to graduate within four years and complete the minimum coursework necessary to be accepted into universities.
- Student outcomes also vary by race/ethnicity. For example, among low-income students, four-year graduation rates are 69 percent for African Americans, 77 percent for Hispanic/Latinos, 78 percent for Whites, and 89 percent for Asians.
State Subsidizes Child Care and Preschool
2016-17 (Dollars in Millions)
|
Program |
Funding |
Slots |
|
CalWORKs Child Care |
$1,146 |
128,848 |
|
Non-CalWORKs Child Care |
620 |
62,519 |
|
State Preschool |
1,074 |
163,603 |
|
Transitional Kindergarten |
719 |
85,500 |
|
Totals |
$3,559 |
440,470 |
- To be eligible for state-subsidized child care, families must be low income and working. Currently, a family of three making up to roughly $42,000 per year is eligible.
- Only families participating in California Work Opportunity and Responsibility to Kids, or CalWORKs, are guaranteed child care. All other eligible families are prioritized based on income.
- Neither State Preschool nor Transitional Kindergarten require families to be working. State Preschool is for children from low-income families whereas Transitional Kindergarten serves all children turning five between September and December regardless of family income.
- CalWORKs child care funding, which depends on the number of families participating in welfare-to-work, is $296 million (21 percent) lower in 2016-17 than 2007-08. By comparison, funding for non-CalWORKs child care and State Preschool, which tends to increase when the state budget is strong, is $121 million (7 percent) higher today than 2007-08.
California Has Large Public Higher Education Sector
Full-Time Equivalent Enrollment, 2014-15
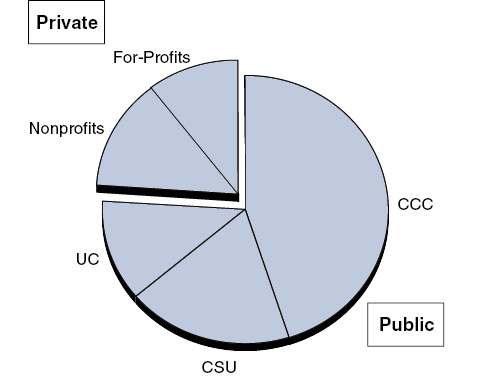
- Seventy six percent of higher education instruction in the state occurs at public colleges and universities. This share is higher than the rest of the nation (66 percent).
- California’s share of students in nonprofit colleges is lower than the rest of the nation, whereas its share in for-profit colleges is similar.
- Within California’s public sector, community colleges account for more than half of enrollment. For the rest of the nation, community colleges account for a quarter of public sector enrollment.
State Covers Large Share of Education Cost
Average Per-Student Education and Student Services Spending, 2016-17
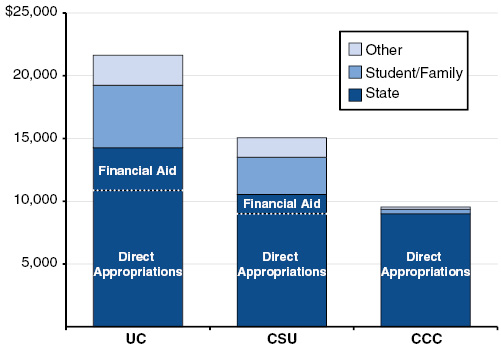
- State support (consisting of direct appropriations to the segments as well as state-funded student financial aid) on average accounts for 65 percent, 70 percent, and 95 percent of the educational cost at the University of California, the California State University, and the California Community Colleges, respectively.
- The student and family share of these costs on average is slightly over 20 percent at the universities and 4 percent at the community colleges. The average masks significant differences, with the share for a particular student and family depending on the amount of financial aid they receive.
- Other sources of support include nonresident supplemental tuition, endowment income, federal contract and grant overhead, and patent royalties.
Tuition Has Leveled Off Following Steep Increases
Systemwide Tuition and Fees for Full-Time Undergraduate California Residents
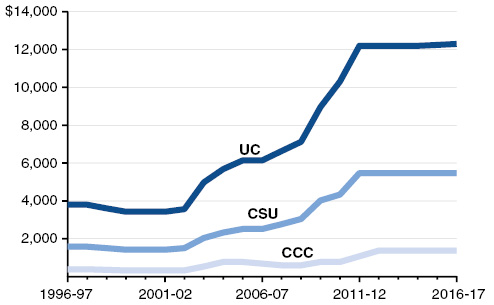
- Changes in tuition and fees have been irregular, with periods of flat or even falling tuition alternating with periods of steep increases.
- Compared with 20 years ago, tuition levels at each segment have more than tripled in actual dollars and almost doubled in inflation-adjusted dollars.
- Currently, tuition at the California Community Colleges is lowest in the nation. At the California State University, tuition is in the lowest one-sixth of public masters-level universities, whereas tuition at the University of California is in the highest one-sixth of large public research universities.
- About half of California students currently enrolled in the public sector receive grants or waivers that fully cover systemwide tuition and fees.
State Financial Aid Spending Continues to Grow
(Dollars Awarded in Billions)
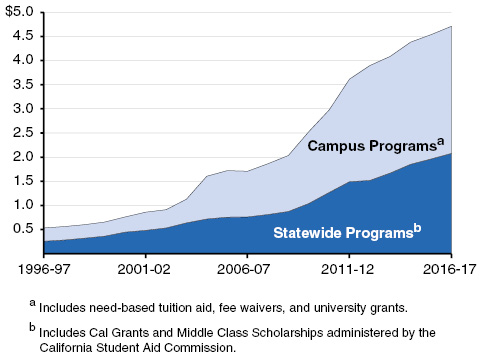
- Over the last 20 years, total state aid has increased nearly nine-fold in actual dollars and five-fold in inflation-adjusted dollars.
- Growth in state financial aid spending has been related to increases in tuition at the public segments (which increase the costs of Cal Grants and fee waivers), increases in the number of students receiving aid, and state policy changes.
- In addition to state and campus aid, many students receive federal financial aid, including Pell Grants and federal tax deductions and credits.
Graduation Rates Gradually Increasing at UC and CSU
Entering First-Time, Full-Time Freshmen
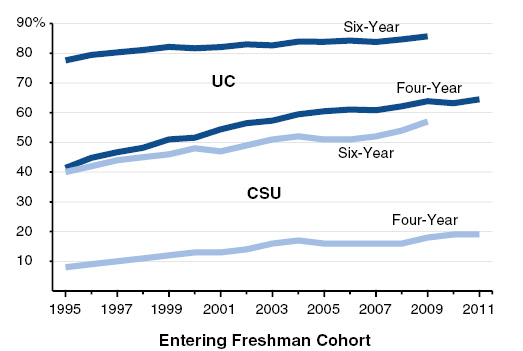
- Among recent cohorts, slightly more than 60 percent of UC freshmen and slightly less than 20 percent of CSU freshmen have graduated within four years. These rates are up notably from 15 years ago.
- Some students not graduating on time graduate within the next couple of years. Beyond six years, graduation rates taper off considerably, with increases of only a few percentage points thereafter.
- At UC, transfer students are as likely as freshmen to graduate, but they are less likely to graduate on time. At CSU, transfer students are more likely both to graduate and graduate on time compared to freshman.
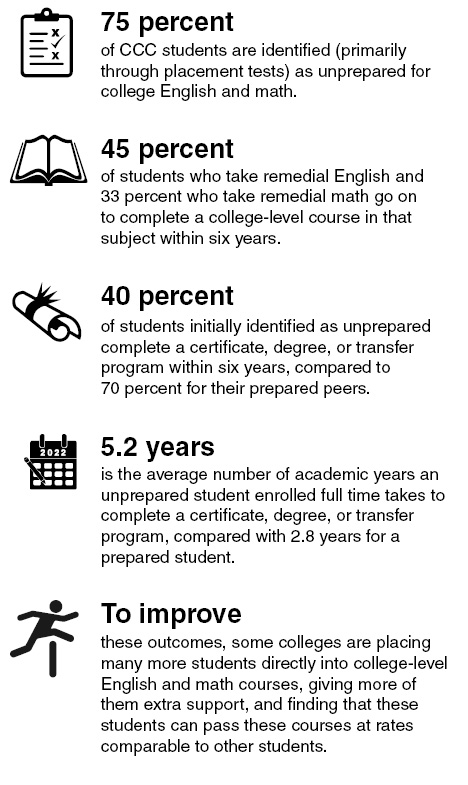
College-Preparedness Linked With CCC Student Outcomes