LAO Contact: Ryan Miller

February 2, 2016
A Review of the CalSTRS Funding Plan
State’s Future Responsibility for CalSTRS Uncertain
This post is the fifth in a series looking at the implementation of the CalSTRS funding plan. Below, we describe how the state’s share of CalSTRS’ unfunded liabilities will be more sensitive to investment gains and losses than the district share. This makes the state’s future responsibility for CalSTRS relatively uncertain.
Update. As noted on the homepage of this series, the CalSTRS board voted in June 2016—after we published this series—to maintain the state’s contribution at its fully phased-in level until the state’s share of CalSTRS’ unfunded liabilities is eliminated. Relative to Figure 1 below, this change will reduce somewhat the state’s share of the unfunded liability but does not fundamentally change our findings described below.
State Share of CalSTRS Unfunded Liability Relatively Sensitive to Changes in Assets. In our third post, we showed how the funding plan’s key calculation gives the state the benefit of theoretical investment gains that do not exist in the real world. For example, if CalSTRS’ real world portfolio grows by $10 billion, the calculation gives the state the benefit of a roughly $12 billion gain. Because theoretical assets that determine the state’s share of the unfunded liability fluctuate more than real world assets and because the state’s share of the unfunded liability ($15 billion) is much smaller than the district share ($58 billion), the state share will be relatively sensitive to changes in assets.
Investment Return Simulations Illustrate Relative Volatility in State Share. In June 2015, CalSTRS’ consulting actuaries provided the CalSTRS board with a simulation of 1,000 possible future investment return scenarios. These scenarios projected state and district contribution rates and state and district shares of unfunded liabilities. Figure 1 displays CalSTRS’ projections of the state and district shares of unfunded liabilities under a sample of simulations reflecting average investment returns of between 5.6 percent and 10.9 percent. (CalSTRS’ assumed rate of return is 7.5 percent.) As shown in the figure, the state share of CalSTRS’ future unfunded liabilities is far more volatile than the district share.
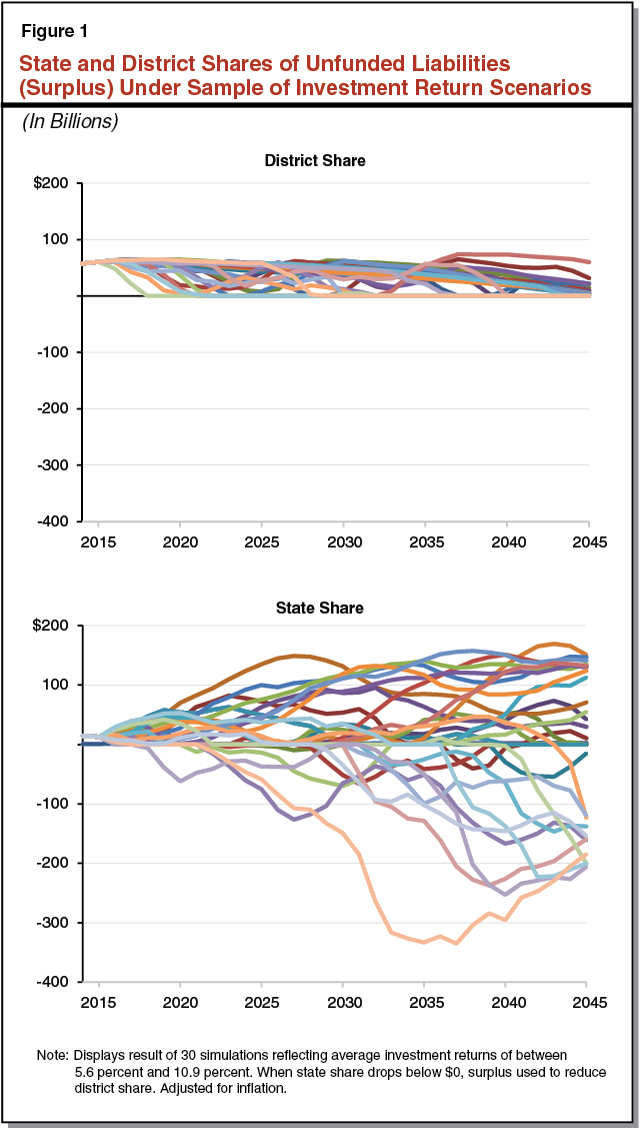
State’s Future Responsibility for CalSTRS Relatively Uncertain. The range of outcomes under these simulations illustrate the future uncertainty of the state’s responsibility for CalSTRS. In some scenarios, CalSTRS records large investment gains in the near term that eliminate the state’s share of the unfunded liability. Accordingly, in these scenarios the state’s funding plan contribution drops to zero through the mid-2040s. (The state would continue to make other contributions to CalSTRS that are not determined by the funding plan’s central calculation.) In other scenarios, investments underperform assumptions and the state’s share of the unfunded liability—along with its funding plan contribution rate—increases steadily each year. In these scenarios, state contributions reach about 18 percent of payroll by the mid-2040s. In the context of current statewide teacher payroll, the difference between these two extremes is roughly $5 billion—more than three times the state’s current contribution to CalSTRS’ main pension program. We note that the state’s share of CalSTRS’ unfunded liability would be higher than reflected in the figure if CalSTRS lowers its assumption concerning future investment returns.
District Responsibility for CalSTRS Relatively Certain. As the figure indicates, the district share of the unfunded liability will be more stable. In addition, the law sets a floor and ceiling for district rates—8.25 percent and 20.25 percent, respectively. These factors make future district costs more certain than state costs.