
2022-23 Fiscal Outlook Revenue Estimates
November 17, 2021
This post provides additional commentary on the revenue forecast included in our recently released Fiscal Outlook. In the first part of this post, we consider whether recent extraordinary revenue gains will be sustained moving forward. Overall, our forecast seeks a balance among various possibilities, assuming neither that recent gains are entirely sustainable nor that they are entirely unsustainable. We next summarize our multiyear revenue forecast. Our main forecast aims to find revenue estimates that will be least wrong most often. These estimates, like any forecast, will be wrong to some degree, so we also offer a range of the most plausible alternative outcomes. We end the post with observations on revenues from each of the state’s three largest taxes.
Revenue Is Surging, But Is It Sustainable?
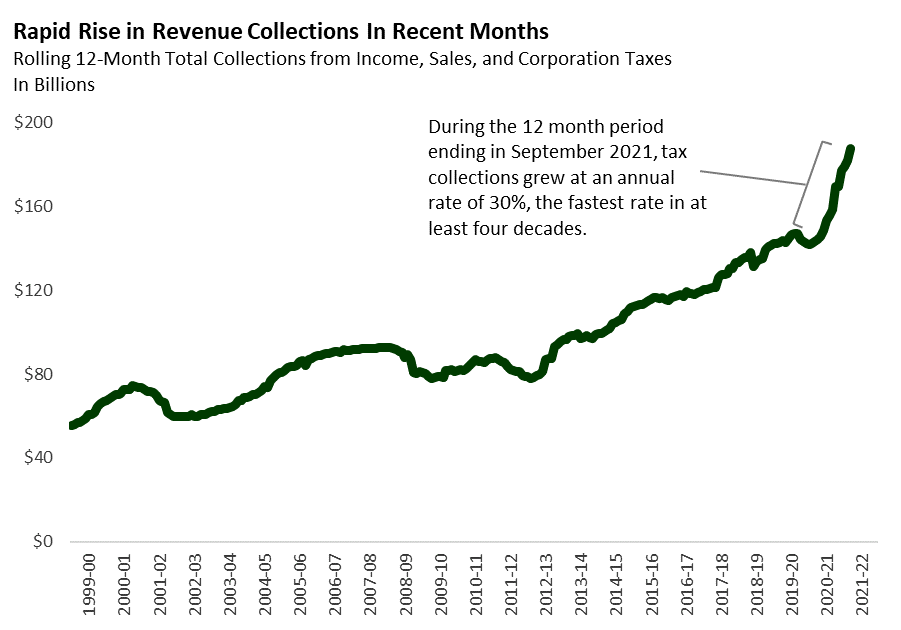
Unprecedented Growth in Revenues. Revenue collections have grown rapidly in recent months. For example, September 2021 collections from the states three largest taxes were 40 percent higher than September 2020 and almost 60 percent higher than September 2019. As a result of this surge, collections so far this fiscal year are already over $10 billion ahead of 2021-22 Budget Act (budget act) assumptions. Underlying the recent surge is a meteoric rise in several measures of economic activity. Retail sales have posted double digit growth during 2021. Stock prices have doubled from their pandemic low last spring. Several major firms have posted historically high earnings.
Estimates Seek to Balance Possibilities. With the recent rapid growth, many parts of the economy as well as state revenues now sit well above long-term trends. Even though our forecast assumes that the rapid pace of growth will slow over the coming months, a reasonable concern remains that the current level of revenues may be unsustainable. Recognizing this risk, our forecast takes a middle ground of possibilities, assuming neither that recent gains are entirely sustainable nor that they are entirely unsustainable. Below we provide detail on how this assumption is carried out in our forecasts for personal income, corporation, and sales taxes.
Personal Income Tax
Rapid Growth in Personal Income Tax Revenue. Personal income tax revenue surged in 2020-21 despite the ongoing decline in employment. Personal income tax revenue totaled $127.7 billion in 2020-21, 29 percent above 2019-20. This trend of strong growth has continued so far in 2021-22. For example, withholding collections so far in 2021-22 have been 22 percent above the same months in 2020-21 and 32 percent above the same months in 2019-20. Similarly, September 2021 estimated income tax payments were up more than 50 percent over September 2020.
Asset Prices an Important Driver. After dropping significantly at the onset of the pandemic, stock prices rebounded dramatically. Stocks now are more than double their pandemic period low. Similarly, home prices have grown more than 25 percent since the start of the pandemic. These asset price gains likely have led to considerable increases in capital gains income. Along with this surge in assets prices has come a significant uptick in initial public offerings of California companies. This activity similarly has boosted the incomes of Californians who own or work for these companies, which results in both higher withholding collections and tax payments for capital gains.
Forecast Anticipates Slower Growth. The torrid pace of these recent trends is unlikely to be sustained for an extended period of time. As such, our forecast expects asset markets and initial public offering activity to moderate in the budget year, resulting in slower growth in withholding and tax payments for capital gains. In the out years, our forecast has an even stronger reversion of personal income tax revenues toward the historical, pre-pandemic trend. This is reflected in the fact that we forecast revenues to remain relatively flat from 2022-23 to 2023-24.
Corporation Tax
Cash Collections Have Significantly Outpaced Expectations Recently. Cash collections for 2020-21 significantly surpassed all of the previous projections. As a result, state revenue from the corporation tax increased from $14.3 billion in 2019-20 to $22.0 billion in 2020-21. Not only has the strongly positive trend in cash collections been sustained so far in the current fiscal year, the trend appears to be accelerating. As of October 2021, net corporation tax cash collections for the year-to-date were 48 percent above the budget act projections.
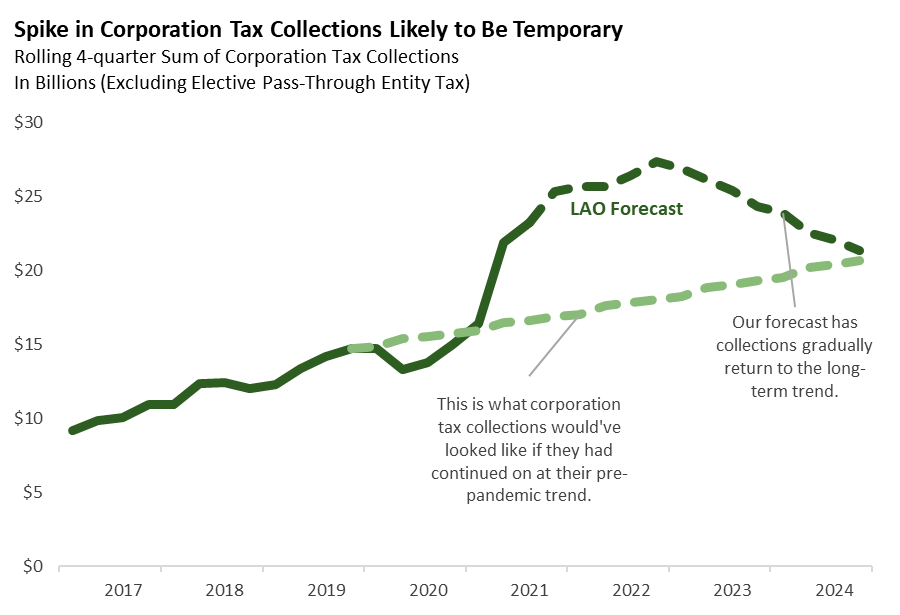
Confluence of Factors Driving Strong Collections. Recent strength in corporation tax collections likely arises from the combination of (1) a temporary decrease in the use of certain tax credits and deductions due to Chapter 8 of 2020 (AB 85, Committee on Budget) and (2) increased profits among businesses that were well-positioned to profit from changes in consumption arising from to the pandemic. This combination of factors will not persist indefinitely. AB 85 expires after 2022. Further, the impact of the pandemic on consumption patterns and profitability likely will wane over time. As such, beginning in 2023-24 our forecast puts corporation tax revenues back in line with the long-term trend that had persisted through 2019, prior to the impacts of the pandemic.
Sales Tax
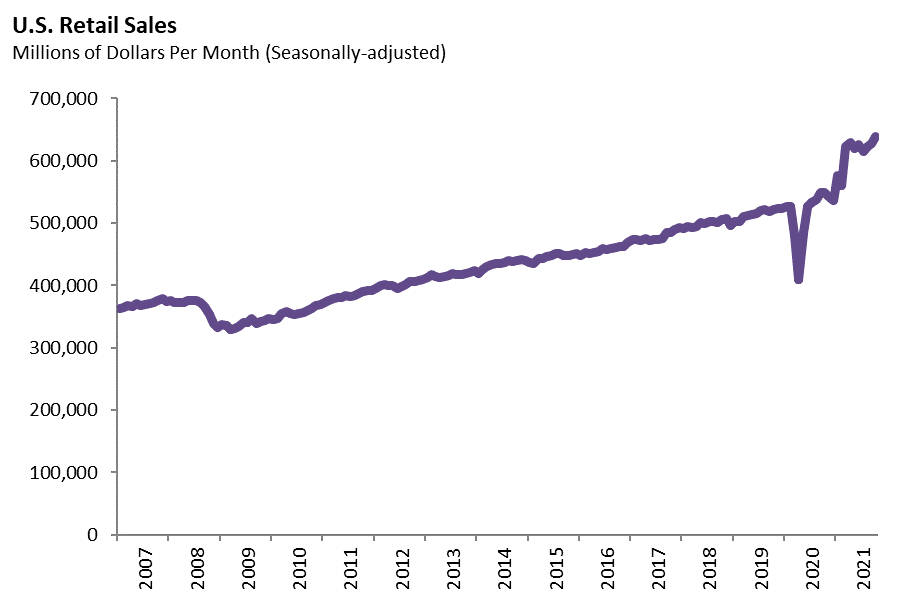
Extraordinary Growth in Retail Sales. As shown in the figure below, U.S. retail sales (seasonally adjusted) plummeted in March and April 2020, then recovered quickly in the late spring and summer. Sales then grew dramatically in the first few months of 2021 and have remained highly elevated through the summer.
Similar Fluctuations in California Taxable Sales. U.S. retail sales data are monthly, and the most recent data point is October 2021. In contrast, California taxable sales data are quarterly, and the most recent data point is the second quarter (April-June) of 2021. Nevertheless, California taxable sales have followed roughly similar patterns to U.S. retail sales: plummeting in Spring 2020, recovering quickly in Summer 2020, and growing dramatically in the first half of 2021.
Sales Tax Forecast Includes Major Adjustment. To arrive at our forecast for sales and use tax (hereafter, sales tax) revenue, we made a major downward adjustment to the estimate from our forecast model. We made this adjustment for two reasons:
- Extreme Volatility in 2020 and 2021. The figure below displays quarterly changes in the modified measure of taxable sales that we use for our forecast. Over the last four decades, this measure of taxable sales has grown at an average rate of one percent per quarter. As shown in the figure, it has experienced unusually large swings in four of the last six quarters, including two very large declines and two very large increases. Typically, our forecasts use the most recent quarter of data as a starting point. Due to the recent quarter-to-quarter volatility, however, the second quarter of 2021—during which taxable sales grew at an annualized rate of nearly 30 percent—might not be a very reliable starting point for the forecast.
- Uncertainty About Sustainability of Current Sales. As noted above, the current level of sales is well above the long-term trend. Wondering how long retail sales can remain at such high levels is natural. We aim to have a forecast that reflects multiple possibilities, including: (1) high levels of sales persisting for a long time; (2) sales declining all the way back to the prior trend; (3) a range of outcomes in between those two extremes.
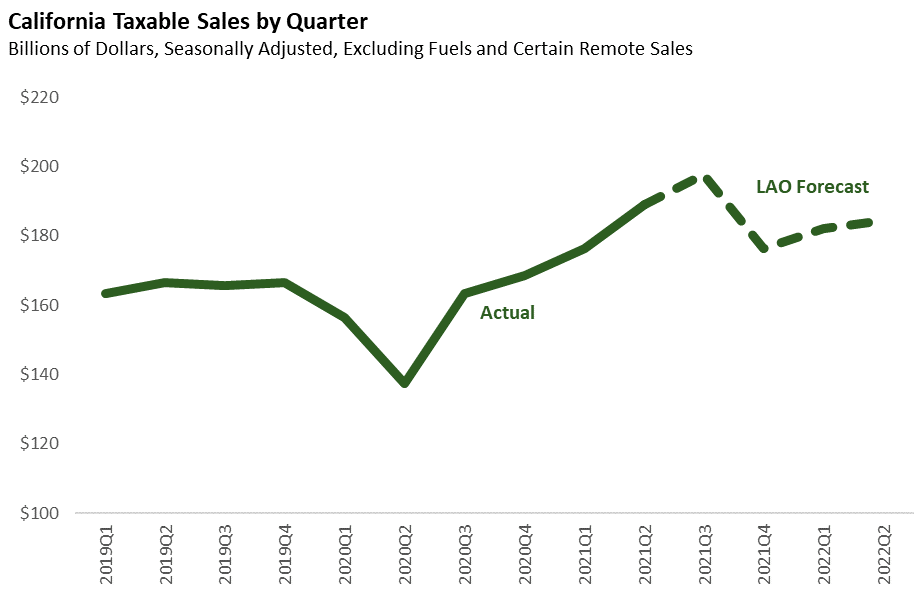
Due to Adjustment, Forecast Dips in Late 2021. Our typical approach forecasts the level of taxable sales in each quarter by applying a forecasted growth rate for that quarter to the level of taxable sales for the prior quarter (actual data if available, forecast otherwise). For the reasons noted above, we used a different approach to forecast the level of taxable sales in the fourth quarter of 2021. (We did not use a different approach for the third quarter of 2021, however, because nationwide retail sales data suggests that taxable sales likely remained high in the third quarter.) Instead of applying our forecasted growth rate to the forecasted level of taxable sales for the third quarter of 2021 (an extremely high level by historical standards), we started with a smoothed-out level of taxable sales. The smoothed-out level covers six quarters from the beginning of the COVID-19 pandemic (in the first quarter of 2020) through the most recent quarter of data (in the second quarter of 2021). Our adjustment results in a noticeable dip in the fourth quarter of 2021. This lower level of forecasted taxable sales in the fourth quarter of 2021 reflects our attempt to incorporate the possibility that not all of the recent uptick in taxable spending will be sustained moving forward.
LAO Revenue Outlook
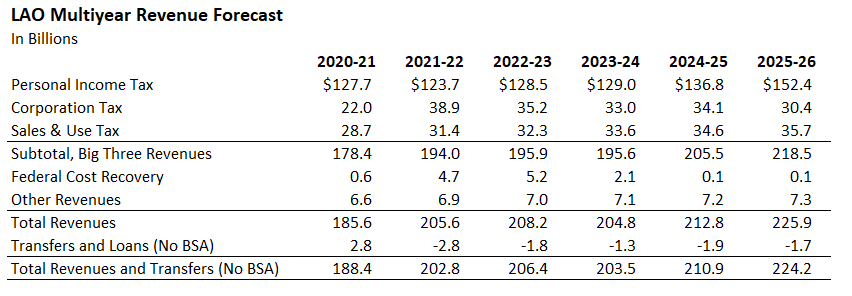
Moderated Growth. The table below summarizes our main forecast for total General Fund revenues (including transfers.) Under this forecast, the rapid pace of growth moderates significantly moving forward. Whereas revenues grew over 30 percent in 2020-21, our main forecast has growth drop to 8 percent in 2021-22, fall further to about 2 percent in 2022-23, and then becomes slightly negative in 2023-24. Beyond that, our forecast has growth return to historical norms of 5 to 6 percent per year. (As discussed in more detail in the next section, our estimates for the personal income tax and corporation tax are not directly comparable to budget act estimates because of a change in the treatment of a recently created elective pass-through entity tax. Estimates of total revenue are still comparable.)
Forecast Well Above Budget Act. While our forecast assumes growth will slow in the coming year, the budget act assumed an even more stark reversal of recent trends. As a result, our forecast is $51 billion above the budget act across the 2020-21 to 2022-23.
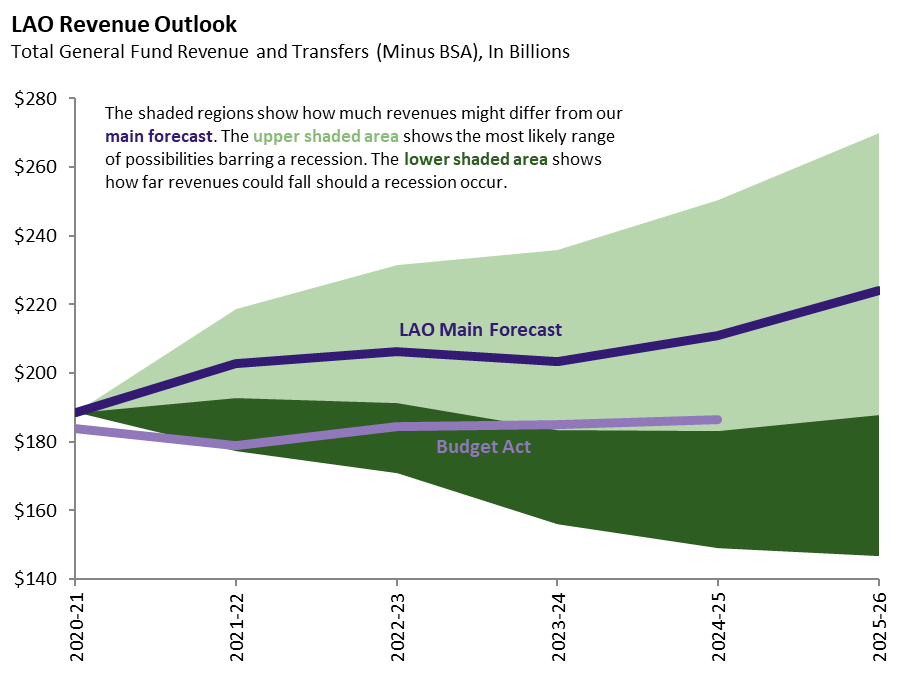
Wide Range of Possible Outcomes. While our main forecast presents the estimates we think are most likely to be least wrong, they will be wrong to some extent. The graph below shows how much historical experience suggests revenue could differ from our main forecast. As shown on the figure, this uncertainty is very large by the end of our forecast in 2025-26. Revenues ending up $75 billion below or $50 billion above our forecast is entirely plausible.
Comments on the Big Three Taxes
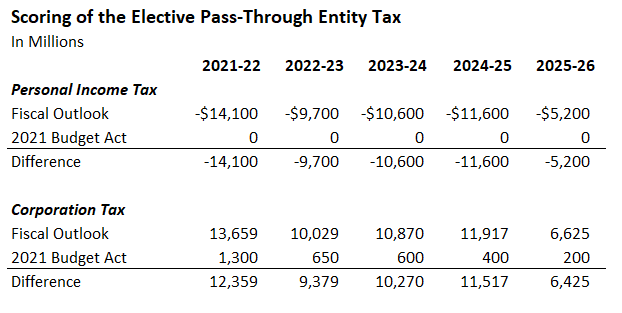
Different Treatment of Elective Pass-Through Entity Tax. Our Fiscal Outlook forecast reflects a change in the treatment of a new elective pass-through entity tax. This new tax results in an increase in corporation tax revenues which largely is offset by a decrease in personal income tax revenues. The budget act scored these offsetting effects by adding the net increase in revenue to corporation tax revenues, while making no change to personal income tax revenues. Our office and the administration have since changed the convention for scoring this new tax. We now add the gross amount of new revenue to the corporation tax and subtract the full amount of offsetting reductions from the personal income tax. The table below summarizes these changes.
Personal Income Tax
Forecast Well Above Budget Act Figures. The budget act projected that personal income tax revenue would be $123.3 billion in 2021-22 and $128.5 billion in 2022-23. Based on recent trends in revenue, incomes, and asset prices, we now project that the personal income tax will generate $137.8 billion in 2021-22 and $138.2 billion in 2022-23 (excluding the effect of the elective pass-through entity tax), an increase over both years combined of $24 billion or about 11 percent.
Slower Growth Going Forward. Our forecast of 2021-22 represents 8 percent growth over 2021-22. Our forecasted growth slows to 4 percent in 2022-23 and further to about half a percent in 2023-24. Thereafter, we forecast growth returning to historic norms of about 6 percent per year.
Corporation Tax
Projected Growth in Corporation Tax Revenue Far Above Budget Act Assumptions. Excluding the effects from the new elective pass-through entity tax, the budget act assumed that corporation tax revenue would decline to $16.8 billion in 2021-22 and $16.7 billion in 2022-23. Based on recent trends in cash collections, we now project that the corporation tax (excluding the new tax) will generate $25.3 billion in 2021-22 and $25.1 billion in 2022-23.
Corporation Tax Declines in 2023-24 Before Returning to Typical Growth. Our corporation tax forecast for 2023-24 declines by 12 percent to $22.1 billion as AB 85 expires. In subsequent years, our corporation tax forecast returns to levels that are in line with the long-term trend, $22.2 billion in 2024-25 and $23.8 billion in 2025-26.
Pandemic’s Effect on Corporate Profits Is Complicated. There is no easy way to summarize the impact of the COVID-19 pandemic on corporate profits. In 2020, amidst the worst of the pandemic, national economic statistics showed a significant decline in corporate profits. However, these aggregate statistics hide widely disparate effects on businesses. While many firms experienced a significant loss of revenue and higher expenses, some other businesses—across many sectors of the economy—were relatively well-positioned to profit from changes in consumption that appear to be related to the pandemic. In 2021, national statistics show a major reversal of the 2020 pattern, with aggregate corporate profits posting large gains in the first half of 2021. Moving forward, our forecast is consistent with a gradual transition away from this period of heightened volatility in corporate profits towards a period of growth more consistent with historic norms.
Sales Tax
Very Strong Growth in 2021-22, Then Normal Growth in 2022-23. Our General Fund sales tax forecasts for 2021-22 and 2022-23 are $31.4 billion and $32.3 billion respectively. The 2021-22 total is 9 percent higher than 2020-21, while the 2022-23 total is 3 percent higher than 2021-22. If not for the adjustment described above, we would have forecast even higher growth rates for these two years, as suggested by a variety of economic indicators.
Typical Growth in 2023-24 and Beyond. Our sales tax forecast grows 4 percent in 2023-24 and 3 percent in each subsequent year, yielding fiscal year totals of $33.6 billion, $34.6 billion, and $35.7 billion.