
L.A. and Inland Empire Drive Statewide Unemployment Rate. In recent years, California's unemployment rate has been above the national average. As of December 2014, the unemployment rate for the state sits at 7.0%, compared to 5.6% for the nation as a whole. We recently noted that within California, the counties with the biggest concentration of farm jobs tend to have some of the highest unemployment rates. While many of these counties have unusually high unemployment, they are not primarily responsible for the state's relatively high unemployment rate relative to the rest of the country. Instead, it appears that persistent weakness in parts of Southern California—specifically, Los Angeles County and the Inland Empire (Riverside and San Bernardino Counties)—is a bigger driver of California's relatively high unemployment rates.
2013 Statewide Data. Riverside and San Bernardino Counties were especially hard hit by the housing crisis and have had unemployment rates well above the state average. Los Angeles County also has had higher unemployment rates than the rest of the state. In 2013, these three counties had a combined unemployment rate of 10.0%, which was above the statewide average of 8.9% for the year. In the scatterplot below, the unemployment rates of these three counties are displayed with large red diamonds. Importantly, the combined labor force of Los Angeles, Riverside, and San Bernardino Counties was 6.8 million, or about 36% of the state's total.
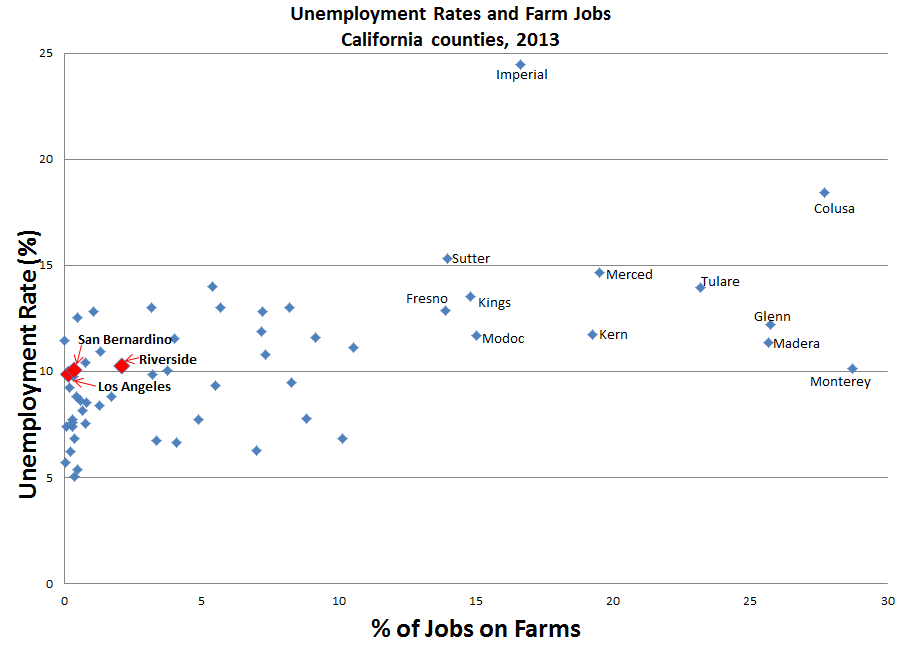
Above, the scatterplot designates the 12 California counties with 11% or more of their jobs on farms. For this exercise, consider these 12 counties the agriculture-focused county economies. In 2013, these 12 counties had a combined labor force of 1.7 million—9% of the state total—and a combined unemployment rate of 13.1%.
In 2013, the state's remaining 43 counties (that is, all of the counties not labeled in the scatterplot above) had a labor force of 10.2 million—55% of the state total—and a combined unemployment rate of 7.6%, very close to the national unemployment rate in 2013 of 7.4%.
What if These Regions Had Lower Unemployment in 2013? Assuming no other changes, how many more people would have had jobs if conditions in the two hard-hit regions had been the same as they were in the remaining 43 counties in 2013? In these 43 other counties, the combined unemployment rate was 7.6%. With unemployment rates that low, the agriculture-focused counties would have had about 92,000 fewer unemployed workers in 2013. Combined, Los Angeles, Riverside, and San Bernardino Counties would have had about 160,000 fewer unemployed. This helps illustrate that the unemployment rates in Los Angeles and the Inland Empire—while not nearly as high as in the agriculture-focused counties—have a bigger impact on statewide unemployment. In 2013, if just Los Angeles and the Inland Empire had unemployment rates at the levels recorded in the other 43 counties, the statewide unemployment rate would have been 8.1% in this scenario, causing more than half of the gap between California's unemployment rate and the national average to be eliminated.
Los Angeles County Will Be Key In Determining Future State Unemployment Rates. Unemployment rates in California have improved in 2014. As of December 2014, non-seasonally-adjusted unemployment rates total 7.5% in Los Angeles County, 7.4% in Riverside County, and 7.0% in San Bernardino County—each at or somewhat above the statewide average, which in turn remains higher than the U.S. unemployment rate. Still, the same basic pattern holds true as in 2013. If these three counties had unemployment rates like the other 43 counties in California discussed above, most of the gap between California's state unemployment rate and the nation's would be closed. Because of Los Angeles County's size, its unemployment levels play an especially large role in determining how high California's unemployment rate is.