Introduction
In January 2007, our office released the first edition of
California’s Criminal Justice System: A Primer to provide the public, media, and policymakers some basic information on the state’s criminal justice system, caseloads, costs, trends, and outcomes. This publication provides more up-to-date data, generally through 2011. Updating this information for policymakers is particularly important in light of major criminal justice law changes implemented in 2011 that shifted—or “realigned”—significant responsibilities from state corrections agencies to county governments. Such data gives policymakers a picture of the state’s criminal justice system prior to the full implementation of the 2011 realignment, against which they can evaluate how the system changed following the realignment (such as in terms of crime rates, court caseloads, and correctional populations).
This primer is organized into different sections that seek to answer key questions about the criminal justice system in California. Chapter 1 provides a general overview of the state’s criminal justice system, including information on the respective roles of different state and local agencies. Chapters 2 through 5 provide a series of charts and tables on each of the four major stages of the criminal justice system: (1) the commission of crimes, (2) arrest by law enforcement agencies, (3) prosecution in the trial courts, and (4) state and local corrections. Chapter 6 discusses some of the recent significant policy changes in California criminal justice, as well as some of the major criminal justice policy challenges facing policymakers in the next few years. The Appendix of this report provides a detailed list of the major policy changes in the past 20 years, as well as selected LAO publications related to criminal justice.
Chapter 1:
Overview of California’s Criminal Justice System
The primary goal of the criminal justice system in California is to provide public safety by deterring and preventing crime, punishing individuals who commit crime, and reintegrating criminals back into the community. This chapter provides a brief overview of the system, highlighting the basics of California’s sentencing laws and the four major stages of California’s criminal justice system.
Basics of Criminal Sentencing Law
The criminal justice system is based on criminal sentencing law, the body of laws that define crimes and specify the punishments for such crimes.
Types of Crimes. Sentencing law generally defines three types of crimes: (1) felonies, (2) misdemeanors, and (3) infractions.
- A felony is the most serious type of crime, and an individual convicted of a felony may be sentenced to state prison under certain circumstances. Individuals convicted of felonies who are not sentenced to state prison are sentenced to county jail, supervised by the county probation department in the community, or both. The California Penal Code classifies certain felonies as “violent” or “serious,” or both. These include murder, robbery, rape, burglary of a residence, and assault with intent to commit robbery. The sentence an offender convicted of a felony receives depends on the current crime, the offender’s criminal history, and the discretion of the court. As a result of statutory changes adopted in 2011, adult felons can generally only be sentenced to state prison if they have a current or prior conviction for a felony that is a violent, serious, or sex offense.
- A misdemeanor is a less serious offense, for which the offender may be sentenced to probation, county jail, a fine, or some combination of the three. Misdemeanors include crimes such as assault, petty theft, and public drunkenness.
- An infraction is the least serious offense and is generally punishable by a fine. Most motor vehicle violations—such as exceeding the speed limit—are considered infractions.
California law also gives law enforcement and prosecutors the discretion to charge certain crimes as either a felony or a misdemeanor. These crimes are known as “wobblers.” In addition, some offenses, referred to as “status” offenses, apply only to juveniles (such as curfew violations and truancy).
Determinate Sentencing. Prior to 1977, convicted felons received indeterminate sentences in which the term of imprisonment included a minimum with no prescribed maximum. For example, an individual might receive a “five-years-to-life” sentence. After serving five years in prison, the individual would remain incarcerated until the state parole board determined that the individual was ready to return to the community and was a low risk to commit crimes in the future.
In 1976, the state enacted a new sentencing structure for felonies, called determinate sentencing, which took effect the following year. Under this structure, most felony punishments have a defined release date based on the “triad” sentencing structure. This structure provides the court with three sentencing options for each crime. For example, a first-degree burglary offense is punishable by a term in prison of two, four, or six years. The court determines which of these sentences is most appropriate based on whether the circumstances surrounding the crime—such as its perceived heinousness—or the offender’s criminal history warrant more or less incarceration time. In some cases, however, offenders are still punished by indeterminate sentences. Generally, indeterminate sentences are provided for some of the most serious crimes, such as first-degree murder, as well as for some repeat offenders. As of June 2012, 29 percent of state prison inmates were serving indeterminate life sentences. Under certain circumstances, offenders convicted of murder can be sentenced to death.
Stages of the Criminal Justice System
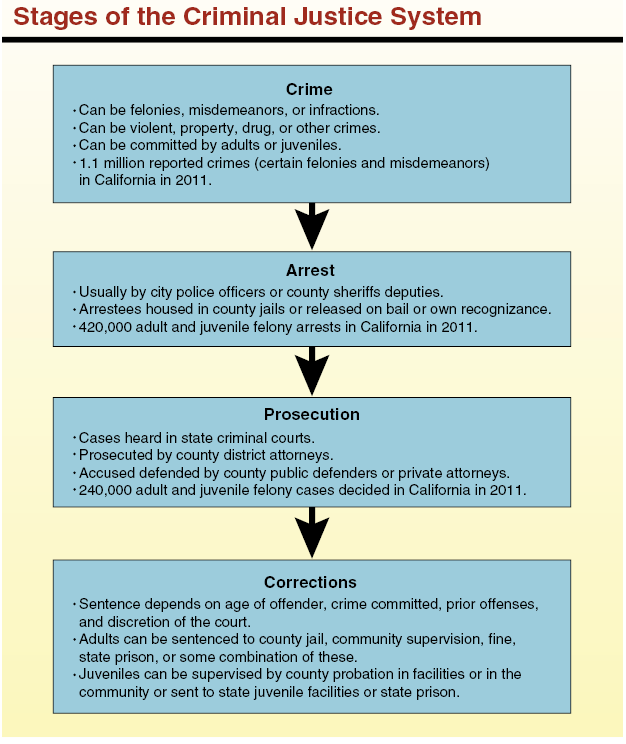
California’s criminal justice system can be thought of as having four stages: (1) the commission of the crime, (2) arrest by law enforcement, (3) prosecution of a case in the trial courts, and (4) detention and supervision by corrections agencies. The nearby figure summarizes each of these phases, and Chapters 2 through 5 of this report provide more detailed information on each of these stages.
Crime in California. Crime is generally measured as a rate per 100,000 residents to allow easier comparisons across states and regions. The federal government collects crime rate statistics for certain crimes, primarily property and violent felonies. (This data does not include drug crimes, infractions, or most misdemeanors.) The crime rate in California has declined substantially since the early 1990s and is now at a level similar to that of the early 1960s. In 2011, the overall crime rate in California was slightly below the national average. These rates, however, only reflect reported crimes, and national surveys show that most crime is not reported to law enforcement authorities.
Arrests and Local Law Enforcement. After a crime is committed and reported to law enforcement, suspected offenders are arrested by law enforcement officers. Most arrests are for misdemeanor offenses. Of offenders arrested for felony offenses, most are adults, and most are arrested for nonviolent crimes. In California, state sentencing laws are primarily enforced at the local level by the sheriff and police officers, who investigate crimes and apprehend offenders. The state does have a limited role in law enforcement. For example, the California Highway Patrol (CHP) has a comparatively small number of officers to ensure safety and enforce traffic laws on state highways and county roads in unincorporated areas. The state also provides law enforcement officers in other places such as state parks and college campuses. In addition, the California Department of Justice (DOJ), led by the state Attorney General, provides assistance and expertise to local law enforcement in the investigation of crimes that are multi-jurisdictional (occur in multiple counties) such as organized crime.
Prosecutions and the Courts. Once an individual is arrested and charged with committing a crime, he or she must go through California’s trial court system. The trial courts are funded by the state, though local governments provide district attorneys and public defenders to try criminal cases. When including all types of criminal cases—felony, misdemeanor, traffic infractions, and juvenile delinquency—there were over 8 million filings in California trial courts in 2009-10. Only a few hundred thousand of these are for felony cases each year. Of adult felony cases brought by the district attorney, 80 percent result in a guilty verdict, and most of these offenders are sentenced to a combination of jail and probation. Almost all juveniles adjudicated for a felony offense are sentenced to county supervision. Federal criminal law is limited to the powers of the federal government enumerated in the United States Constitution. Therefore, most federal criminal laws relate to the federal government’s role in the regulation of interstate commerce, immigration, and the protection of federal facilities and personnel. Consequently, federal law enforcement and prosecutions tend to focus on non-violent crimes such as drug trafficking, immigration violations, fraud, bribery, and extortion.
Local and State Corrections. The component of the criminal justice system that supervises offenders is commonly referred to as “corrections” or the “correctional system.” In California, adults convicted of felony crimes generally are placed under supervision either at the local level (jail and probation) or the state level (prison and parole), depending on the seriousness of the crime and the length of incarceration. Juvenile offenders can be adjudicated to local probation to be supervised in the community or housed in local juvenile facilities, or they can be sent to state facilities in some cases. Most offenders, including felony offenders, are supervised by local corrections agencies, while a smaller number of the most serious and violent offenders are supervised by the state.
Chapter 2:
Crime in California
Like most of the rest of the nation, crime rates in California have declined over the past couple decades. Specifically, the state’s overall crime rate has returned to levels similar to those in the early 1960s. The vast majority of crimes in California are property crimes, with a much smaller share being violent crimes.
We note that the crime rates cited in this primer are based on the federal Uniform Crime Reporting program, which is designed to collect comparable crime statistics from all states regarding selected crimes as reported or identified by law enforcement agencies. The crimes reported in these statistics are primarily felonies and include murder, rape, robbery, aggravated assault, burglary, larceny-theft, and motor vehicle theft. Reported crimes, however, do not tell the entire story of crime. This is because a significant amount of crime committed each year goes unreported to law enforcement authorities and thus is not counted in official statistics. According to the U.S. DOJ’s National Crime Victimization Survey (NCVS), almost half of violent crimes and over 60 percent of property crimes go unreported nationally.
In this chapter, we provide information on crime in California, including information on the amount of crime, who commits crimes, and who are victims of crime.
- California experienced declines in both property and violent crime rates since the early 1990s. Between 1991 and 2011, the state’s overall crime rate declined by 56 percent. This trend is similar to declines in crime patterns in the rest of the U.S. There is no consensus among researchers regarding the cause of these declines.
- There were 1.1 million crimes in California in 2011 reported in the federal Uniform Crime Statistics system. This is down from a high of over 2 million felonies reported annually in the early 1990s.
- The violent crime rate in California has decreased by 63 percent since peaking in 1992. The property crime rate has decreased by 63 percent since peaking in 1980.
- Overall, California reported about 3,000 crimes per 100,000 people in 2011.
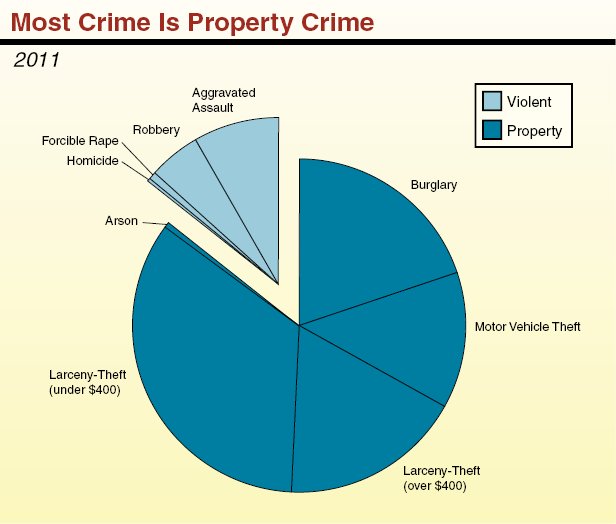
- Property crime accounted for 86 percent of reported crimes in California in 2011, and violent crime accounted for 14 percent.
- Property crime is reported in five categories: (1) larceny-theft of property over $400 in value, (2) larceny-theft of property under $400 in value, (3) burglary, (4) motor vehicle theft, and (5) arson.
- Although the proportion of crime changes slightly every year, property crimes have consistently represented approximately 85 percent of all reported crimes over the past 25 years.
- California’s overall crime rate was somewhat lower than the U.S. crime rate in 2011, and was third lowest among the ten most populous states.
- California’s violent crime rate is 6 percent higher than the U.S. rate and the fourth highest among the largest states.
- California’s property crime rate ranks as third lowest among the largest states, 11 percent below the national rate.
- Among the largest counties in California, San Joaquin had the highest overall crime rate in 2010, including the highest violent crime rate and second highest property crime rate (after Fresno).
- Since 2001, violent crime rates have decreased in 11 of the 15 largest counties, and the property crime rate has decreased in 13 of the 15 largest counties.
- Based on national surveys, about half of all violent crimes—excluding homicides, but including aggravated assault, robbery, and sexual assault—go unreported to police and other law enforcement authorities.
- People are even less likely to report certain property crimes, including motor vehicle theft, burglary, and theft. Overall, about three-fifths of these property crimes go unreported.
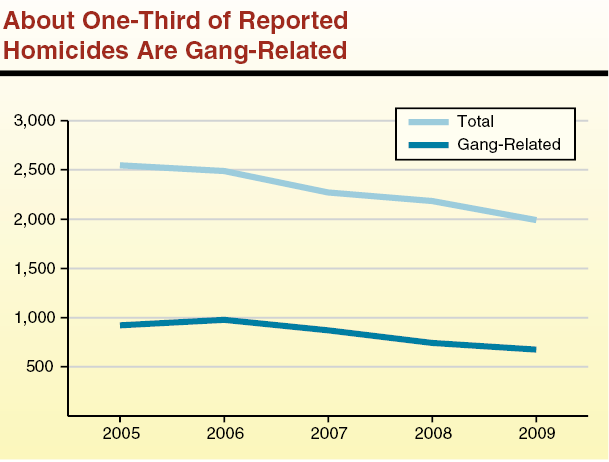
- A survey conducted by the Governor’s Office of Gang and Youth Violence Policy estimates that, between 2005 and 2009, over one-third of homicides in California were reported to be related to gang activity or committed by a gang member. The remaining homicides include murders committed as part of domestic disputes or vehicular manslaughter.
- About half of the homicides in Los Angeles County during this time period were gang-related, compared to about one-fourth in the rest of the state. This difference may be due in part to differences in how local law enforcement agencies collect and report data.
- Total homicides have declined in recent years, decreasing by 22 percent from 2005 to 2009 statewide (35 percent in Los Angeles and 13 percent in other parts of California). Gang-related homicides decreased by about the same amount over that period.
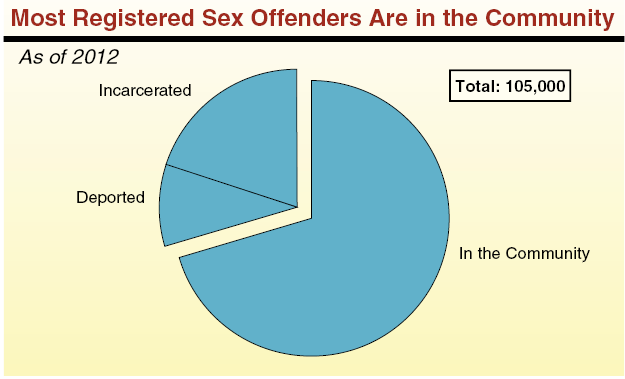
- Most individuals adjudicated for sex crimes in California (both felonies and misdemeanors) are required to register with local law enforcement for the remainder of their lives. There are currently about 105,000 such registrants listed in the Megan’s Law database maintained by DOJ. The public may access information—including name, address, and crime—for most of these offenders based on their specific conviction.
- As of October 2012, about 74,000 sex registrants were in the community, 10,000 had been deported, and 21,000 were incarcerated for subsequent offenses.
- According to data from the California Department of Corrections and Rehabilitation (CDCR), nearly 70 percent of sex registrants released from state prison in 2007-08 were returned within three years (including returns for new convictions and parole violations). This is slightly higher than the recidivism rate of other released inmates. Of the sex offenders returned to prison, less than 2 percent were returned on a conviction for a new sex crime.
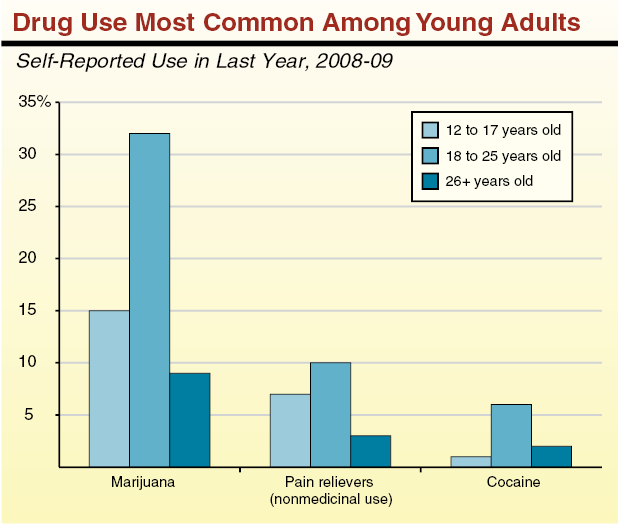
- Drug use is most prevalent among 18 to 25 year olds. Nearly one in three Californians in this age group report using marijuana in the past year. This is about 3 percentage points higher than the national average for this age group. We note that the data does not distinguish between recreational use and medicinal use, which is legal under state law.
- In addition to what is shown in the above figure, about 4 percent of Californians ages 12 and older report using an illicit drug other than marijuana in the past month, which is slightly above the national average of 3.5 percent.
Who Are the Victims of Crime?
2008
|
|
Victims
|
U.S. Population
|
|
Age
|
|
|
|
12 to 19
|
27%
|
13%
|
|
20 to 34
|
35
|
24
|
|
35 to 49
|
23
|
26
|
|
50 to 64
|
12
|
22
|
|
65 and over
|
3
|
15
|
|
Gender
|
|
|
|
Male
|
54%
|
49%
|
|
Female
|
46
|
51
|
|
Ethnicity
|
|
|
|
White
|
76%
|
81%
|
|
Black
|
16
|
12
|
|
Other
|
4
|
6
|
|
Multiracial
|
3
|
1
|
|
Family Income
|
|
|
|
Less than $25,000
|
32%
|
20%
|
|
$25,000 to $49,999
|
32
|
27
|
|
$50,000 to $74,999
|
15
|
19
|
|
$75,000 and above
|
21
|
34
|
- According to the NCVS—which surveys victims of personal crimes (such as robbery and assault) who are age 12 or older—a majority of the nation’s crime victims are under the age of 35. Older victims make up a comparatively smaller share of the nation’s crime victims than they do of the general population.
- Non-whites represent a somewhat disproportionate share of the nation’s crime victims relative to their share of the general population.
Estimated Costs of Crimes to Victims
Per Incident (In 2008 Dollars)
|
Crime
|
Tangible
|
Intangible
|
Total
|
|
Murder
|
$737,500
|
$8,442,000
|
$9,179,500
|
|
Rape/sexual assault
|
5,600
|
199,600
|
205,200
|
|
Aggravated assault
|
8,700
|
95,000
|
103,700
|
|
Robbery
|
3,300
|
22,600
|
25,900
|
|
Arson
|
11,500
|
5,100
|
16,600
|
|
Motor vehicle theft
|
6,100
|
300
|
6,400
|
|
Household burglary
|
1,400
|
300
|
1,700
|
|
Larceny/theft
|
500
|
—
|
500
|
- Researchers try to estimate the monetary and nonmonetary costs of crime to victims. This is inherently difficult, largely because of the subjective nature of putting a dollar value on the lost productivity, health consequences, and pain and suffering.
- Violent crimes (such as murder, sexual assault, and aggravated assault) have much higher estimated costs to victims than property crimes. This is because there are frequently high “intangible” costs associated with violent crimes. Intangible costs include pain and suffering, which are often estimated based on the amount of damages awarded by juries for different types of crime.
- For property crimes (such as robbery and theft), most costs tend to be “tangible” costs. These costs include the value of stolen or damaged property and lost wages or productivity as a result of criminal activity.
Chapter 3:
Arrests
The second stage of the criminal justice system—after the commission of a crime—is the arrest of alleged perpetrators. Arrests generally are made by local law enforcement agencies. There are about 600 such agencies in California, including police and sheriff’s departments. An arrest can result in someone being cited—or ticketed—by a law enforcement officer or being booked into county jail. In California, there were about 1.3 million arrests for felonies, misdemeanors, and status offenses in 2011. Most of these were for misdemeanor offenses. Roughly three-quarters of all felony arrests were for nonviolent crimes, and nine out of every ten felony arrests in California were of an adult offender. Almost two-thirds of all felony arrests were made by city police departments in California. In 2007 (the last year for which these data are available), state and local governments employed about 300 law enforcement staff per 100,000 people in the state, which is somewhat below the national average. Despite California’s lower law enforcement staffing levels, the state spends over one-third more per capita on law enforcement than the national average.
In this chapter, we present detailed information on who gets arrested in California and for what types of crimes. We also present information on the law enforcement agencies that arrest suspected criminals and how those agencies are staffed.
Over One Million Arrests in 2011
|
|
Adult
|
Juvenile
|
Total
|
|
Felony
|
376,511
|
43,403
|
419,914
|
|
Misdemeanor
|
741,122
|
84,333
|
825,455
|
|
Status offenses
|
—
|
21,827
|
21,827
|
|
Totals
|
1,117,633
|
149,563
|
1,267,196
|
- There were almost 1.3 million arrests of adults and juveniles for felonies, misdemeanors, and status offenses in California in 2011.
- Almost two-thirds of these arrests were for misdemeanors, while one-third were for felonies.
- The total number of arrests was down slightly from about 1.4 million in 2010.
Adults and Juveniles Arrested for Felonies
2011
|
|
Adult Felony Arrests
|
Juvenile Felony Arrests
|
California Population
|
|
Total Population
|
376,511
|
43,403
|
37,638,699
|
|
Gender
|
|
|
|
|
Male
|
78%
|
83%
|
50%
|
|
Female
|
22
|
17
|
50
|
|
Age
|
|
|
|
|
Under 18
|
—
|
100%
|
24%
|
|
18-19
|
9%
|
—
|
3
|
|
20-29
|
38
|
—
|
15
|
|
30-39
|
25
|
—
|
14
|
|
40 and over
|
28
|
—
|
44
|
|
Ethnicity
|
|
|
|
|
Black
|
20%
|
22%
|
6%
|
|
Hispanic
|
39
|
53
|
38
|
|
White
|
35
|
20
|
40
|
|
Other
|
6
|
6
|
16
|
- In 2011, males represented about eight out of every ten adult and juvenile felony arrests.
- Almost two-thirds of all adult felony arrests were of people between the ages of 20 and 39.
- A majority of felony arrests were of Blacks or Hispanics, with Hispanics making up just over half of all juvenile felony arrests. The percent of adult felony arrestees that were Hispanic was similar to the proportion of the population in California as a whole. About 6 percent of adults and juveniles in California are Black, which is less than the roughly 20 percent of adult and juvenile arrestees who are Black.
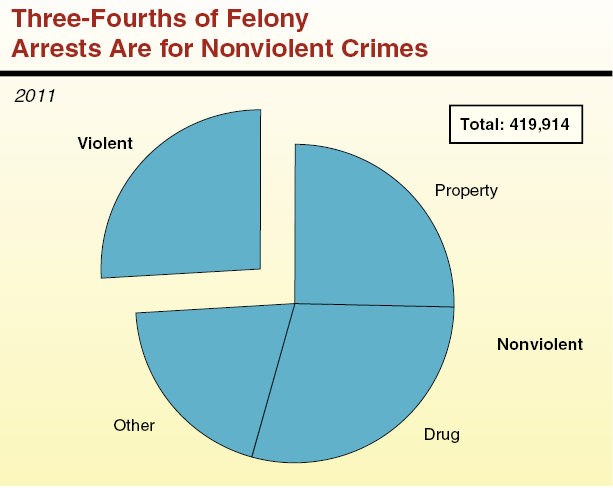
- There were a total of 420,000 felony arrests in 2011 (377,000 adult felony arrests and 43,000 juvenile felony arrests). About three-fourths of these arrests were for nonviolent crimes (such as property and drug-related crimes). Specifically, property crimes and drug offenses accounted for just over half of all felony arrests in 2011. Other nonviolent crimes (such as illegal possession of a firearm) accounted for 21 percent of felony arrests.
- As compared to adult felony arrests, a higher percentage of juvenile felony arrests are for property crimes while a lower percentage are for drug crimes.
- About one-fourth of adult and juvenile felony arrests were for violent crimes, including homicide, rape, and robbery. There were a total of 1,572 arrests for homicide in 2011, which is about 0.4 percent of all felony arrests.
Nine Out of Ten Arrests Made by Local Law Enforcement
2010
|
|
Felonies
|
Misdemeanors
|
Total
|
|
City Police
|
288,383
|
580,209
|
868,592
|
|
County Sheriff
|
148,102
|
225,186
|
373,288
|
|
California Highway Patrol
|
9,182
|
96,139
|
105,321
|
|
Other
|
2,885
|
16,745
|
19,630
|
|
Totals
|
448,552
|
918,279
|
1,366,831
|
- In 2010, a total of roughly 1.4 million felony and misdemeanor arrests were made in California (a total which decreased by 9 percent in 2011).
- Almost two-thirds of both felony and misdemeanor arrests were made by city police departments. By contrast, county sheriffs’ departments made one-third of felony and one-quarter of misdemeanor arrests.
- The remainder of arrests were made by the CHP and other law enforcement agencies, such as university police and the California Department of Fish and Wildlife.
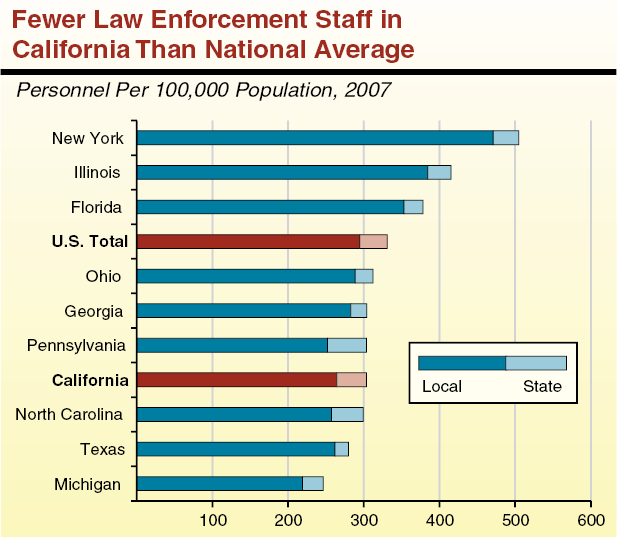
- In 2007, California had roughly 300 law enforcement staff per 100,000 residents. This included both sworn officers (such as police officers and deputy sheriffs), as well as non-sworn personnel (such as administrative staff). California’s rate was somewhat lower than the national average of 331 staff.
- Among the ten largest states, California ranked seventh in its number of law enforcement staff. New York had the highest rate of roughly 500 law enforcement staff per 100,000 residents.
- California was similar to other states in having a large majority of its law enforcement personnel work for local agencies. In California, 87 percent of law enforcement personnel worked for local agencies.
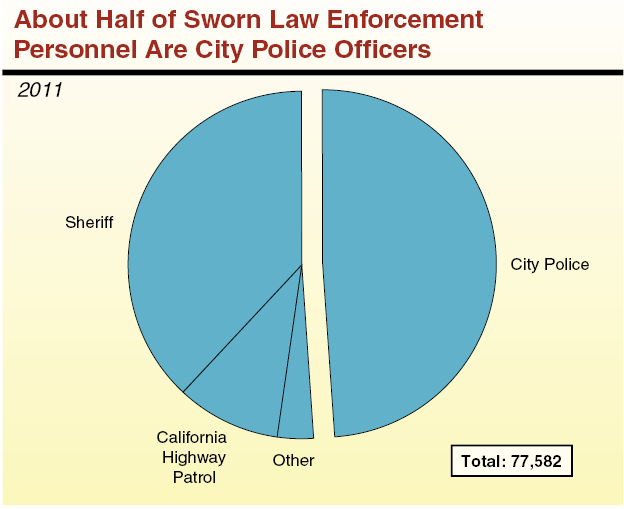
- About 77,600 sworn law enforcement personnel were employed by state and local law enforcement agencies in California in 2011.
- Of these sworn officers, 49 percent were employed by city police departments, 39 percent by sheriffs’ departments (including sheriffs’ deputies staffing county jails), and 10 percent by CHP. About 3 percent were employed by other entities, including the state universities and the California Department of Parks and Recreation.
- There were about 206 sworn state and local law enforcement officers for every 100,000 Californians in 2011, a slight decrease from a recent high of 221 in 2008.
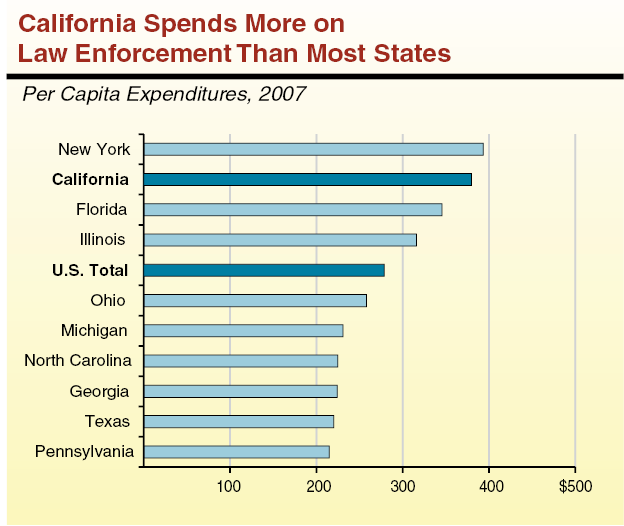
- State and local law enforcement agencies spent about $380 per Californian in 2007. This totals to about $14 billion statewide.
- California was the second highest among the ten largest states in per capita spending on law enforcement. Only New York—at $393 per person—spent more on law enforcement activities.
- Differences among states in per capita spending levels are attributable to differences in staffing levels, compensation, and cost of living.
Chapter 4:
Criminal Prosecutions
Following an arrest, a law enforcement agency may file a complaint against the individual. If the individual is an adult, the county district attorney may file charges to prosecute the alleged offender in one of the state’s trial courts located in each of the 58 counties. By comparison, most juveniles have their cases adjudicated in juvenile delinquency courts. The different court process for juveniles is to focus primarily on rehabilitation rather than punishment.
Of the criminal cases that proceed to the courts, the vast majority are traffic-related cases, mostly infractions. There were about 1.2 million felony, misdemeanor, and juvenile delinquency cases filed in the courts in 2009-10 (the most recent year for which we have data).
Following trial court realignment in 1997, California’s trial court system has been operated and funded by the state rather than counties. The counties, however, do still play important roles in the court system. The county district attorney prosecutes cases; public defenders offices provide legal defense to many accused offenders; and county probation departments frequently recommend sentencing outcomes to judges based on various factors (such as an offender’s current offense, prior record, criminal sophistication, and the county’s capacity to provide treatment services).
In this chapter, we present information on what criminal cases are prosecuted, the outcomes of those cases, and the related costs to the court system.
- Law enforcement considers a crime to be “cleared” when someone has been arrested, charged for the crime, and turned over for prosecution, regardless of whether that person is ultimately convicted of the crime.
- In 2011, 43 percent of violent crimes (those tracked as part of the Uniform Crime Reporting Program) in California were cleared, while 14 percent of property crimes were cleared. California’s clearance rates are lower than the national average of 48 percent for violent crimes and 19 percent for property crimes.
- Generally, those crimes in which the offender is more likely to be a relative or acquaintance of the victim (such as homicide and aggravated assault) have a higher likelihood of being cleared.
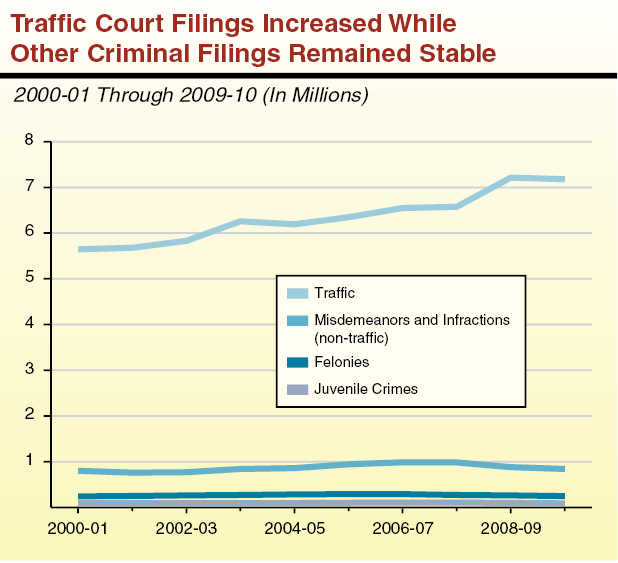
- In 2009-10, there were about 8.4 million filings in California trial courts related to criminal offenses, including traffic, felony, misdemeanor, and juvenile delinquency cases. Roughly 86 percent of these filings were related to traffic cases.
- Over the past decade, traffic filings have increased by 27 percent, growing from about 5.6 million filings to 7.2 million filings.
- In contrast, filings for felonies, misdemeanors, and juvenile delinquency cases have remained fairly stable over the past decade.
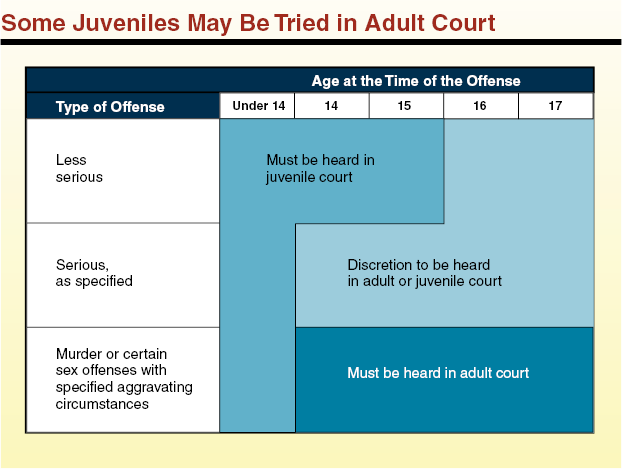
- Under certain circumstances a juvenile can be tried in adult court, rather than in juvenile court. Those specific circumstances were expanded by Proposition 21, passed by voters in 2000. The factors that affect whether a juvenile can or must be tried in adult court are (1) age of the juvenile at the time of the offense and (2) the seriousness of the crime.
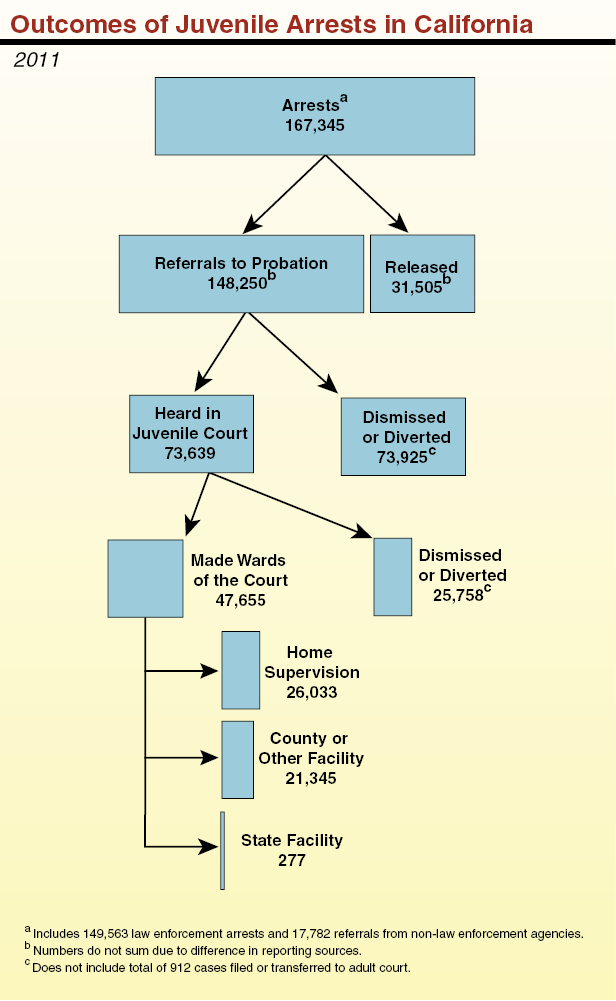
- Judges and district attorneys have discretion to transfer or file many cases in either the adult or juvenile court. In 2011, roughly 74,000 juvenile cases in California were adjudicated in juvenile courts and 548 juvenile cases were adjudicated in adult courts.
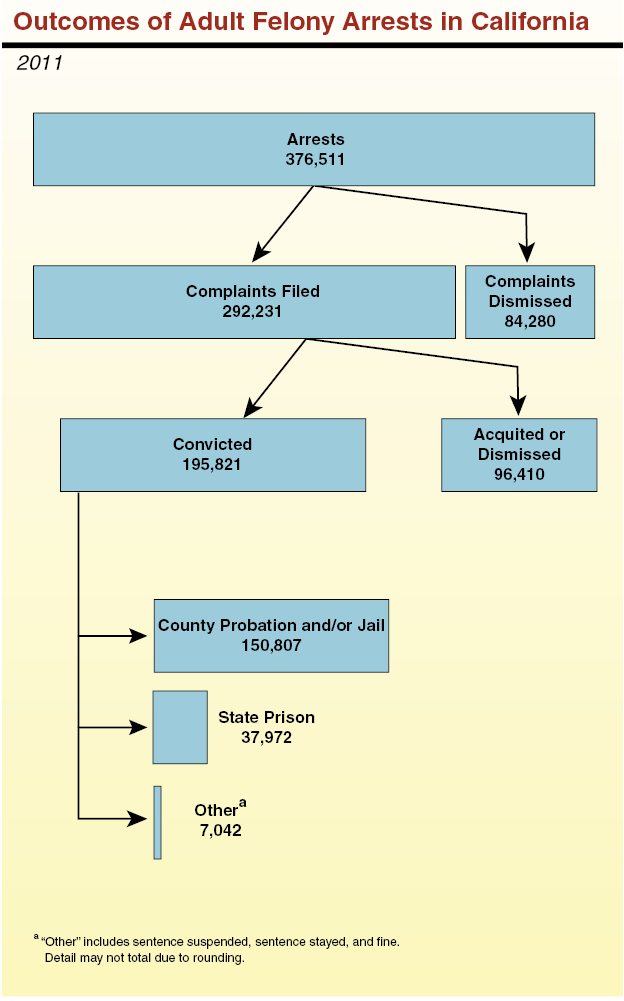
- In 2009-10, almost four-fifths of all felony court cases ended with a defendant pleading guilty prior to trial.
- Only about 3 percent of felony cases were resolved by a trial. Of the cases that went to trial, about 80 percent resulted in a guilty verdict.
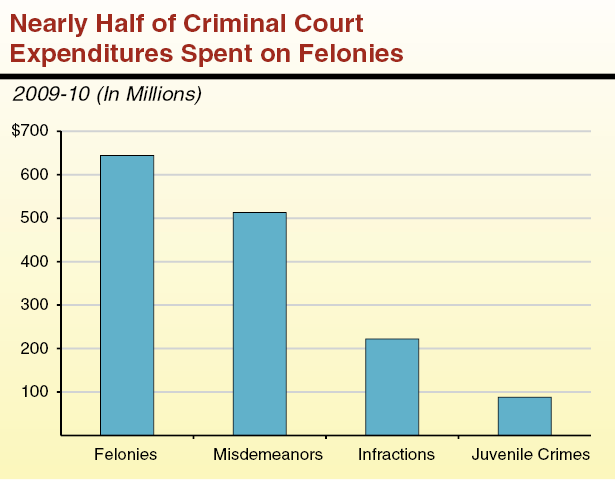
- In 2009-10, state trial courts spent almost $1.5 billion on criminal cases (almost two-fifths of total judicial branch funding), including traffic and juvenile delinquency cases. Nearly half of this amount was spent on felony cases.
- Felony and juvenile delinquency cases average much higher costs than other case types. The average cost was roughly $2,600 for felony cases and $980 for juvenile delinquency cases. In contrast, the average cost per case was estimated to be roughly $380 for a misdemeanor and $35 for an infraction. Actual costs for an individual case can vary significantly depending on various factors (such as the length of the case).
- Traffic cases account for about 95 percent of the costs associated with infraction cases and 63 percent of the costs associated with misdemeanor cases.
Various Fines and Fees Substantially Add to Base Criminal Fines
2012
|
|
Failure to Stop at Stop Signa (Infraction)
|
Driving Under Influence of Alcohol/Drugsa (Misdemeanor)
|
|
Base Fine
|
$35
|
$390
|
|
State Penalty Assessment
|
40
|
390
|
|
County Penalty Assessment
|
28
|
273
|
|
Court Construction Assessment
|
20
|
195
|
|
DNA Assessment
|
20
|
195
|
|
EMS Assessment
|
8
|
78
|
|
EMAT Assessment
|
4
|
4
|
|
State Surcharge
|
7
|
78
|
|
Court Operations Fee
|
40
|
40
|
|
Conviction Assessment Fee
|
35
|
30
|
|
Night Court Fee
|
1
|
1
|
|
Totals
|
$238
|
$1,674
|
- State law requires that various penalty assessments, surcharges, and fees be added to the base fine for infractions, misdemeanors, and other criminal offenses. These fines and fees can greatly increase the total obligation for a criminal offense.
- State law also specifies how each of the various fines and fees are distributed among state and local governments. In general, roughly 40 percent goes to the local government (primarily the county) where the offense occurred, while roughly 60 percent goes to the state to support such activities as trial court operations and construction, victim/witness assistance, and peace officer training.
Chapter 5:
Corrections
The final stage of the criminal justice system is corrections. Although the Legislature and Governor enact laws that define crimes and set penalties, judges exercise some discretion in sentencing adult and juvenile offenders. Misdemeanants and lower-level felons can be sentenced to county jail, probation, fines, or some combination of these. As a result of sentencing law changes enacted in 2011 (referred to as the 2011 realignment), only certain higher-level felons—generally, those with a current or prior conviction for a violent, serious, or sex offense—can be sentenced to one of the state’s 33 prisons managed by CDCR. In addition, many offenders sent to state prison are now supervised by county probation departments rather than state parole upon release. Judges, however, have some sentencing discretion, such as over the length of the prison sentence. Upon full implementation of realignment, state prison and parole populations are projected to decline by tens of thousands of lower-level offenders, who will instead be managed by the counties.
Since 1996, the Legislature has enacted various measures to shift to counties a significant share of responsibility for managing juvenile offenders. Thus, almost all juvenile offenders are managed by counties, with only about 1,200 housed in one of the state’s juvenile facilities managed by CDCR’s Division of Juvenile Justice (DJJ). Interestingly, despite the realignment of juvenile offenders to counties, the actual number of juveniles in county facilities has declined significantly over the past decade.
In this chapter, we provide information on the adult and juvenile correctional populations managed by county and state departments. This includes data on caseload trends, demographics, costs, and outcomes.
Demographics of Adults Sentenced on Felony Charges
2010
|
|
County Jail and/or Probation
|
State Prison
|
California Adult Population
|
|
Totals
|
153,011
|
41,801
|
27,958,916
|
|
Gender
|
|
|
|
|
Male
|
77%
|
90%
|
49%
|
|
Female
|
23
|
10
|
51
|
|
Age
|
|
|
|
|
Under 20
|
11%
|
7%
|
4%
|
|
20-29
|
39
|
37
|
20
|
|
30-39
|
23
|
28
|
18
|
|
40 and older
|
27
|
28
|
58
|
|
Ethnicity
|
|
|
|
|
Black
|
18%
|
26%
|
6%
|
|
Hispanic
|
40
|
42
|
33
|
|
White
|
36
|
28
|
45
|
|
Other
|
6
|
4
|
16
|
- In 2010, males accounted for 90 percent of adult felony offenders sentenced to state prison, and 77 percent of offenders sentenced to county jail, probation, or both.
- Most adults convicted in 2010 were age 20 through 39. Only about 28 percent were older than 40, compared with 58 percent of the total adult population.
- Blacks and Hispanics represented 39 percent of California’s adult population in 2010, but accounted for 68 percent of adults sentenced to state prison and 58 percent of adults sentenced to county jail, probation, or both.
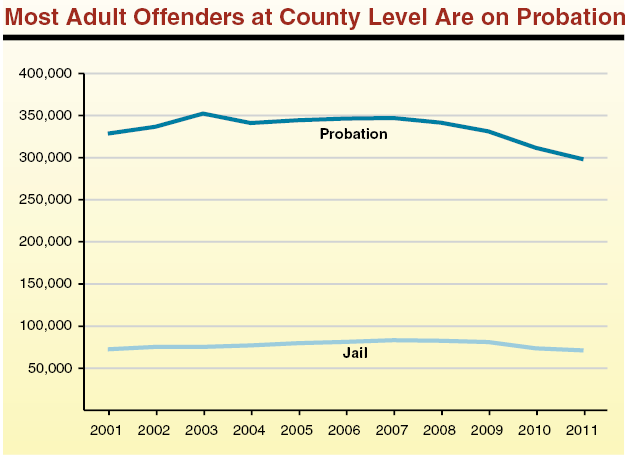
- Between 2001 and 2011, the number of adult probationers has fluctuated between 352,000 in 2003 and 298,000 in 2011. Of the adults on probation in 2011, 83 percent were on probation for a felony and 17 percent for a misdemeanor.
- During the same time period, the jail population in California has been fairly steady. with the average daily jail population ranging from a high of 83,000 in 2007 to a low of 71,000 in 2011. The recent decline is due in part to several counties being subject to court-ordered jail population limits.
- As the 2011 realignment continues to be implemented, the number of offenders sentenced to county jail and county probation likely will increase
significantly.
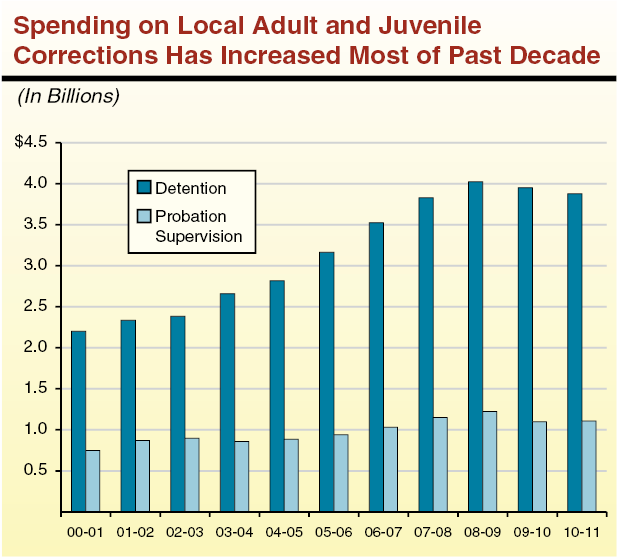
- In 2010-11, California counties spent a total of about $5 billion on adult and juvenile corrections. This included $3.9 billion for detention in jails and juvenile facilities and $1.1 billion for community supervision by probation departments. Total spending increased 69 percent over the past decade (31 percent adjusted for inflation). During this same time period, both adult and juvenile corrections caseloads in California have generally declined.
- Total county spending on adult corrections will likely increase as counties utilize approximately $900 million in redirected state revenues to meet their additional workloads under 2011 realignment. This amount is expected to increase in future years.
In 2011, there were about 71,000 inmates in county jails. About 70 percent of these inmates had not been sentenced by the court. Most unsentenced jail inmates are defendants awaiting trial and who do not post the amount of bail necessary for release.
Between 2001 and 2007, the total jail population grew mostly due to an increase in the number of unsentenced inmates. Unsentenced inmates increased by 27 percent over that period, compared with a 4 percent decline in sentenced inmates.
Between 2007 and 2011, the jail population declined by about 11,800 inmates, including about 6,500 unsentenced inmates and 5,300 sentenced
inmates.
- In 2010—the year before realignment was enacted—most admissions to state prison were for property and drug crimes (58 percent). The most common property crimes included burglary and theft. The most common drug crimes included drug possession and sales.
- In the first year following the enactment of the 2011 realignment, almost half of all admissions to state prison were for violent crimes (47 percent)—a 62 percent increase relative to 2010. Property and drug crimes only made up 37 percent of admissions—a 36 percent decrease. Other crimes, which include arson and possession of a weapon, made up 16 percent of admissions—a 22 percent increase from 2010.
Federal Government Houses More Drug Offenders
2010
|
|
California Inmate Population
|
Federal Inmate Population
|
|
Totals
|
162,976
|
190,641
|
|
Offense Type
|
|
|
|
Violent
|
58%
|
8%
|
|
Property
|
19
|
6
|
|
Drug
|
15
|
51
|
|
Immigration
|
—
|
11
|
|
Other
|
8
|
24
|
- In 2010, about 191,000 inmates were housed in federal prisons throughout the country.
- Because federal criminal law is focused on the federal government’s role in the regulation of interstate commerce, immigration, and the protection of federal facilities and personnel, federal law enforcement tends to focus on nonviolent crimes (such as drug trafficking, immigration violations, fraud, bribery, and extortion).
- Roughly half of all federal inmates are incarcerated for drug offenses.
Demographics of the Prison Population
2012
|
|
Prison Population
|
California Adult Population
|
|
Total Population
|
136,431
|
28,836,817
|
|
Gender
|
|
|
|
Male
|
95%
|
49%
|
|
Female
|
5
|
51
|
|
Ethnicity
|
|
|
|
Black
|
30%
|
6%
|
|
Hispanic
|
41
|
35
|
|
White
|
23
|
42
|
|
Other
|
6
|
18
|
|
Age
|
|
|
|
18-19
|
1%
|
4%
|
|
20-29
|
26
|
20
|
|
30-39
|
29
|
19
|
|
40-49
|
24
|
18
|
|
50-59
|
15
|
17
|
|
60 and Older
|
5
|
22
|
- The vast majority of the state prison population is male. Black and Hispanics comprise 71 percent of inmates. Most prisoners are between 20 and 39 years of age.
- By comparison, the California population has a significantly higher percentage of women, whites, and older individuals than are in prison.
- During the past 20 years, the percentage of inmates who are Hispanic has increased by 27 percent, while the percentage of white and black inmates has decreased. The percentage of inmates who are 50 or older is nearly four times larger than it was 20 years ago. The gender distribution of inmates has remained stable.
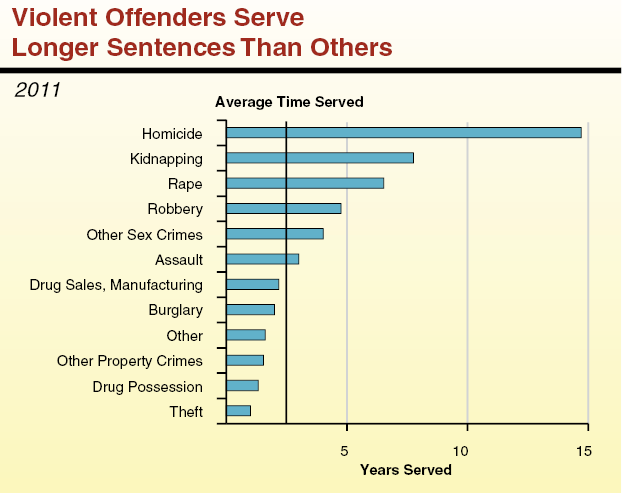
- In 2011, about 48,000 inmates were released from prison after completing their sentence. On average, these inmates were incarcerated for about two and a half years.
- Inmates released for property, drug, or other nonviolent offenses were incarcerated for an average of less than two years. Inmates who committed violent crimes served terms that ranged from an average of 3 years for assault to almost 15 years for homicide (including murder and manslaughter).
- In addition, some offenders are never released, including those serving life terms in prison and those on death row awaiting execution.
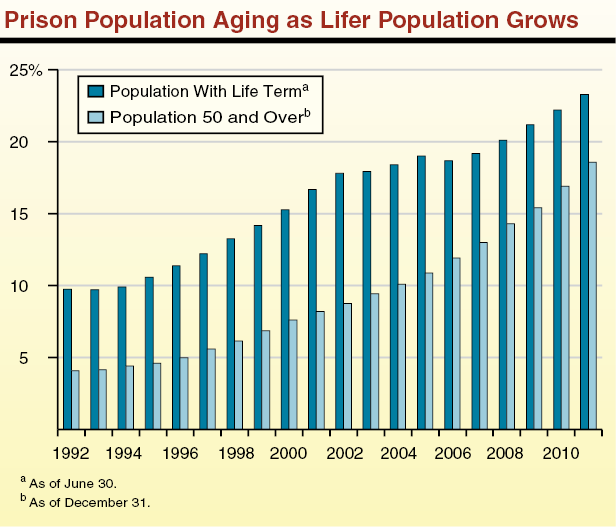
- The number of individuals sentenced to life terms in state prison (including both those with and without the possibility of being released on parole) has increased by 28,000 over the past two decades. About 23 percent of the prison population had a life term in 2011, up from about 10 percent in 1992.
- Over the same time period, the number of inmates age 50 or more has increased by 23,000. About 19 percent of the prison population fell into this age range in 2011, up from about 4 percent in 1992.
- As the 2011 realignment continues to reduce the number inmates with shorter terms, life term and elderly inmates will continue to make up a growing share of the prison population.
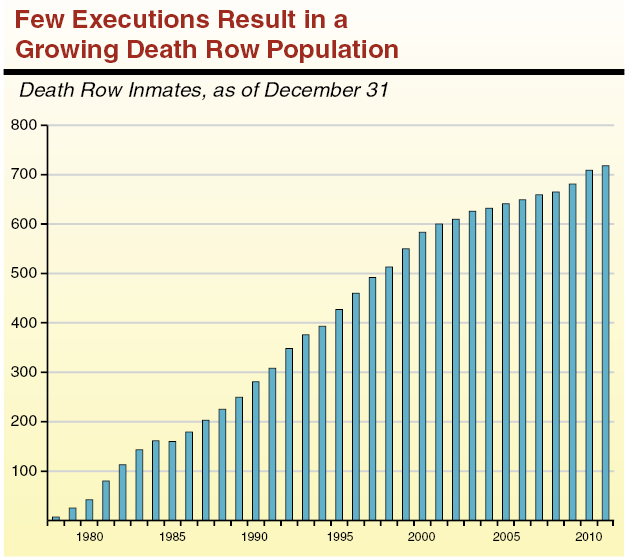
- Since the death penalty was reinstated in California in 1978, the number of inmates on death row increased from 7 to 718 by the end of 2011. Condemned male inmates generally are housed at San Quentin State Prison.
- Since 1978, around 900 individuals have received a death sentence. Of these, 14 were executed, 83 died prior to being executed, and about 75 had their sentences reduced by the courts. No executions have taken place since 2006 because of a court stay on executions.
- Most offenders on death row are involved in legal proceedings that follow a sentence of death, which can take a couple of decades to complete.
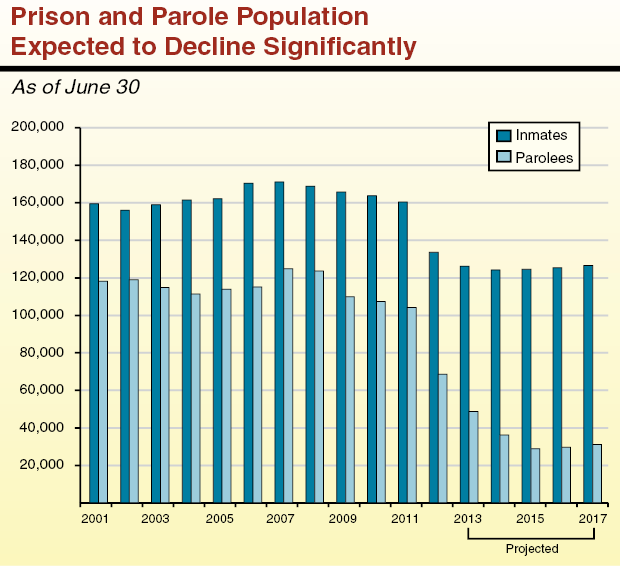
- The prison and parole populations are expected to decline significantly compared to pre-realignment levels in 2010. The prison population is expected to decline by about 38,000 inmates (23 percent). The parole population is expected to decline even more—by about 77,000 parolees (71 percent).
- This decline is primarily attributable to the 2011 realignment legislation which (1) limited prison commitments to felons who have a current or prior conviction for a serious, violent, or sex offense and (2) limited state parole to felons whose current offense is serious or violent.
Annual Costs to Incarcerate an Inmate in Prison
2011-12
|
Type of Expenditure
|
Per Inmate Cost
|
|
Security
|
$24,458
|
|
Inmate Health Care
|
$16,042
|
|
Medical care
|
11,366
|
|
Psychiatric services
|
2,069
|
|
Pharmaceuticals
|
1,551
|
|
Dental care
|
1,057
|
|
Facility Operations and Records
|
$5,077
|
|
Facility operations (maintenance and utilities)
|
2,790
|
|
Classification services
|
1,254
|
|
Maintenance of inmate records
|
770
|
|
Reception, testing, assignment
|
251
|
|
Transportation
|
12
|
|
Administration
|
$2,595
|
|
Inmate Food and Activities
|
$2,761
|
|
Food
|
1,681
|
|
Inmate employment
|
527
|
|
Clothing
|
343
|
|
Inmate activities
|
144
|
|
Religious activities
|
66
|
|
Rehabilitation Programs
|
$926
|
|
Academic education
|
670
|
|
Vocational training
|
174
|
|
Substance abuse programs
|
81
|
|
Miscellaneous
|
$31
|
|
Total
|
$51,889
|
- The primary cost drivers for the state’s prisons are security, such as pay for correctional officers (about 47 percent) and health care (about 31 percent).
- Other states typically pay around $30,000 per year per inmate. The difference is likely due primarily to the relatively high salary received by California’s correctional officers as well as California’s high cost for inmate health care.
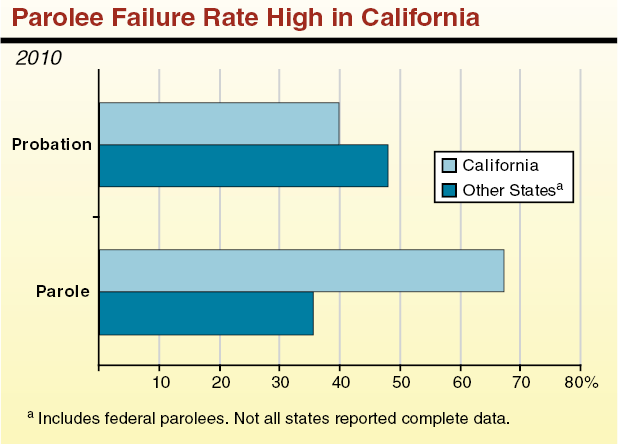
- Courts and supervising agencies typically require offenders placed on county probation or state parole to follow certain conditions, such as routine meetings with their supervising agent, taking drug tests, and following state laws. Failure to comply with these conditions can result in incarceration.
- In 2010, the probation “failure” rate—measured as the percent of the probation population that committed violations resulting in incarceration or absconded from supervision—in California was somewhat lower than in other states. California parolees, on the other hand, failed at a much higher rate than parolees in other states.
- Some differences among states are likely due to factors such as policy differences regarding who goes onto probation and parole, the amount of supervision provided, revocation decisions, and the availability of treatment services.
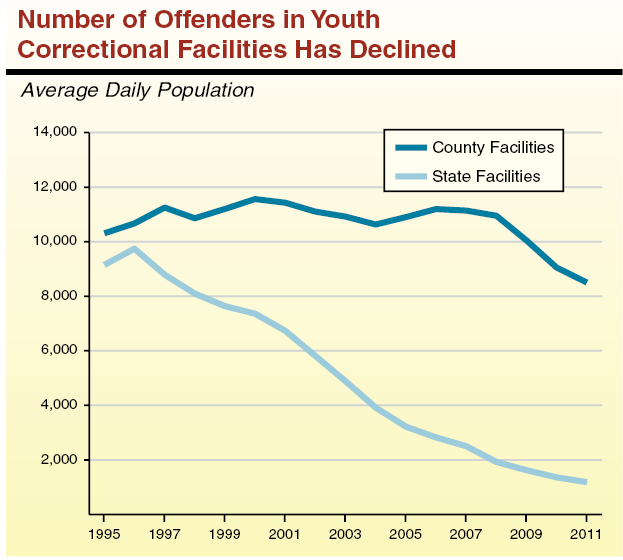
- Since the mid-1990s, the Legislature has made efforts to shift responsibility for most juvenile offenders to the counties. As a result, the number of juvenile offenders in state juvenile facilities has declined sharply in recent years, from about 9,700 in 1996 to less than 1,200 in 2011.
- Despite the shift in key juvenile responsibilities to counties, the number of juveniles in county facilities has also declined, from a recent high of 11,400 in 2001 to about 8,500 in 2011. This is likely due in part to a decrease in juvenile arrests over that period.
Demographics of Adjudicated Juvenile Offenders
2010
|
|
State Division of Juvenile Justice
|
County
|
California Juvenile Population
|
|
Total
|
409
|
54,991
|
9,295,040
|
|
Gender
|
|
|
|
|
Male
|
98%
|
83%
|
51%
|
|
Female
|
2
|
17
|
49
|
|
Ethnicity
|
|
|
|
|
Black
|
27%
|
18%
|
6%
|
|
Hispanic
|
60
|
56
|
50
|
|
White
|
9
|
21
|
30
|
|
Other
|
4
|
5
|
14
|
|
Age
|
|
|
|
|
10-11
|
—
|
1%
|
11%
|
|
12-13
|
3%
|
8
|
11
|
|
14-15
|
30
|
35
|
12
|
|
16-17
|
60
|
53
|
12
|
|
Othera
|
6
|
3
|
—
|
- In 2010, males accounted for about 98 percent of juvenile offenders sent to DJJ and about 83 percent of offenders managed by counties.
- Most juvenile offenders adjudicated in 2010 were age 16 or 17. Younger offenders were slightly more likely to be committed to a county than to DJJ.
- Black and Hispanic juveniles represented 56 percent of California’s under-age-18 population in 2010, but accounted for 87 percent of DJJ and 74 percent of county commitments.
Average Cost Per Offender in Division of Juvenile Justice Facilities
2011-12
|
Type of Expenditure
|
Per Offender Costs
|
|
Treatment programs
|
$61,500
|
|
Security
|
40,000
|
|
Administration
|
28,700
|
|
Health care
|
27,700
|
|
Education
|
21,600
|
|
Support (food, clothing, other)
|
20,200
|
|
Total
|
$199,700
|
- In 2011-12, the state spent about $218 million on its three DJJ facilities, or about $200,000 per offender. In comparison, counties spent about $119,000 per juvenile offender in 2010-11. This difference is likely due in part to the higher costs of treating the more serious offenders in DJJ facilities, including meeting requirements of court orders.
- In 2011-12, 31 percent of DJJ’s costs were spent on treatment programs, while 20 percent was spent on security, 14 percent each on administration and health care, 11 percent on education, and 10 percent on support costs, including food and clothing.
Chapter 6:
Evolution and Future of California’s Criminal Justice System
While the basic stages of the criminal justice system are set, the criminal laws and policies underlying them evolve over time as new problems, priorities, and solutions develop. We conclude this primer by describing the most significant changes in California criminal justice law over the past two decades, as well as describe a few of the major issues likely to face criminal justice policymakers in coming years.
Major Changes in California Criminal Justice Laws
Concern about certain types of crimes, offenders, and law enforcement capabilities has led the Legislature and voters to make some significant changes to specific areas of criminal law. We highlight below the most significant of those changes implemented by voters and elected policymakers over the past 20 years. (A more comprehensive list of policy changes is included in the Appendix.)
“Three Strikes and You’re Out.” In 1994, voters approved Proposition 184, commonly referred to as the “three strikes” law. The most significant aspect of the new law was to require longer prison sentences for certain repeat offenders. Individuals who have one previous serious or violent felony conviction and are convicted of any new felony (not just a serious or violent felony) generally receive a prison sentence that is twice the term otherwise required for the new conviction. These individuals are referred to as “second strikers.” Under proposition 184, individuals who had two or more previous serious or violent felony convictions and were convicted of any new felony were generally sentenced to life imprisonment with the earliest possible parole after 25 years. These individuals are referred to as “third strikers.” In November 2012, voters approved Proposition 36, which modifies the three strikes law by generally limiting such life sentences for third strikers to those cases where the most recent felony conviction is for a serious or violent offense. The change also allows certain third strikers already sentenced to a life term for a nonserious, non-violent offense to be resentenced to a lesser term.
Juvenile Justice Realignment. Over several years, the state has taken different actions to shift—or “realign”—responsibilities for supervising and managing certain juvenile offenders from state to local governments. In 1996, the state implemented a sliding scale fee that required counties to pay a share of the state’s cost to house each ward sent to a state facility, with a higher share of costs paid for lower-level offenders than for higher-level offenders. In 2007, the state limited admission to state juvenile facilities only to those juveniles who are violent, serious, or sex offenders. In 2010, the state shifted responsibility for supervising all offenders released from state juvenile facilities from the state to county probation departments.
Trial Court Realignment. For many years, trial courts were essentially county entities. Counties were primarily responsible for financing the operations of the trial courts, and counties employed nearly all individuals who worked at trial courts. However, in 1997 the state began taking significant steps towards shifting major responsibilities for the trial courts from counties to the state. Specifically, the state (1) shifted primary responsibility for funding trial courts, (2) classified most individuals working in the trial courts as court employees rather than county employees, and (3) transferred ownership and responsibility of court facilities to the state.
Realignment of Lower-Level Adult Offenders. In 2011, the state approved a broad realignment of public safety, health, and human services programs from state to local responsibility. Included in this realignment were sentencing law changes requiring that certain lower-level felons be managed by counties in jails and under community supervision rather than sent to state prison. Generally, only felony offenders who have a current or prior offense for a violent, serious, or sex offense are currently eligible for state prison. In addition, of those felons released from state prison, generally only those with a current violent or serious offense are supervised in the community by state parole agents, with other offenders supervised by county probation departments. Responsibility for housing state parole violators was also shifted from state prisons to county jails.
The Future of California Criminal Justice
Just as criminal justice laws and policies have shifted over the past two decades, they will continue to do so in the coming years as state and local policymakers address new public safety and fiscal challenges. Below, we identify some of the most significant criminal justice issues that policymakers will face in the near future. These are (1) successful implementation of 2011 realignment by counties, (2) the implication of realignment for state prisons, (3) returning control of prison health care from the federal courts to the state, and (4) implementing cost-effective criminal justice practices.
Local Implementation of 2011 Realignment of Lower-Level Offenders
One Goal of Realignment Was a More Cost-Effective Correctional System. As described above, the state enacted several bills in 2011 to realign to county governments the responsibility for managing and supervising certain lower-level offenders. In adopting this realignment, the Legislature had multiple goals, including reducing the prison population to meet a federal court-ordered cap (in a case related to inmate health care that we discuss in more detail below) and to reduce state correctional costs. Another stated goal of realignment was to improve public safety outcomes by keeping lower-level offenders in local communities where treatment services exist and where local criminal justice agencies can coordinate efforts to ensure that offenders get the appropriate combination of incarceration, community supervision, and treatment. The expectation was that counties would be more effective and efficient than the state at managing these offenders and could reduce the high recidivism rates experienced by state parolees.
In order to implement realignment and achieve improved outcomes at the local level, the Legislature shifted tax revenues to counties. Funding for the realignment of lower-level offenders is estimated to be about $900 million in 2012-13, growing in subsequent years. This amount assumes less use of incarceration and greater use of community supervision and treatment programs than had been the case under the state. In addition, the Legislature adopted new policies allowing courts to sentence felons to “split sentences” (combination of jail and community supervision) and authorized county probation officers to use “flash incarceration” (short term jail stays used as sanctions for violations while under community supervision). The Legislature also required each county to create a multi-agency committee to plan for how it would implement realignment.
Challenges to Successful Implementation. While realignment has the potential to improve public safety, this outcome is not guaranteed. Instead, long-term outcomes will vary by county depending on the different challenges faced in each locality, as well as the choices each county makes to address its implementation challenges. One of the key challenges counties face is having sufficient jail capacity to house the additional offenders. More than half of California counties currently have either court or self-imposed jail population caps. In addition, county jails have historically been designed to house shorter-term offenders, generally those awaiting trial or who have been sentenced to less than a year. Under realignment, county jails are expected to house offenders for longer periods, which means that jails will have a greater need for facilities to provide longer-term medical and mental health care treatment, as well as longer-term rehabilitation programs (such as education and substance abuse treatment). In 2012, the Legislature approved $500 million in new bond funding to support the construction and renovation of county jail facilities.
In addition to pressures on jail capacity, counties face operational challenges. In particular, counties must determine the most effective and cost-efficient ways to supervise and manage the new offenders in their communities with the goal of having lower reoffending rates than what occurred under CDCR. Prior to realignment, about half of the inmates who had no current or prior serious or violent offense returned to prison within one year. To improve upon these failure rates, counties will likely have to increase their hiring and training of peace officer and treatment staff. Many counties also plan to increase the provision of jail and community-based rehabilitation programs, but such a plan is dependent on county agencies and community-service providers being able to increase their capacities. This could be particularly challenging in more rural, less populated areas that tend to have fewer such services available. In addition, in many counties these efforts will require increased and improved coordination between law enforcement agencies and the county agencies and private and nonprofit groups that have the experience in providing the desired services.
Determining if the Public Safety Goal Is Achieved. One of the most important questions following the implementation of the 2011 realignment is how we will know if it was a success. Assessing the impact of realignment on public safety is inherently difficult. For example, tracking each county’s crime rates going forward can be a useful indicator, but one cannot simply associate any increase or decrease in crime to realignment. This is because there are many other factors that can affect crime rates. In addition, if a county’s recidivism rate for realigned offenders is high, one of the challenges will be to determine whether those failures are because of inherent problems in the realignment policy or because of poor implementation practices in the county. These inherent challenges in evaluating realignment are exacerbated by the fact that the law enforcement agencies in many counties do not have modern, integrated caseload management systems that make it easy to track the outcomes of individual offenders affected by realignment.
Despite these challenges, evaluating the impacts of realignment should be a priority for both state and local policymakers. In particular, local policymakers are going to want to know how effectively their county is managing its realigned population, as well as their traditional corrections populations because of the effects on public safety, jail overcrowding, and costs. In assessing their success, many county officials will want to compare their success rates to both CDCR’s historic rates and to those of other counties. To make these assessments effectively, counties will need to ensure they are measuring populations and outcomes similarly. For example, recidivism can be measured in many different ways, and it can make a big difference whether it is measured as the rate of rearrest or reconviction, whether it is for new felony offenses or any offense, and whether it is measured as a rate to reoffend within one year or three years of release. Thus, one key issue for the coming years is how to ensure that counties are collecting and reporting outcomes so that local policymakers have adequate information to hold their agencies accountable. In addition, state policymakers may want to further clarify the role of the Board of State and Community Corrections (a newly created board with a mission to provide technical support to local corrections agencies), including steps to ensure that useful county data is collected consistently across counties.
The Challenges and Opportunities of Realignment for CDCR
Realignment Is Significantly Changing the Prison and Parole Population. The shift of lower-level offenders and parolees from the state to counties has resulted in a major decline in the state’s prison and parole populations. Within a few years, realignment is expected to reduce CDCR’s prison population by 34,000 inmates and the parole population by 46,000 parolees compared to what those populations would have been in the absence of realignment. The removal of generally less serious and violent offenders from the prison and parole populations is expected to affect certain subpopulations disproportionately. In particular, low-security, fire camp-eligible, female, and younger inmates will shrink as a proportion of the prison population.
Realignment Has Created Challenges and Opportunities for CDCR. As we discussed in our report,
The 2012-13 Budget: Refocusing CDCR After the 2011 Realignment (February 2012), the reduction in the inmate and parole populations have had various implications for how CDCR manages its prison and parole systems. For example, immediately following the implementation of realignment, CDCR’s population projections suggested they would continue to have a significant shortfall in high-security housing, while having an oversupply of low-security beds. In addition, CDCR is expected to have difficulty fully operating its fire camp program, which could both increase the state’s cost to fight fires and result in the state not making full use of one of its most cost-effective housing options. Moreover, the remaining prison population will tend to have a greater share of elderly inmates with greater health care needs.
While posing challenges, realignment has also created opportunities for CDCR and the state. The reduction in the inmate and parole populations will enable CDCR to better meet the needs of its remaining inmates and parolees in various ways. For example, CDCR will have more space and resources (on a per inmate basis) to dedicate to offender rehabilitation and health care programs following realignment as the reduction in inmate overcrowding will increase access to these programs. Moreover, realignment will create significant budgetary savings for the state, by allowing the state to avoid about $1.5 billion in operational costs upon full implementation. (After accounting for the revenue provided to counties, the state’s net operational savings will be around $300 million annually.) In addition, realignment will allow the state to scale back previously planned prison construction projects by $4.1 billion.
CDCR’s Plan to Address Challenges and Opportunities. In 2012, the department released its plan (commonly referred to as the “blueprint”) to reorganize various aspects of its operations and facilities in response to the 2011 realignment, as well as to meet various federal court requirements. For example, it proposed changes to the inmate classification and gang management regulations that will reduce the need for high-security housing. In addition, the blueprint capitalized on some of the opportunities presented by realignment as it proposed to increase the percentage of inmates and parolees who will have access to rehabilitation programming, as well as expanded the type of programs available to include those not previously offered by the department (such as cognitive behavioral therapy). The plan also outlined how CDCR would achieve its operational savings over the next several years (including by closing one prison). The aspects of the blueprint requiring legislation had been approved by the Legislature as part of the 2012-13 budget package.
While the plan had significant strengths, it also had some drawbacks. For example, it proposed various prison expansion and healthcare construction projects that our prior analysis showed to be unnecessary and expensive. In addition, the plan called for returning thousands of inmates housed in out-of-state contract facilities to the state’s prisons. This aspect of the plan makes complying with a federal court ordered limit on the in-state prison population difficult because these out-of-state prisoners are not currently counted toward the limit. There were also challenges the plan did not fully address, such as the declining fire camp-eligible population. (For more detailed information regarding these issues, please see our report,
State Should Consider Less Costly Alternatives to the CDCR Blueprint [May 2012].)
Legislature Has Significant Role to Play in Future Years. While the blueprint provides CDCR with a plan for moving forward after realignment, there are still issues that the Legislature may want to address. To begin with, the Legislature could carry out oversight of the department to ensure it successfully implements the plans the Legislature approved. For example, the Legislature may want to hold oversight hearings on the reports that will be produced by the Office of the Inspector General which assess the department’s implementation of the blueprint. The Legislature may also want to help the department address some of the challenges left unsolved by the plan. For example, the Legislature could change statute to increase the number of inmates that participate in the fire camp program. In addition, should the prison population reduction be insufficient to meet the federal court ordered population limit, the Legislature could consider further reducing the prison crowding rate in a safe and cost-effective manner. For example, the Legislature could consider further sentencing changes or greater use of out-of-state contract facilities. Finally, the Legislature may also want to reevaluate certain aspects of the blueprint in the future. For example, should the state continue to face tight fiscal times, the Legislature may want to reconsider some of the costly construction projects contained in the blueprint that will drive significant state spending in future years.
Returning Control of Inmate Health Care to the State
Court Oversight of Inmate Health Care. The CDCR operates three main types of health care programs for inmates: medical, mental health, and dental care. In 2006, after finding that the state had failed to provide a constitutional level of medical care to inmates, a federal court appointed a Receiver to take over the direct management and operation of the state’s inmate medical care program from CDCR. Specifically, the court found, among other problems, that CDCR’s medical care program was poorly managed; provided inadequate access to care for sick inmates; had deteriorating facilities and disorganized medical record systems; and lacked sufficient qualified physicians, nurses, and administrators to deliver medical services. The Receiver’s mandate is to bring the department’s inmate medical care program into compliance with federal constitutional standards. To that end, the Receiver’s authority includes hiring and firing medical staff, entering into contracts with community providers, and acquiring and disposing of property (including new information technology systems).
In addition, the state’s inmate mental health program has been overseen by a special master since 1995 after a federal court found that the quality of the state’s program was unconstitutional. Specifically, the court found, among other problems, that CDCR’s mental health program was understaffed, lacked adequate screening processes for mental illnesses, did not provide timely access to care, and had deficiencies in medication management. Special masters are similar to receivers in that they are appointed by a federal court to monitor and oversee remedial efforts to bring an organization into constitutional compliance. Unlike receivers, however, special masters lack executive authority and must rely on courts to order changes when they discover noncompliance with court orders.
State Has Made Progress Toward Resuming Control of Inmate Health Care. In January 2012, the federal court found that while some improvements to the inmate medical program are still needed, substantial progress had been made towards achieving a constitutional level of medical care for prison inmates. For example, the Receiver has hired more staff in key health care positions (such as physicians and nurses), as well as established new policies related to emergency medical response, primary and chronic care delivery, and inmate medical screening. In addition, recent audits have demonstrated that most prisons have improved their levels of compliance with the Receiver’s medical policies and procedures and community standards of care. On average, the state’s 33 prisons improved their rates of adherence by 8 percentage points, from 72 percent to 80 percent adherence, between their first and second rounds of audits.
In a 2012 court order, the federal court stipulated that the transition from the receivership back to state control will begin when the administration can demonstrate both (1) the ability to maintain an inmate medical care system that provides care as good as or better than that being delivered under the Receiver and (2) that any outstanding construction or information technology projects initiated by the Receiver would not be jeopardized. Likewise, the federal court overseeing inmate mental health care recently expressed satisfaction with progress made to date by the department towards a constitutional level of mental health care.
Sustaining a Constitutional Level of Care. After CDCR is able to restore its control over inmate health care, its major challenge will be sustaining a constitutional level of care into the future. As we noted in our report,
Providing Constitutional and Cost-Effective Inmate Medical Care (April 2012), the state will need to focus on two keys to sustaining a constitutional inmate medical care program: (1) creating independent oversight of the program, and (2) controlling the significant increases in inmate medical costs that have occurred since the creation of the receivership. Returning control of the inmate medical program to CDCR without first establishing effective oversight mechanisms could result in a failure of the state to recognize if the department begins to backslide on recent improvements in the quality of inmate medical care. In the above report, we recommend that the Legislature establish an independent board responsible for periodically evaluating the quality of inmate medical care, as well as providing budget and policy direction for the inmate medical program.
Controlling inmate medical care expenditures will also be critical to ensuring the sustainability of a constitutional inmate medical program. This is because inmate medical expenditures have increased dramatically in recent years. In 2011-12, California spent about $13,000 annually per inmate for medical care (including pharmaceuticals), which was significantly more than all other states. Given the pressure these costs put on the state’s General Fund, along with the state’s ongoing fiscal struggles, it is important that the inmate medical program be operated as efficiently as possible. Operating a more efficient inmate medical system will make it more sustainable in the long run and less susceptible to budget cuts that could reduce the ability of the department to deliver services to inmates effectively.
It is likely that the state will face similar challenges as it seeks to end court oversight over the inmate mental health program. The state may want to consider establishing and monitoring certain performance metrics (such as the percentage of inmates receiving necessary care within specified time frames) to ensure that the quality of mental health care does not decline in the absence of court oversight. In addition, the state should closely monitor inmate mental health care costs to ensure that care is being delivered as efficiently as possible.
Implementing Cost-Effective Criminal Justice Practices
Current Fiscal Climate Raises Concerns About Funding Public Safety. The recession that began in 2008 has resulted in budget cuts to many state and local programs, including criminal justice programs. These reductions raise reasonable concerns from the public that there could be negative consequences for public safety, particularly to the extent that they result in less police protection, fewer dangerous offenders being incarcerated, lower levels of community supervision of probationers and parolees, and reduced access to rehabilitation and treatment programs that could otherwise reduce recidivism for adult and juvenile offenders.
Various Criminal Justice Strategies Can Reduce Costs and Improve Public Safety. Research from around the nation demonstrates that various criminal justice strategies—including law enforcement, judicial, and correctional programs—can reduce crime and reoffending. In so doing, many of these approaches can reduce downstream criminal justice costs. In fact, various strategies have been found to be cost-efficient, generating more in benefits (in the forms of reduced costs to victims and government agencies) than they cost to implement. For example, research finds that adult and juvenile drug courts on average yield more than $10,000 in benefits than they cost to implement on a per offender basis. Other strategies, such as “scared straight” programs and intensive community supervision without treatment programs generally fail to reduce rates of reoffending and, therefore, are not cost-effective to implement.
So, while budget reductions can be implemented simply through reductions in personnel and programs, fiscal pressures also have the potential to propel state and local agencies to seek smarter ways to invest limited criminal justice dollars in the most cost-effective strategies. Such “smart on crime” strategies have been implemented in recent years throughout the country. For example, in 2007, Texas implemented legislation to expand the availability of pre-trial, in-prison, and post-release programs by thousands of slots, including for substance abuse treatment, drug courts, mental health services, and intermediate sanction facilities. The goal of this legislation was to reduce the state’s prison population. On net, this program expansion was a few hundred million dollars less than the state’s prior plan that relied principally on new prison construction. In addition, the state reports that its revocation rate for felons fell by 8 percent between 2007 and 2010, and its prison population was reduced by more than 8,000 inmates compared to its projections made prior to implementing its 2007 plan.
Keys to Implementing Cost-Effective Criminal Justice Practices. We note, however, that developing cost-effective criminal justice programs at the state and local level can be challenging. Some of the keys to implementing successful programs are:
- Up-front Investment. Ironically, one of the main challenges to developing cost-effective practices is costs. Implementing new programs—even those that are cost-effective over the long-term—often requires up-front investment. Thus, state and local governments often must find creative ways to invest in new programs. One example of a creative approach to investing in new strategies relates to a law passed by the Legislature in 2009 which required that a share of any prison savings achieved from reduced probation failures had to be reinvested in the adult probation system. One of the keys to this project working was the one-time provision of federal grant money to counties to begin implementing evidence-based supervision and treatment strategies.
- Aligning Incentives. It is also important to ensure that costs and benefits are linked in ways that provide inherent fiscal incentives for agencies to operate successful programs. This means that governments should experience the fiscal benefits when they effectively operate criminal justice programs, and that the costs of program failures should be borne largely at the government entity that failed to implement successful strategies. In California, structuring these incentives properly is challenging. A variety of state and local agencies have some responsibility for prevention, intervention, and corrections programs, including county jail, probation, health and social services agencies, school districts, and CDCR. Each entity, however, does not necessarily realize the fiscal benefits of its efforts. For example, a successful gang prevention program operated by a school district could, on net, be cost-effective—yielding correctional savings for the county or state—but the program might be a net cost to the district and, therefore, go unimplemented.
- Risk and Needs Assessments. In addition to identifying successful programs and ensuring sufficient funding, there are several other important details that can be the difference between a program being successful or not. One such detail is the use of risk and needs assessments. Agencies use these assessments to determine how high or low of a risk someone is to reoffend and what problems contribute to their offending (such as addiction, antisocial attitudes, and mental illness). This in turn helps ensure that offenders who can benefit from rehabilitation programs are placed in the right types of programs based on their particular needs, and that limited program capacity is targeted to those offenders who are higher risk to reoffend and have higher need for services. Doing so achieves greater net benefits compared to targeting offenders at low risk to reoffend even in the absence of treatment programs, thereby generating greater “bang for the buck.”
- Combination of Supervision and Treatment. Research also finds that the most effective strategies are ones that combine supervision and treatment strategies rather than relying on just one of these approaches. This is generally thought to be the case because supervision alone will not address the underlying problems that may be contributing to an offender’s criminal activity. At the same time, successful participation and completion of programs is enhanced by supervision, particularly if there are consequences for failing to participate in treatment programs mandated by the court.
- Outcome Evaluations. Another key to successful implementation of cost-effective programs is outcome evaluation. Outcome evaluations allow agencies to ensure that the programs are achieving their stated goals (such as reduced recidivism, fewer failed drug tests, or higher rates of employment). Currently, the availability of such outcome data varies by program and county. State and local policymakers typically do not have comprehensive and reliable data measuring the outcomes of their efforts to rehabilitate offenders. This is due in part to a lack of coordination between state correctional agencies, county probation departments, and law enforcement. Because most county agencies operate independently and manage their own data, it is difficult to compile comprehensive information for each offender.
- Fidelity Assessments. Fidelity assessments, which measure the degree to which programs are provided in ways consistent with best practices for that type of program, allow agencies to determine whether different aspects of the program are implemented appropriately. This could include whether the program hires appropriately qualified staff and provides adequate training, whether the duration and intensity of the program curriculum is sufficient, and whether the offenders with the right characteristics—based on factors such as risk, need, and motivation—are placed in the program. Fidelity assessments can be instrumental in informing program managers and funders about shortcomings in the implementation of programs. When both outcome and fidelity evaluations are used, policymakers can make informed decisions about which programs should be continued, expanded, modified, or eliminated.
Appendix
Major Changes in California Criminal Justice Laws
1992 Through 2012
|
Year
|
Measure/Law
|
Major Provisions
|
|
1994
|
Proposition 184: Three Strikes Law
|
- Doubled the normal prison sentence for any new felony conviction with one prior serious and/or violent felony conviction.
- Implemented life sentence in prison for any new felony conviction with two prior serious and/or violent felony convictions.
|
|
1996
|
SB 681: Juvenile Justice Sliding Scale Fee
|
- Implemented sliding scale fee to require counties to pay share of costs to house juvenile offenders in state facilities.
|
|
1997
|
AB 233: Trial Court Realignment
|
- Shifted responsibility for funding trial courts from the counties to the state.
|
|
2000
|
Proposition 21: Juvenile Crime
|
- Expanded types of crimes for which juveniles can and must be tried in adult court.
|
|
2000
|
Proposition 36: Drug Prevention
|
- Required certain offenders convicted of non-violent drug possession offenses to complete drug treatment in lieu of incarceration.
|
|
2004
|
Proposition 69: DNA Samples
|
- Required DNA samples to be collected from all convicted felons and certain arrestees for inclusion in the state’s DNA database.a
|
|
2006
|
Proposition 183: Jessica’s Law
|
- Increased penalties for certain sex offenses, required GPS monitoring of felony sex offenders for life, and restricted where sex offenders can live.a
- Expanded definition of who can be committed to state mental hospital as a sexually violent predator.
|
|
2007
|
SB 81: Juvenile Justice Realignment
|
- Limited admission to state juvenile justice facilities to offenders adjudicated of serious, violent, and sex offenses.
|
|
2008
|
Proposition 9: Marsy’s Law
|
- Expanded constitutional rights of victims to be notified and participate in public criminal proceedings.
- Reduced rights of parolees subject to revocation hearings and lengthened time between parole hearings for indeterminately sentenced inmates.a
|
|
2009
|
SB 678: Community Corrections Incentives
|
- Provided share of state prison savings to counties that reduced rate of probation failures sent to state prison.
|
|
2011
|
AB 109: Realignment of Lower-Level Offenders
|
- Shifted from state to counties the responsibility to: (1) house and supervise all offenders with no current or prior convictions for serious, violent, or sex offenses; (2) supervise offenders released from prison who do not have a current serious or violent offense; and (3) house revoked parolees.
|
|
2012
|
Proposition 36: Changes to Three Strikes Law
|
- Limited life sentences under three strikes law to new convictions for serious and/or violent felonies.
|
|
|
Related LAO Publications
Courts
The 2012-13 Budget: Managing Ongoing Reductions to the Judicial Branch (April 2013)
Completing the Goals of Trial Court Realignment (September 2011)
Juvenile Justice
The 2012-13 Budget: Completing Juvenile Justice Realignment (February 2012)
Local Adult Corrections and Realignment
The 2012-13 Budget: The 2011 Realignment of Adult Offenders—An Update (February 2012)
2011 Realignment: Addressing Issues to Promote Its Long-Term Success (August 2011)
Achieving Better Outcomes for Adult Probation (May 2009)
2009-10 Budget Analysis Series: Criminal Justice Realignment
(January 2009)
“Realignment of Parole Could Improve Public Safety and Help Address Budget Shortfall,” The 2008-09 Budget: Perspectives and Issues (February 2008)
Prisons and Parole
The 2012-13 Budget: State Should Consider Less Costly Alternatives to CDCR Blueprint (May 2012)
Providing Constitutional and Cost-Effective Inmate Medical Care (April 2012)
The 2012-13 Budget: Refocusing CDCR After the 2011 Realignment (February 2012)
A Status Report: Reducing Prison Overcrowding in California
(August 2011)
Reforming Inmate Education to Improve Public Safety: From Cellblocks to Classrooms (February 2008)
“Enhancing Public Safety by Increasing Parolee Employment,” Analysis of the 2007-08 Budget Bill
(February, 2007)
Legislative Analyst’s Office
www.lao.ca.gov
(916) 445-4656
Criminal Justice Staff
Anthony Simbol, Deputy Legislative Analyst
Brian Brown, Managing Principal Analyst
Aaron Edwards, Fiscal and Policy Analyst
- Inmate health care
- Inmate rehabilitation programs
Anita Lee, Fiscal and Policy Analyst
- Courts
- Fines, fees, and penalties
Drew Soderborg, Senior Fiscal and Policy Analyst
- Sentencing
- State prisons and parole
Tor Tarantola, Fiscal and Policy Analyst
- Juvenile justice
- Local law enforcement and corrections
Return to LAO Home Page