Michael Alferes

January 6, 2026
Assessing a Shift to
Enrollment‑Based School Funding
- Introduction
- California Education Finance
- Attendance Requirements
- How Other States Fund Schools
- Research on Student Attendance
- History of Funding Excused Absences in California
- Trends in Student Attendance
- LAO Assessment
- Recommendations
- Issues to Consider if Adopting Enrollment‑Based Funding
- Conclusion
Executive Summary
Chapter 442 of 2024 (SB 98, Portantino) requires our office to report on the effects of changing the student count methodology of the Local Control Funding Formula (LCFF) and other K‑12 education programs from average daily attendance (ADA) to student enrollment. In this report, we provide our assessment of such a shift, describe a few policy alternatives that maintain the ADA‑based system, and identify key issues for the Legislature to consider if switching to enrollment‑based funding.
Background
Most Funding to Schools Is Allocated Based on Attendance. More than 90 percent of state funding to schools is provided through three main sources—LCFF, special education, and the Expanded Learning Opportunities Program (ELOP). Funding for these programs is allocated primarily based on ADA—the average number of students attending school each day throughout the school year. LCFF provides a base amount per ADA, with additional funding based on a school district’s unduplicated pupil percentage (UPP)—the proportion of their students who are low income, English learners, or foster youth. As a result, although high UPP districts have lower attendance rates on average compared to low UPP districts, their overall LCFF allocations per student are higher.
Attendance Rates Currently Below Pre‑Pandemic Levels. The available research shows that attendance is a strong predictor of student achievement, including test scores, reading proficiency, and graduation rates. The statewide attendance rate for school districts and charter schools was relatively stable prior to 2019‑20, averaging 95.7 percent. The statewide attendance rate decreased sharply during the pandemic, to a low of 90.6 percent in 2021‑22. Since then, attendance rates have continued to rebound but remain about 2 percentage points below pre‑pandemic levels.
Assessment
Shifting to an Enrollment Student Count Methodology Would Increase Program Costs by Over $6 Billion Annually. We estimate using enrollment for LCFF would increase annual costs by $5.7 billion, while shifting three other ongoing programs would increase costs by about $800 million. The largest increases would go to higher UPP districts, since they have lower attendance rates on average and receive more funding per student.
Switching to Enrollment‑Based Funding Likely Would Have Adverse Effects on Attendance. We find that shifting to an enrollment‑based student count would likely result in lower attendance rates over the long run. Our assessment is informed by three factors: (1) the ADA‑based funding model creates a fiscal incentive for districts to prioritize actions that support increased attendance; (2) statewide attendance rates improved after the state changed its ADA model in the late 1990s to more closely link funding to student attendance; and (3) under the current model, districts have taken recent actions to support attendance. We do not expect districts would stop conducting all activities to promote attendance or immediately reduce programs under enrollment‑based funding. Over time, however, they may not prioritize these initiatives to the same degree as they did under ADA‑based funding, particularly when faced with limited resources.
Enrollment‑Based Funding Would Be More Aligned With District Planning, Unlikely to Significantly Change Ongoing Administrative Workload. Enrollment‑based funding would be more aligned with current budget planning because districts typically use enrollment projections—not daily attendance—to allocate base funding across their schools. Shifting to an enrollment‑based student count could result in some modest one‑time costs for schools and the state to update existing systems, but would not significantly change ongoing administrative workload. This is because school districts already track both daily attendance and enrollment throughout the school year for various purposes.
State Could Target Additional Funding to High UPP Districts While Maintaining ADA‑Based System. We identified alternative modifications to LCFF that would target funding to high UPP districts while maintaining the current ADA‑based system. Compared to enrollment‑based funding, two of these alternatives provide larger average increases to higher UPP districts, although a larger proportion of the increase would be provided through restricted funds rather than through base funding.
Recommendation
Recommend Continuing With ADA‑Based Funding. Given attendance rates continue to remain below pre‑pandemic levels and the available research suggesting a strong relationship between attendance and student outcomes, we recommend the Legislature maintain its ADA‑based approach to help promote attendance. One concern with an ADA‑based system is that high UPP districts are negatively affected because they tend to serve student groups that historically have had higher absence rates. However, as mentioned above, high UPP districts receive additional LCFF funding that more than offsets the average effect of lower attendance rates. Further, if the Legislature is interested in providing funding increases that would disproportionally benefit districts with higher UPP levels, it could do so by making changes to other aspects of the LCFF funding model while also maintaining the existing attendance‑based student count.
Issues to Consider if Adopting Enrollment‑Based Funding
Although we do not recommend shifting to enrollment‑based funding, we describe several implementation issues the Legislature may want to consider if it were to shift to an enrollment‑based student count. These issues include:
- Using Enrollment Averaged Across the School Year. If the state switches to an enrollment‑based student count, we recommend it use enrollment averaged across the school year. In particular, this approach would be helpful for local education agencies that experience significant fluctuations in enrollment throughout the school year.
- Statutory Adjustment Could Avoid Any Unintended Reduction in Proposition 98 Guarantee. Proposition 98, a constitutional amendment approved by California voters in 1988, establishes a minimum annual funding requirement for schools and community colleges, commonly known as the minimum guarantee. The State Constitution requires that, in some years, changes in attendance be used to determine the minimum guarantee. Using enrollment instead of attendance to determine the guarantee would likely require voter approval. Also, switching to an enrollment student count for state program funding could indirectly reduce the guarantee in some years if the switch reduced student attendance. However, we find that significant impacts would be unlikely. If a reduction in the guarantee were a concern, one option is to adopt legislation requiring the state to offset any reduction with a supplemental appropriation.
Introduction
Most Funding to Schools Is Allocated Based on Attendance. Proposition 98 (1988) requires the state to annually set aside a minimum amount of General Fund and local property tax revenue for public schools and community colleges. Whereas Proposition 98 establishes a minimum funding level, the Legislature decides how to allocate this funding among school and community college programs. About 80 percent of Proposition 98 funding to schools is provided through the Local Control Funding Formula (LCFF). The state allocates LCFF to school districts and charter schools based on their average daily attendance (ADA)—the average number of students in school each day throughout school year—with additional funding for certain student characteristics. County offices of education (COEs), which primarily serve nontraditional high school students, have a somewhat more complex LCFF formula, but also receive a portion of their funding based on attendance and their student demographic characteristics. ADA is also used to allocate funding for many other categorical programs, including the two largest ongoing programs: special education and a program that provides funding for before/after and summer school programs.
State Law Requires Report on the Effects of Switching to Enrollment‑Based Funding. Chapter 442 of 2024 (SB 98, Portantino) requires our office to report to the Legislature, on or before January 1, 2026, on the effects of changing the student count methodology of LCFF and other K‑12 education programs from ADA to student enrollment. Specifically, the report is required to provide:
- A description of the legislative history on Chapter 855 of 1997 (SB 727, Rosenthal), which eliminated funding to schools for excused absences, and an assessment of the effects of the change on student attendance.
- A review of student count methodologies in other states.
- A review of the research on evidence‑based approaches to improve student attendance, and the extent to which a state’s method of funding affects attendance rates.
- An assessment of the fiscal, programmatic, and administrative impacts of changing the student count methodology of LCFF from being attendance‑based to enrollment‑based.
- The identification and assessment of alternative changes to LCFF that would provide similar levels of funding compared with a switch to enrollment‑based funding for local education agencies (LEAs) serving a higher percentage of English learners, low‑income students, and foster youth.
- A description of options for phasing in the cost of implementing policy changes over a multiyear period.
- An assessment of the impact of shifting to enrollment‑based funding on the Proposition 98 guarantee, as well as whether the state should continue using ADA for the Proposition 98 funding calculation or other K‑12 programs.
California Education Finance
In this section, we provide an overview of the Proposition 98 minimum guarantee, describe the components of LCFF, and describe the state’s recent change to attendance‑based funding.
Proposition 98 Minimum Guarantee
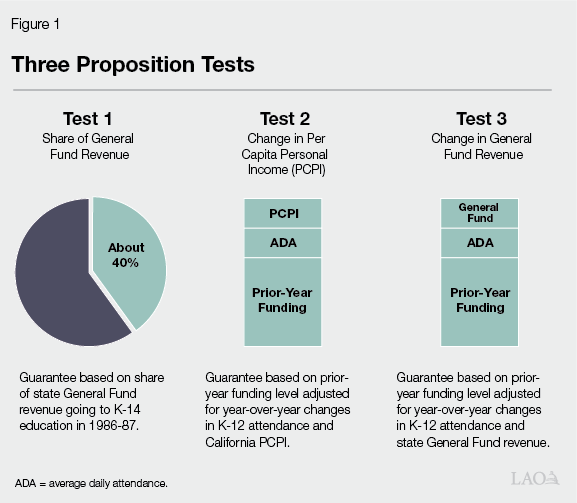
K‑12 Student Attendance Can Affect the Calculation of the Proposition 98 Minimum Guarantee. State budgeting for schools and community colleges is governed largely by Proposition 98, a constitutional amendment approved by California voters in 1988. The measure establishes a minimum annual funding requirement, commonly known as the minimum guarantee. Each year, the minimum guarantee is determined by one of three formulas (or “tests”) set forth in the State Constitution (see Figure 1). In recent years, the guarantee has most commonly been determined by Test 1, which provides about 40 percent of General Fund revenue to schools and community colleges. When the guarantee is determined by Test 2 or Test 3, the minimum guarantee equals the amount of funding provided the previous year, adjusted for changes in ADA and a growth factor tied to per capita personal income (Test 2) or per capita General Fund revenue (Test 3). For purposes of Proposition 98, ADA consists of the average number of students attending each day of the school year across all school districts, charter schools, and COEs in the state. For example, if an average of 1,000 students attend a given school district each day of the school year, that district would contribute 1,000 ADA to the statewide total.
Local Control Funding Formula
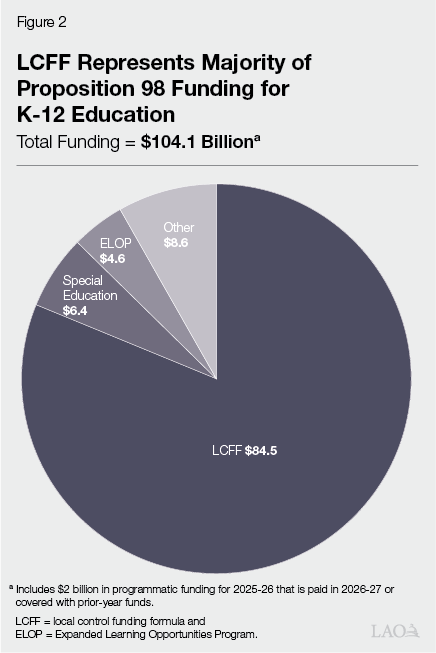
Most K‑12 Proposition 98 Funding Is Allocated Through LCFF. LCFF is the primary source of funding for school districts, charter schools, and COEs—collectively referred to as LEAs. As Figure 2 shows, out of the $104.1 billion General Fund Proposition 98 funding provided to K‑12 education in the 2025‑26 budget, $84.5 billion (81 percent) is provided through LCFF for school districts, charter schools, and COEs. Schools pay for most of their general operating expenses (including employee salaries and benefits, supplies, and student services) using these funds. Over half of the remaining $19.6 billion is provided through two categorical programs for special education ($6.1 billion) and the Expanding Learning Opportunities Program (ELOP)—which funds before/after and summer school programs ($4.6 billion).
LCFF Is Based on ADA. The state allocates LCFF to LEAs primarily based on their ADA—the average number of students in class each day throughout the school year. (LCFF for COEs is determined partially by their ADA, as well as several other factors, including the number of school districts and students total ADA within the county in which they operate.) For funding purposes, the state has historically credited school districts with their ADA in the current or prior year, whichever was higher. As a result of concerns with steep attendance declines due to the COVID‑19 pandemic, alongside the longer trend of statewide declining enrollment, the state added a three‑year rolling average to the LCFF calculations for school districts in 2022‑23 and for COEs in 2023‑24. School districts and COEs are credited with the average of their attendance over the three prior years if it exceeds their current‑ and prior‑year attendance. This policy was intended to slow funding reductions, allow districts and COEs more time to adjust their educational programs, and help reduce fluctuations in funding from temporary changes in ADA levels. Charter schools continue to be funded based on their current‑year ADA. In 2024‑25, half of school districts were funded on the rolling average of their three prior years of ADA, 33 percent were funded on current‑year ADA, and 17 percent were funded on prior‑year ADA. The ability to use prior‑year attendance or the three‑year rolling average in 2024‑25 resulted in districts being credited with roughly 120,000 more ADA (2.5 percent) than if the state funded districts on current‑year ADA only.
LCFF Provides Base Funding That Varies by Grade Span. School districts and charter schools receive the bulk of their LCFF through a base grant determined by their ADA in four grade spans (transitional kindergarten [TK] through grade 3, and grades 4‑6, 7‑8, and 9‑12). The base funding rates are higher for students in higher grades—reflecting generally higher costs of education at higher grade levels. LEAs may use their base funding for any educational purpose. Of the $83 billion in LCFF provided to school districts and charter schools, $64.5 billion (77 percent) is provided through base grants. (The formula for COEs includes one base rate for all students that is higher than the rates for school districts and charter schools.)
LCFF Includes Supplemental and Concentration Funding for Targeted Student Groups. LCFF provides additional funds to LEAs based on their unduplicated pupil percentage (UPP)—the proportion of their students who are low income (based on eligibility to receive free or reduced‑price meals under a federal nutrition program), English learners, or foster youth ($14.8 billion for school districts and charter schools in 2025‑26). The additional funding is intended to recognize that, on average, these student groups typically require additional support to meet grade level standards. For each English learner, foster youth, or low‑income student, school districts and charter schools receive a supplemental grant equal to 20 percent of the base grant. For COEs, the supplemental grant rate is 35 percent of their base rate. A student who is both an English learner and low income generates the same funding rate as a student who belongs to only one of these groups. For the purposes of calculating an LEA’s LCFF allotment, the state uses a three‑year rolling average of its UPP. In addition to the supplemental grant, school districts and charter schools can also receive a concentration grant equal to 65 percent of the adjusted base grant for each English learner and low‑income student above a UPP threshold of 55 percent. (A charter school’s concentration grant funding is calculated based on the UPP of the school district in which it resides, if the school’s UPP is higher than that of the school district.) For COEs, the concentration grant rate is 35 percent of the base rate for students attending community day schools, or 17.5 percent of the base rate for students attending juvenile court schools.
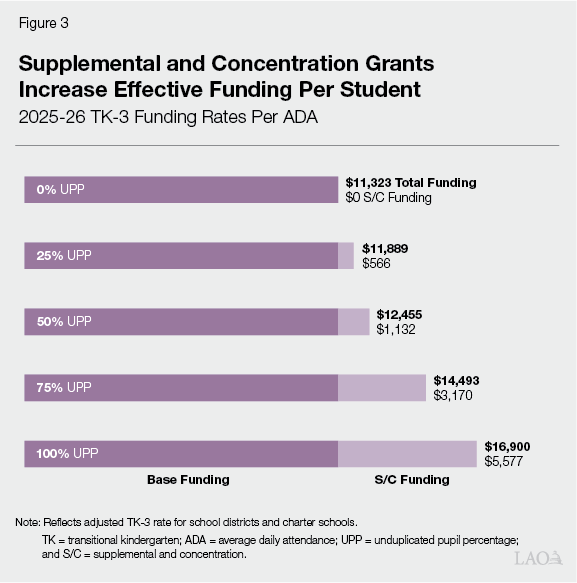
Districts With Higher UPP Levels Receive More LCFF Per Student. Due to supplemental and concentration grant funding, LEA’s with higher UPP levels receive higher levels of total LCFF funding per ADA. Figure 3 shows how variation in a district’s UPP affects their total per‑pupil funding. A district with a UPP of 25 percent will receive an additional $566 per ADA from the supplemental grant (a 5 percent increase from the base rate). Comparatively, a district with a UPP of 75 percent will receive $1,698 per ADA from the supplemental grant and $1,472 from the concentration grant—for a total of $3,170 in additional funding per ADA (a 28 percent increase from the base rate). This results in a district with a UPP of 75 percent receiving 22 percent more funding per ADA than a district with a UPP of 25 percent.
LEAs Must Ensure “Proportionality” When Spending Supplemental and Concentration Grant Funds. Relative to LCFF base funding, supplemental and concentration grant funding is more restricted. Specifically, LEAs must use their supplemental and concentration grant funding to proportionally increase or improve services for their English learners, low‑income students, and foster youth relative to the base amount of funding they receive. LEAs are required to track and report the use of their supplemental and concentration grant funding as part of their annual local planning processes. Additionally, the state requires LEAs to use any unspent supplemental and concentration grant funding from one year to increase or improve services for English learners, low‑income students, and foster youth in future years.
One of the Largest LCFF Add‑Ons Is Based on TK ADA. In addition to the main components of LCFF, the state also funds several add‑ons to the formula totaling $3.7 billion. About $1.5 billion of this total is tied to TK staffing requirements. In 2025‑26, LEAs may receive an additional $5,545 per TK ADA above the funding generated through the base, supplemental, and concentration grants. To receive this funding, LEAs must maintain an average of one adult for every ten students enrolled in TK classrooms at each school site. Most of the other add‑ons are based on historical factors or costs associated with home‑to‑school transportation.
Several Other State Programs Funded Based on ADA. In addition to LCFF, the state provides Proposition 98 funding through several categorical programs, many of which also are based on ADA. Most notably, ADA is used in the allocation formulas for special education, ELOP, and the K‑12 mandates block grant (funding that LEAs receive for complying with requirements deemed as reimbursable state mandates). Additionally, the state regularly allocates one‑time grants to LEAs based on ADA. Most recently, the 2025‑26 budget provided $1.7 billion for a new discretionary block grant, with funds allocated to LEAs proportionally based on their ADA.
Recent Changes to Attendance‑Based Funding
In recent years, the state enacted two changes that allowed LEAs to generate additional ADA if they comply with certain requirements. We describe these new policies below.
State Recently Streamlined “Short‑Term” Independent Study. Students can generate ADA for funding purposes through regular, in‑person instructional programs or through independent study. Rather than generating ADA based on in‑person attendance, independent study programs generate ADA based on the time students spend in synchronous or asynchronous remote instruction, as well as through coursework they complete. In cases where a student will be absent from school for a period of time and wants to remain enrolled in a classroom‑based program, LEAs can offer short‑term independent study, which has a more streamlined set of requirements. Beginning in 2024‑25, the state allowed LEAs to offer short‑term independent study to students who are planning to be absent from their classroom‑based program for any period up to 15 days (Previously, students had to be in independent study for at least 3 days, and up to 14 days.) LEAs provide students with assignments to complete during the time that they are not attending their in‑person instructional program, which subsequently are converted to an equivalent amount of attendance. In practice, this allows LEAs to continue to generate ADA when students are not attending school in person, based on the work students complete while they are out. The ADA generated through independent study is funded the same as traditional classroom‑based ADA.
State Authorized Attendance Recovery Programs in 2024‑25 Budget Package. Beginning July 1, 2025, LEAs are able to generate attendance‑based funding by providing instruction on weekends, before and after school, and during intersessions to students in classroom‑based programs who were absent from school. (The state also has a longstanding Saturday school program, which is more limited in scope.) The amount of attendance generated by a student through attendance recovery programs cannot exceed the total number of days the student is absent during the school year, up to a maximum of ten days. In addition, participating in these programs must be voluntary for all students. To generate additional funding, attendance recovery programs must meet several requirements:
- Include content that is substantially equivalent to instruction the student would have received as part of their regular school day.
- Have instruction provided under the supervision of certificated staff.
- Have a maximum student‑to‑teacher ratio of 20 to 1 for all grades except TK, which must have a maximum ratio of 10 to 1.
Attendance Requirements
In this section, we describe the state’s requirements for children to attend school and its system for tracking attendance.
Compulsory Education and Truancy Laws
State Law Requires Children Age Six and Up to Attend School. State law requires children between 6 and 18 years of age to attend school, with a limited number of specified exceptions (for example, students who have graduated from high school or passed the California Proficiency Program and obtained parental permission). Under state law, students are considered truant if they are absent from school without a valid excuse for three full days in one school year, or are tardy or absent for more than 30 minutes during the school day on three occasions in one school year. State law establishes a variety of specific reasons an absence may be considered excused, such as for illness, medical or dental appointments, attendance at the funeral of an immediate family member, jury duty, or public health reasons.
State Sets Specific Requirements for Addressing Truancy. Once a student has their third unexcused absence and is designated as truant, state law requires a first notification of truancy to the student’s parent or guardian, as well as to the LEA’s attendance supervisor or superintendent. Statute requires the first notification for parents or guardians to include specific information, such as the legal obligations to compel the attendance of their student at school, information on alternative educational programs and supportive services that are available for the student, and a statement that school personnel are available to discuss solutions to the student’s truancy. After the fifth unexcused absence, the student is considered habitually truant and may be referred to a Student Attendance Review Board (SARB). SARBs are multiagency boards that help habitually truant students and their parents or guardians address issues related to school attendance and behavior patterns to ensure that students remain in school.
State Recently Repealed Criminal Penalty for Parents of Truant Students. Historically, when the various interventions for habitually truant students failed to result in the student regularly attending school, the matter could be referred to the courts. Specifically, parents and guardians could face misdemeanor charges for failing to reasonably supervise and encourage a habitually truant student to attend school. Recently, the state enacted Chapter 154 of 2025 (AB 461, Ahrens), which repeals the criminal penalty for parents and guardians, beginning on January 1, 2026.
Attendance Reporting
State Sets Minimum Instructional Day and Time Requirements. The state sets a number of requirements related to the amount of instruction students must receive during the school year. School districts and charter schools are required to provide 180 days and 175 days of instruction, respectively. School districts and charter schools that are out of compliance with the minimum instructional day requirement will have their LCFF allotment proportionally reduced by the number of days that school was not offered. (COEs are not subject to instructional day requirements.) In addition to minimum day requirements, the state sets requirements for the total amount of instruction offered in a school year. School districts and charter schools are subject to the same total number of required minutes, which vary by grade level and range from 36,000 minutes (for TK and kindergarten) to 64,800 minutes (for grades 9‑12). Additionally, school districts are required to offer a minimum amount of instructional time per day. This minimum requirement also varies by grade span, from 180 minutes (for TK and kindergarten) to 240 minutes (for grades 9‑12). Charter schools do not have any required amount of daily instruction, while COEs have minimum daily minute requirements that vary based on instructional setting. All LEAs may face proportional reductions to their LCFF allotment for not meeting the instructional minute requirements.
Attendance and Instructional Time Subject to Annual Audits. The state sets the same definition of student attendance for the purposes of compulsory education laws and state funding. Specifically, students are deemed to be in attendance if they are under the immediate supervision and control of a certificated employee of the school district while engaged in educational activities for at least some part of the school day. LEAs record and track student attendance and the number of minutes of instruction they offer each day, as well as the number of days they provide instruction. LEAs are required to maintain readily accessible records on attendance information (including whether absences are excused or unexcused), which is subject to an annual audit by the LEA’s independent auditor.
State Has Waiver Process for Receiving Emergency Attendance Funding. Existing law establishes an emergency waiver process for LEAs to earn attendance‑based funding when they are affected by an emergency or other event. When LEAs must close schools due to an emergency such as a fire, flood, or epidemic, they can receive a waiver that exempts them from the minimum instructional day requirements. Through this process, LEAs can receive the same amount of funding they otherwise would have received without having to make up the days lost due to emergency. LEAs also can submit an emergency waiver when they remain open but certain circumstances result in a material decrease in attendance (at least 10 percent of students who would normally attend a school do not attend on any one day). This could include circumstances such as impassable roads, an epidemic, or a strike involving transportation services to students provided by an external entity. LEAs must certify they have a plan for offering online instruction or independent study to students affected by the emergency within ten days of a closure or major decline in attendance. In addition, LEAs are required to reopen for in‑person instruction as soon as possible, unless prohibited under the direction of the local or state health officer.
How Other States Fund Schools
In this section, we provide a brief overview of the different ways that states structure their primary K‑12 funding formulas, including how they count students for funding purposes.
Public School Finance
Public Schools Primarily Funded by Local and State Revenues. According to data from the U.S. Census Bureau, public schools received a total of $947 billion in 2022‑23. Of that amount, 45 percent came from state funding, 43 percent came from local funding, and the remaining 13 percent came from federal funding. States have flexibility to determine how state and local funding will be allocated, and what restrictions will apply to specific funds. Federal funding is typically restricted for specific programs, such as to support low‑income students and students with disabilities.
California Schools Rely More Heavily on State Funding. Census data for 2022‑23 show that California’s per‑student spending level ($18,798) ranked 16th among the 50 states and District of Columbia. This level is 14 percent higher than the national average in total spending per student ($16,526). The data further shows that compared to other states, California’s education system relies more heavily on state funding than locally raised revenue. Specifically, California ranks third in the nation on state funding per student ($14,726), which is 62 percent higher than the national average of $9,077. Conversely, California ranks 20th on local funding per student ($8,215), which is 5 percent less than the national average ($8,622).
Model Types
Most States Use a Student‑Based Formula. According to the Education Commission of the States (ECS), state education funding formulas can generally be categorized into three distinct categories. As Figure 4 shows, 35 states and the District of Columbia use a student‑based funding formula that typically includes a base amount of funding for each student, with additional funding for students with additional needs. To count the number of students, states either use counts of enrollment or attendance. Nine states use a resource‑based formula, which provides funding based the estimated cost of staffing, services, or programs. (The formulas for resourced‑based states also incorporate student counts in determining costs of programs.) Four states use a hybrid approach that combines student‑based and resource‑based formulas, while two states have distinct education systems. Each of the formula types incorporate student counts in some way.
Figure 4
Most States Use a Student‑Based Funding Formula
|
Type |
Description |
States |
|
Student‑Based |
Provides a base amount of funding per student with additional funding or weights intended to provide additional services and support to students with unique needs. |
Alaska, Arizona, Arkansas, California, Colorado, Connecticut, District of Columbia, Florida, Hawaii, Indiana, Iowa, Kansas, Kentucky, Louisiana, Maryland, Michigan, Minnesota, Mississippi, Missouri, Montana, Nebraska, Nevada, New Hampshire, New Jersey, New Mexico, New York, North Dakota, Ohio, Oklahoma, Oregon, Pennsylvania, Rhode Island, South Carolina, Tennessee, Texas, Utah. |
|
Resource‑Based |
Allocates funding based on the cost of staffing, services, or programs needed to serve students. |
Alabama, Delaware, Idaho, North Carolina, South Dakota, Virginia, Washington, West Virginia, Wyoming. |
|
Hybrid |
Funding models that combine elements from both student‑based and resource‑based models to create a unique system. |
Georgia, Illinois, Maine, Massachusetts. |
|
Other |
Funding models that do not resemble from student‑based, resource‑based, or hybrid models. |
Vermont and Wisconsin. |
|
Source: Education Commission of the States. |
||
All States Provide Targeted Funding Based on Student or District Characteristics. According to data compiled by ECS in 2024 and our review of recent changes made by states, all states provide targeted funding based on student characteristics in addition to base funding. Currently, 49 states have targeted funding for English learners, 43 states have targeted funding for low‑income students, 37 states have funding for gifted and talented students, and all states provide some level of targeted funding for students with disabilities. In addition, 36 states provide some funding adjustment for small schools or districts, and some states provide additional weights for districts that have higher shares of students with higher needs. Targeted funding may be allocated as a weight to the main funding formula, a separate categorical program, or a reimbursement.
Student Count Methodology
Vast Majority of States Use Enrollment to Count Students. At the time of this report, 45 states and the District of Columbia use enrollment as their student count. The remaining five states—California, Idaho, Kentucky, Missouri, and Texas—use attendance to count students in their K‑12 funding formulas.
Enrollment Student Count Methodologies Vary Significantly by State. Although most states use student enrollment for their funding model, there is no standard method for how student enrollment is counted for funding purposes. Of the states that fund based on enrollment, 11 states use enrollment counts from a single day in the school year (typically in the early fall). In addition, 11 states use multiple enrollment counts throughout the school year. For example, Illinois averages enrollment counts from October 1 and March 1. The remaining 24 states average enrollment counts across a period of time during the school year. For example, Arizona averages enrollment across the first 100 days of the school year, while Pennsylvania averages enrollment across the entire school year. Enrollment counts averaged across a period of time are often referred to as average daily membership.
States With Attendance‑Based Student Counts All Use ADA. Each of the five states with attendance‑based student counts use average attendance over a period of time. Four of the states—California, Kentucky, Missouri, and Texas—generally calculate ADA as the total days of student attendance, divided by the total number of instructional days in the school year. (Texas has an optional alternative methodology for LEAs with high shares of migrant students.) The remaining state—Idaho—uses two separate ADA calculations in its formula. One calculation is from the first day of the fall semester through the first Friday in November, and the other is based on the best 28 weeks of attendance throughout the school year. Each of these states incorporates adjustments or exclusions intended to reduce the effects of poor attendance on school funding. For example, California, Idaho, Missouri, and Texas each have a waiver process for LEAs whose ADA is negatively affected by emergencies such as natural disasters, inclement weather, or quarantines. (These waiver processes can vary on whether any lost instruction due to inclement weather is required to be made up.) In Kentucky, LEAs are able to remove the five worst days of attendance from their ADA calculations, and can substitute up to ten days of low attendance due to inclement weather with attendance from the same days in the prior school year.
Two States Have Recently Shifted From ADA Student Counts to Enrollment. Although many states have made significant changes to their funding formulas in the last two decades, only a few have changed how they count students in their funding formulas. In the last eight years, Illinois and Mississippi shifted from using an attendance‑based student count to one based on enrollment. For both states, this shift was not solely a shift from attendance to enrollment, but part of significant redesigns of their state education finance systems that effectively replaced their previous funding models—akin to California’s transition from the previous system of revenue limits and categorical programs to LCFF. These shifts were in part intended to address underlying inequities in their education systems and included a variety of significant policy changes such as providing additional or new targeted funding for certain student subgroups, setting adequacy targets to allocate more funding to districts with lower property tax revenue, or significantly increasing base per‑student funding.
Missouri Recently Changed Their Formula to Factor Both ADA and Enrollment. Similar to Illinois and Mississippi, Missouri also recently made significant changes to their education funding system, including adding a major component to their finance system to target funding to specific student demographics. Furthermore, beginning in 2024‑25, Missouri’s student count methodology factors in a combination of ADA and student enrollment. By 2029‑30, Missouri’s student count will be 50 percent based on ADA and 50 percent based on enrollment.
Research on Student Attendance
Student Attendance and Outcomes
Attendance Is a Strong Predictor of Student Achievement. The available research consistently shows a positive relationship between student attendance and academic achievement, including test scores, reading proficiency, and graduation rates. This relationship holds even after controlling for student demographics, such as income level and race/ethnicity. Additionally, higher chronic absenteeism is associated with a higher likelihood of dropping out of high school and other long‑term negative effects in adulthood, such as poorer health outcomes, lower educational attainment, and reduced lifetime earnings.
In Early Grades, Attendance Is a Strong Predictor of Reading Proficiency. Research has shown that chronic absence in early grades is a strong indicator that a student will be behind in reading. For example, one 2011 study in California showed that 17 percent of students who were chronically absent in both kindergarten and first grade were reading proficiently in third grade, compared to 64 percent for students who were not chronically absent in the same grades. Missing significant amounts of school in early grades can impede a student’s ability to build a strong foundation in reading, which can have cumulative effects in later grades. Studies also have shown evidence that students can reverse academic difficulties by improving their attendance after previously being chronically absent.
In Later Grades, Chronic Absence a Predictor of Dropping Out. Chronic absences in higher grades have been shown to be a predictor for lower academic achievement as well as not completing high school. For example, a 2012 study found chronic absenteeism in high schoolers to be a stronger predictor of dropping out than suspensions or test scores, even after controlling for student demographics and backgrounds.
Drivers of Student Absenteeism
Reasons for Absences Fall Into Four Broad Categories. Researchers use a variety of approaches to categorize reasons why students are absent from school. One such framework used by Attendance Works groups absences into four broad categories:
- Barriers to Attendance. Factors that prevent a student from attending school. For example: illness, lack of transportation, housing instability, and family responsibilities or home situation.
- Aversion to School. Factors that may cause a student to avoid attending school. For example: academic challenges, negative school climate, and mental health issues.
- Disengagement From School. Factors that result in lack of engagement or connection with attending school. For example, no meaningful relationships to adults in the school, lack of academic or behavioral support, or being behind on credits.
- Misconceptions About the Impact of Absences. Attitudes or beliefs students or families may have that influence their attendance. For example, thinking absences are not an issue if they are excused, staying home for any symptom of illness, or thinking attendance only matters in the higher grades.
Students With Certain Characteristics More Likely to Be Absent. The available national data shows that students who are low‑income, English learners, foster youth, or homeless youth are more likely, on average, to be chronically absent than students who do not fall into any of these student groups. This may be exacerbated in communities with greater concentrations of students with high needs. For example, one study found that students who live in communities with high levels of poverty are four times more likely to be chronically absent because they are more likely to face barriers to attending school. Additionally, research suggests that higher concentrations of chronically absent students at a school can negatively affect the outcomes for all students.
Evidence‑Based Practices to Improve Student Attendance
Schools in California and across the nation have undertaken many strategies to increase attendance and reduce chronic absenteeism. Below, we discuss a few strategies that have been shown to improve student attendance.
Early Warning Systems Help Schools Target Additional Support. Many education experts emphasize the importance of regular real‑time attendance tracking in being able to identify students who are on track to becoming chronically absent throughout the school year. One study conducted by the American Institutes for Research found the establishment of early warning systems to be effective in reducing chronic absenteeism. Identifying students who are on track to becoming chronically absent gives schools the opportunity to engage with students and families to understand the root cause of absences.
Research Shows Direct Communication With Students and Families Increases Attendance. Multiple studies have found communication and engagement strategies to be successful in improving attendance. In particular, personalized communication with parents through calls and text messages have been found to be effective approaches. Through these communications, school staff can remind families of the student’s number of absences and emphasize the importance of regular school attendance for students. These strategies also are relatively low cost, which makes them a cost‑effective approach for schools.
Home Visits and More Targeted Interventions Also Can Help Improve Attendance. In addition to personalized communications, schools often address absenteeism by implementing more targeted interventions to engage with students and families. For example, a 2018 study of a parent teacher home visiting program in four urban districts showed that students whose families received a home visit were less likely to be chronically absent than students whose families did not receive a home visit. More recently, initial studies of a home visiting program funded in Connecticut found the program to be effective in reducing chronic absenteeism in the targeted school districts. The home visits allow school staff to build stronger relationships with students and families, gain an understanding of why students may be absent, and connect students with supports and interventions that could address barriers to attending school. For example, a student that is not academically engaged because they are behind on credits can be given access to tutoring or opportunities for credit recovery. Staff may also connect students with community partners or other public agencies to help address barriers that are outside of the school’s control. For example, they can connect homeless students with community resources, or connect students with mental health challenges to counseling services.
Studies Show Other Interventions May Have Positive Impact on Student Attendance. Other programs not specifically focused on improving attendance also can have positive impacts on attendance. Several studies of community schools implemented in New York have found improvements in student outcomes, including attendance. A preliminary study of the first cohort of grantees from the California Community School Partnership Program showed higher improvements in attendance rates and lower chronic absenteeism in schools implementing the community schools model, compared with similar schools that did not receive community school grants. Several studies of before/after and summer school programs also suggest these programs can improve student attendance. California significantly expanded its before/after and summer school programs through the creation of ELOP, although no evaluations of the program have been conducted to date.
History of Funding Excused Absences in California
In this section, we provide a history of the state’s decision to eliminate excused absences from ADA for funding purposes.
State Historically Funded Excused Absences
Prior to 1997, State Funded Excused Absences. The state has funded LEAs based on ADA since 1911. Prior to 1997, ADA for funding purposes was based upon actual attendance, plus any excused absences. Reasons for excused absences included illness, medical or dental appointments, attendance at the funeral of an immediate family member, jury duty, or public health reasons. To count an absence as excused, LEAs were required to collect a note or other evidence the student was absent for an excusable reason. LEAs were required to document and maintain the records for excused absences for three years, and were subject to the annual audit process. Although LEAs tracked excused and unexcused absences locally, ADA that was reported to the state was not disaggregated by actual attendance and excused absences. However, one California Department of Education (CDE) survey of annual attendance data of 1,040 LEAs in 1983‑84 showed that the statewide attendance rate was 91 percent, with an excused absence rate of 6 percent and an unexcused absence rate of 3 percent.
In the 1970s and 1980s, Concerns Were Raised Around Funding Excused Absences. In the 1970s, members of the Legislature and education experts raised several concerns about truancy and dropout rates for high school students. In 1979, at the request of the Legislature, the State Auditor published a general audit of attendance and absenteeism in schools. The audit showed actual attendance rates averaged 90.8 percent in selected elementary schools, 87.7 percent in junior high schools, and 81.4 percent in high schools. The audit cited various factors that contributed to absenteeism, such as illness, behavioral issues, academic problems, family or personal business, or influence of friends. One of the key barriers to addressing absenteeism cited by members of the Legislature and the State Auditor was the state’s policy of funding excused absences, which diminished the fiscal incentive for schools to increase actual attendance. Some members of the Legislature raised concerns that many absences counted as excused may not actually have been excusable. For example, a bill analysis cited an estimate by health officials that 6 percent of absences were due to illness, but some schools reported illness rates of as high as 24 percent. In bill analyses and a 1985 Assembly Office of Research report, legislative staff raised concerns that by funding excused absences, schools focused on procedures to count an absence as excused rather than on increasing students’ actual attendance. Furthermore, there were concerns that the system discouraged schools from scrutinizing documents supporting the excused absence. The attendance system also required schools to invest much time and effort in accounting for students who were not actually attending school.
Pilot Study for Funding Based on Actual Student Attendance
State Commissioned a Pilot Study to Assess No Longer Funding Excused Absences. Chapter 1329 of 1980 (AB 3269, Hart) commissioned CDE to administer a pilot program. The pilot program allowed districts to receive a higher per‑student funding rate if their participating school site increased their attendance above a certain amount. Specifically, if participating schools increased their attendance by over 2 percent relative to their 1979‑80 attendance, the district’s apportionment was increased by a rate equal to half of the increase. For example, if a participating school increased its attendance by 3 percent relative to 1979‑80, the district would receive a per‑student increase of 1.5 percent to the district’s overall per‑student rate. Half of any funding increase was required to be directed to a specific program for staff development and school improvement, while the remaining half could be used for any purpose. Chapter 1329 authorized CDE to select 25 unified school districts, 25 elementary school districts, and 10 high school districts to participate in the pilot. To be selected as a participant, districts were required to apply and identify at least one school site to be evaluated as part of the pilot program. In total, CDE selected 32 schools from 28 school districts—10 elementary schools, 5 junior high schools, 16 comprehensive high schools, and 1 continuation high school.
State Made Other Attendance‑Related Changes. Chapter 1329 also made several other policy changes related to attendance. Most notably, it required districts to publicly report actual attendance rates (without excused absences), required districts to notify parents or guardians immediately when their child was absent, and required parents or guardians to be present at SARB meetings.
Excused Absence Rates Varied at Participating Schools. In order to assess the impact of the pilot study, districts reported the participating school’s actual attendance rates and excused absence rates for the 1979‑80 school year (prior to their participation in the pilot). As Figure 5 shows, schools with higher grade levels had lower attendance rates and higher excused absence rates.
Figure 5
Higher Grade Levels at Participating Schools
Had More Absences
Attendance Rates From Year Preceding Pilot Study, 1979‑80
|
Actual |
Excused |
Combined |
|
|
Elementary |
91.5% |
5.9% |
97.4% |
|
Junior High |
88.5 |
6.8 |
95.3 |
|
High |
87.0 |
8.4 |
95.4 |
|
Continuation High |
68.9 |
17.4 |
86.3 |
Pilot Study Showed Increases in Attendance for Participating Schools. During the two years of the pilot study, elementary schools averaged a 3.12 percent improvement in actual attendance, junior high schools had an average gain of 3.42 percent, and high schools averaged a 5.39 percent increase. The one continuation high school experienced an attendance increase of 11 percent. In its evaluation, CDE stated that no one simple solution improved attendance for the participating schools. Rather, improved attendance was linked with a comprehensive approach of interrelated activities in the school and district. Some strategies that schools and districts in the pilot study used to increase attendance included regularly monitoring actual attendance, conducting home visits, providing counseling and tutoring, and creating incentives for students to improve their attendance. Some participants also implemented more punitive measures, such as issuing in‑house suspensions, establishing Saturday school programs, and working with local law enforcement to locate truant students who were absent from school.
CDE Disseminated Information About Improving Attendance. After the pilot study concluded, CDE issued a report in 1983 that included a comprehensive approach to improve attendance based on the strategies implemented by the participating schools. The report identified which interventions were used at each of the participating schools, as well as tips for implementing each strategy. CDE also provided a checklist to help attendance personnel and other administrators assess the adequacy of their attendance strategies. CDE’s guidance for a comprehensive approach to attendance included six components:
- Assessing Actual Attendance. Rather than focusing on funded ADA that included excused absences, CDE advised districts to focus on improvements in actual attendance rates.
- Developing Policies and Procedures. CDE encouraged districts to review their current attendance policies and practices to see if they meet the objective of improving student attendance. When districts establish an attendance policy, it brings attention to the issue and sets attendance as a high‑priority for schools.
- Selecting Program Strategies. CDE emphasized that each intervention for improving attendance must include elements such as clear expectations for students to attend school, engagement with parents or guardians, a team approach from staff across the school, and awareness from students and families of the negative impacts of attendance on student progress and community well‑being.
- Streamlining Attendance Reporting Systems. CDE encouraged districts to computerize their attendance systems so they could more easily monitor attendance patterns and have access to accurate, up‑to‑date daily attendance information on each student. This information could be used when contacting parents or referring students to SARBs.
- Orienting Staff Members. CDE stated that staff involvement is a prerequisite for better attendance. When all staff and administrators at a school understand the link between attendance and achievement, they are more likely to promote the use of policies and strategies for improving attendance. Additionally, ongoing staff development could help support a team approach for improving attendance.
- Involving Community Members. CDE emphasized that relationships with law enforcement, service agencies, and parents are an integral part of a school’s efforts to improve attendance. Support from the community allows school personnel to promote attendance and expand services to students and parents.
Optional Alternative Funding Methodology
Beginning in 1992, Districts Could Opt Into Alternative Funding Methodology. Chapter 984 of 1991 (SB 407, Green) established an alternative method of calculating funded ADA that is based on actual attendance plus a specified, fixed excused absence rate. Specifically, districts were credited with the lesser of either the district’s excused absence rate for 1990‑91 or the statewide average excused absence rate by type of district (elementary, high school, or unified) for 1990‑91. To receive this alternative methodology for apportionment, districts had to submit a request to the Superintendent of Public Instruction. Districts that opted into this funding methodology could increase their revenue by reducing their rate of absences below their historic absence rate or below the statewide average. By 1997‑98, 17 school districts were using the alternative SB 407 ADA calculation. The use of this alternative method was intended to be a pilot program that would be assessed for statewide implementation. However, the program was not studied and was later repealed.
Elimination of Funding for Excused Absences
State Eliminated Funding for Excused Absences Beginning in 1998‑99. Senate Bill 727 eliminated the use of excused absences from the calculations used to determine funded ADA, beginning in 1998‑99. The author’s commentary on the bill states the intent was to eliminate the incentive for districts to overlook absences as well as alleviate the administrative burden of collecting, filing, verifying, and auditing notes for excused absences. The author argued this would allow district administrators to shift their focus and redirect resources from excusing absences to increasing actual attendance. Additionally, the author stated that the bill was informed by the results of the attendance pilot study and positive feedback from school districts that opted into the alternative funding methodology allowed by SB 407.
Senate Bill 727 Included Provisions to Hold Districts Harmless. Senate Bill 727 included additional provisions to hold school districts harmless from the change in no longer funding excused absences. Specifically, SB 727 increased each districts’ per‑student funding rate by their reported excused absence rate in 1996‑97. Effectively, districts would receive the same amount of funding if their actual attendance was unchanged from the year prior to implementation. Since excused absences were no longer being funded, if districts wanted to increase their revenue, the primary avenue to do so was to increase actual attendance. Districts were required to continue tracking excused absences for purposes of complying with compulsory education laws.
Trends in Student Attendance
Recent Trends in Attendance Rates
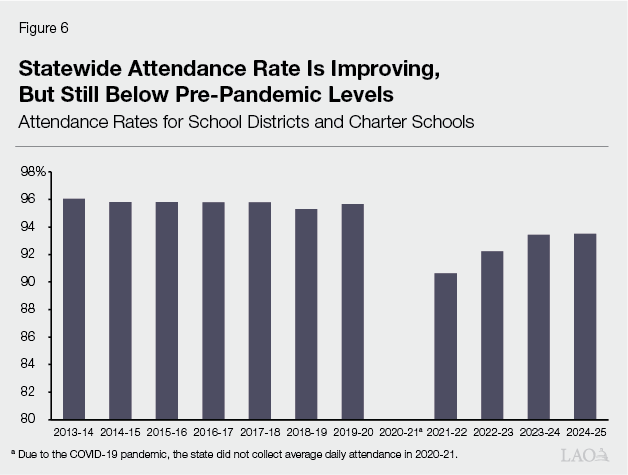
Attendance Rates Currently Below Pre‑Pandemic Levels. As Figure 6 shows, the attendance rate for school districts and charter schools—the ADA for the school year divided by the Census Day enrollment—was relatively stable prior to 2019‑20, averaging 95.7 percent. The statewide attendance rate decreased sharply during the pandemic, to a low of 90.6 percent in 2021‑22 (the state did not collect attendance information in 2020‑21). Since then, attendance rates have continued to rebound but, as of the 2024‑25 school year, remain about 2 percentage points below pre‑pandemic levels.
Districts Report Cultural Shifts Around Attendance Resulting From the Pandemic. The attendance rate declines in 2021‑22 were a direct result of the pandemic. Schools had stricter rules around illnesses and quarantine requirements for students and families who were exposed to COVID‑19. Although these specific rules are no longer in place, attendance rates remain below pre‑pandemic levels. School districts and researchers have reported a shift in expectations among students and families about regular school attendance that may be a driving factor as to why attendance rates have not returned to pre‑pandemic levels. For example, students and families may be more likely to view attendance as optional rather than compulsory and students may be more likely to stay at home when sick. In addition, many school districts reported increases in anxiety and other student mental health issues, as well as challenges with student engagement, which can also affect attendance.
Attendance Rates and LCFF Considerations
School Districts With Higher UPP Rates Have Lower Attendance Rates on Average. Consistent with recent data showing that students who are low‑income, English learners, and foster youth are more likely to be absent than their peers, districts with higher shares of students with these characteristics have lower attendance rates on average (Figure 7). To compare attendance rates between higher and lower UPP school districts, we divided them into quartiles based on their UPP. As Figure 8 shows, districts in the quartile with the lowest UPP have average attendance rates that are 2.5 percentage points higher than districts in the quartile with the highest UPP.
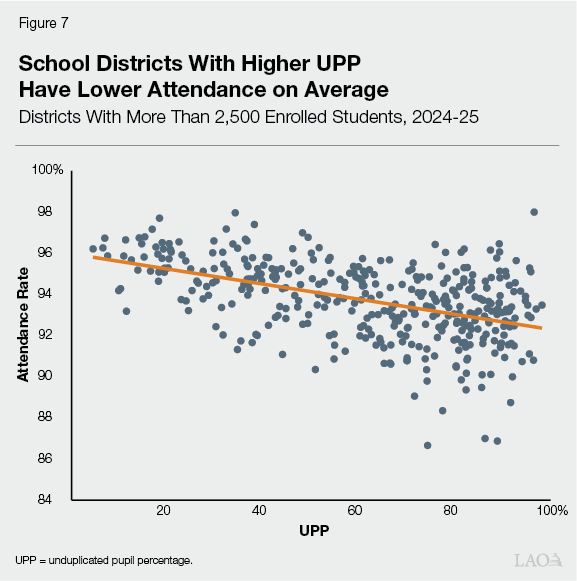
Figure 8
Districts in Highest Quartile of UPP Have Lowest
Attendance Rates
Average Attendance Rate by UPP Quartile, 2024‑25
|
Quartile |
UPP Range |
ADA |
Census Day |
Attendance |
|
1 |
0% ‑ 43.21% |
932,018 |
980,135 |
95.1% |
|
2 |
43.22 ‑ 64.39 |
1,095,658 |
1,167,552 |
93.8 |
|
3 |
64.40 ‑ 81.95 |
1,252,474 |
1,351,943 |
92.6 |
|
4 |
81.96 ‑ 100 |
1,454,516 |
1,571,041 |
92.6 |
|
Totals |
4,734,666 |
5,070,671 |
93.4% |
|
|
UPP = unduplicated pupil percentage and ADA = average daily attendance. |
||||
Lower Attendance Affects LCFF Funding. Given LCFF is funded based on ADA, lower attendance rates result in less funding per enrolled student. To estimate the effect of lower attendance rates on higher UPP districts, we estimate the average amount of funding districts in quartiles 2, 3 and 4 would receive if they had an attendance rate equal to the average of districts in the lowest UPP quartile (95.1 percent). (For this exercise, we adjusted every district’s funded ADA to reflect 95.1 percent of their enrollment and compared that with districts’ actual funding levels aggregated by quartile in 2024‑25.) As Figure 9 shows, we estimate that districts in the highest UPP quartile would receive an average of $387 in additional funding per enrolled student if their attendance rates were 95.1 percent. (Of the districts in the highest UPP quartile, 81 percent had attendance rates less than 95.1 percent, compared to 46 percent of districts in quartile 1).
Figure 9
For Higher UPP Districts, Funding Would Be
Somewhat Higher With Improved Attendance
Average LCFF Funding Per Student by UPP Quartile, 2024‑25
|
Quartile |
Average Funding Per |
Funding Assuming |
Difference |
|
1 |
$11,304 |
$11,304 |
— |
|
2 |
11,878 |
12,039 |
$161 |
|
3 |
13,313 |
13,668 |
355 |
|
4 |
14,283 |
14,670 |
387 |
|
UPP = unduplicated pupil percentage and LCFF = Local Control Funding Formula. |
|||
High UPP Districts Receive Higher Funding Overall Due to Supplemental and Concentration Funding. Although high UPP districts receive somewhat less funding per student due to lower attendance rates, their overall LCFF remains higher due to the targeted nature of LCFF supplemental and concentration funding. As Figure 10 shows, school districts in the highest UPP quartile received an average of $2,979 (26 percent) more per enrolled student in 2024‑25 compared to districts in the lowest UPP quartile.
Figure 10
Highest UPP Districts Receive Significantly More
Funding Due to Supplemental and Concentration
Grants
Average LCFF Funding Per Student by UPP Quartile, 2024‑25
|
Quartile |
Average Funding Per |
Funding Compared |
Percentage |
|
1 |
$11,304 |
— |
— |
|
2 |
11,878 |
$574 |
5% |
|
3 |
13,313 |
2,009 |
18 |
|
4 |
14,283 |
2,979 |
26 |
|
UPP = unduplicated pupil percentage and LCFF = Local Control Funding Formula. |
|||
High School Districts Have Lowest Attendance Rates. When looking at attendance rates by district type—elementary, high, and unified—high school districts have the lowest attendance rates on average (Figure 11). These lower rates reflect the higher absence rates among high school students.
Figure 11
High School Districts Have Lowest
Attendance Rates
2024‑25
|
District Type |
ADA |
Enrollment |
Attendance Rate |
|
Elementary |
955,354 |
1,011,859 |
94.4% |
|
High |
491,665 |
531,511 |
92.5 |
|
Unified |
3,287,647 |
3,527,301 |
93.2 |
|
Statewide |
4,734,666 |
5,070,671 |
93.4% |
|
ADA = average daily attendance. |
|||
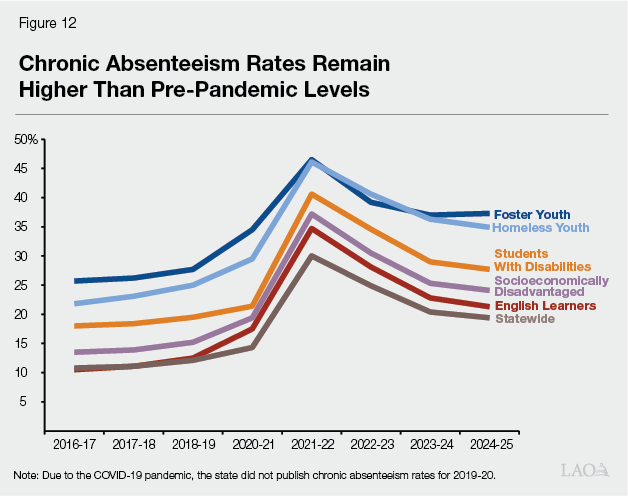
Chronic Absenteeism Increased Significantly Due to Pandemic. The state requires LEAs to annually collect and report information around chronic absenteeism. Students are identified as chronically absent if they are absent for more than 10 percent of the time they are enrolled at a school. (A student enrolled at a school district for a full academic year is considered chronically absent if they miss 18 or more days of school.) As Figure 12 shows, the statewide chronic absenteeism rate increased significantly from 12.1 percent in 2018‑19 to 30 percent in 2021‑22. (The state did not publish chronic absenteeism for the 2019‑20 school year due to the COVID‑19 pandemic.) Since 2021‑22, the statewide chronic absenteeism rate has steadily declined year over year, but the 2024‑25 rate (19.4 percent) remained substantially higher than the rate from 2018‑19 (12.1 percent). Figure 12 also shows the student subgroups with the highest rates of chronic absenteeism are homeless students and foster youth—37.3 percent and 34.9 percent in 2024‑25, respectively. Statewide data for 2024‑25 also shows American Indian or Alaska Native students (31.6 percent) and African American students (31.3 percent) had the highest rates of chronic absenteeism among racial and ethnic subgroups.
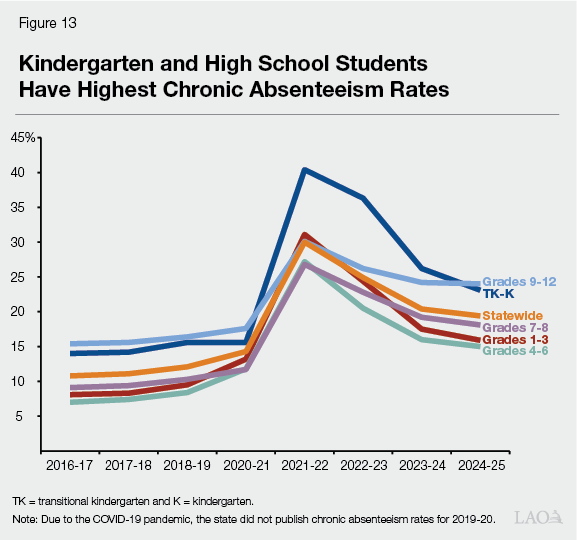
Absenteeism Is Highest in Kindergarten and High School. As Figure 13 shows, chronic absenteeism has been highest in TK and kindergarten since the pandemic. In 2018‑19, chronic absence for kindergarten and TK was 16 percent, then spiked to 40 percent in 2021‑22. Since the pandemic, these rates have declined to 23.1 percent in 2024‑25. Aside from TK and kindergarten, absenteeism is highest in the high school grades.
Reasons for Absenteeism Differ by Grade Level. Based on our conversations with school districts, the likely drivers of higher absenteeism rates vary by grade level. For TK and kindergarten, districts noted that families were more likely to keep their students home when they are sick compared to before the pandemic. School districts also mentioned that parents viewed regular attendance in TK and kindergarten as less critical, since students under the age of 6 are not required to attend school. School districts cited different reasons for higher absenteeism in high school. For high schools, school districts believed that greater levels of absences were due to anxiety and other mental health issues. In addition, many report changing perceptions about the value of in‑person attendance given technological changes that give students access to course materials at home. Given high schools students can typically access materials and complete and submit work online, they may place less of a significance on attending school regularly.
Chronic Absenteeism in Other States
Other States Saw Similar Increases in Chronic Absenteeism. California’s experience with chronic absenteeism is similar to that in other states. Nationwide data show that chronic absenteeism increased from 15 percent in 2018‑19 to 28 percent in 2021‑22, with rates decreasing to 23 percent in 2023‑24. Although California’s chronic absenteeism rates were lower than the nation as a whole prior to the pandemic, its peak rates in 2021‑22 were higher. California’s rates were below the national average for 2023‑24.
States Take a Variety of Approaches to Address Absenteeism. At least 36 states use chronic absenteeism in their school accountability systems, and almost all states publish absenteeism data by school and district. However, states take a variety of approaches to address chronic absenteeism in schools. Several states require school districts to develop an action plan for addressing chronic absenteeism. In New Mexico, all school districts must create a plan with a tiered system of interventions that provides more intensive strategies as attendance worsens. In New Jersey, a corrective action plan is required for any district with a chronic absenteeism rate above 10 percent. Other states have provided categorical funding to school districts for addressing absenteeism. Many states have made more recent changes to address post‑pandemic increases in absenteeism. In 2021, the state of Connecticut used federal COVID‑19 relief funds to establish a home visiting program that targets chronically absent students in the 15 school districts with the highest chronic absenteeism rates. In 2023, the state of Rhode Island enacted several policies intended to address absenteeism. Most notably, the state publishes chronic absenteeism data (by school and school district) that is updated daily during the school year.
LAO Assessment
In this section, we describe four criteria we use to evaluate the effects of shifting the LCFF student count methodology from ADA to enrollment, provide our assessment of such a shift using these criteria, identify a few policy alternatives that maintain the current ADA student count, and describe the trade‑offs to these alternatives.
Criteria for Evaluating Changes to the State’s Student Count Methodology
Four Criteria for Assessing Impacts of Policy Change. To assess the impact of shifting to a student count methodology based on enrollment, our assessment focuses on four key factors:
- Fiscal and Distributional Effects. How shifting to an enrollment‑based student count methodology would affect the total amount of LCFF funding provided, as well as the distribution of LCFF funding across different types of LEAs. In particular, we focus our analysis on the effects across school districts of varying UPP levels.
- Effects on Attendance. The degree to which a change in the student count methodology would affect student attendance and school district programs and initiatives that support student attendance.
- Effect on School Planning. The degree to which a change in the student count methodology would affect LEA budget planning.
- Administrative Burden. How shifting to an enrollment student count for LCFF would affect the administrative burden for LEAs to collect and report information used in the funding model.
Key Assumptions. In assessing the shift to an enrollment‑based student count in LCFF, we assume no changes to any other aspect of the current funding model. For example, we assume the state continues to credit school districts and COEs with the greater of their current‑year enrollment, prior‑year enrollment, or three‑year rolling average of their prior‑year enrollment, and funds charter schools based on the current year only. We also assume the state maintains the three current reporting periods for LCFF funding.
Effects of Shifting to Enrollment‑Based Funding
Fiscal Implications
Methodology. Senate Bill 98 requires our office to analyze options for phasing in an enrollment‑based student count methodology for LCFF that does not result in a reduction in funding for any LEA. To develop a fiscal estimate consistent with this requirement, we generally assume the state would use existing LCFF per‑student rates, but apply those rates to enrollment rather than ADA. We do not assume any other changes to the formulas. For enrollment, we use Census Day enrollment, which provides a snapshot of enrollment based on the first Wednesday in October. (The state currently only tracks this enrollment measure and cumulative enrollment.) Our estimates use enrollment and ADA from 2022‑23 through 2024‑25 and assume no changes in ADA or attendance rates. For the LCFF rates, we use the 2025‑26 rates and apply a 2.51 percent cost‑of‑living adjustment (COLA) to reflect our estimate of the rates for 2026‑27.
Shifting to an Enrollment Student Count Methodology Would Increase LCFF Costs by About $6 Billion Annually. We estimate using enrollment for LCFF would increase annual LCFF costs by $5.7 billion. Using 2024‑25 data as a baseline, we estimate the main LCFF formulas would increase by $5.6 billion—$5 billion for school districts and $580 million for charter schools. Additionally, we estimate the cost of the TK staffing ratio add‑on for school districts and charter schools would increase by roughly $110 million. For COEs, we estimate LCFF costs would increase by roughly $30 million statewide. Of this amount, the costs are about evenly split between the two parts of the formula: one part based on the overall student population in the county and the other part based on students enrolled in COE‑run programs. For the latter portion of the formula, rather than using Census Day enrollment, we assume COEs would see increases similar to that of the highest UPP districts. (Using COE Census Day enrollment would have resulted in only minor additional state costs, as the vast majority of COEs have Census Day enrollment that is lower than their ADA.)
LCFF Increases Would Be Greater for Districts With Higher Proportions of Low‑Income Students. For school districts, the $5 billion increase in funding for switching to an enrollment‑based LCFF would represent a 7.24 percent increase in statewide LCFF funding. In practice, however, school districts with lower attendance rates would see relatively larger increases as a result of the policy change, while those with higher attendance rates would see relatively smaller increases. Since LEAs with higher UPP have lower attendance rates on average and receive more funding per student compared to LEAs with lower UPP levels, they would experience the largest increases. As Figure 14 shows, we estimate districts in the lowest UPP quartile would receive a 5.2 percent LCFF increase on average, while districts in quartiles 3 and 4 would receive an 8 percent increase on average.
Figure 14
Switching to Enrollment Would Provide
Larger Increases to High UPP Districts
Average LCFF Funding Per Student, by UPP Quartile
|
Quartile |
Current Funding Per |
Enrollment‑Based Funding |
Difference |
Percent |
|
1 |
$11,855 |
$12,473 |
$619 |
5.2% |
|
2 |
12,456 |
13,279 |
822 |
6.6 |
|
3 |
13,961 |
15,075 |
1,114 |
8.0 |
|
4 |
14,978 |
16,180 |
1,202 |
8.0 |
|
UPP = unduplicated pupil percentage and LCFF = Local Control Funding Formula. |
||||
Increased LCFF Funding Primarily Comes Through Base Grant. Of the $5 billion estimated increase for school districts, roughly $4 billion (80 percent) would be an increase to district base grants. The remaining $1 billion would be provided through supplemental ($550 million) and concentration grants ($460 million).
Shifting Other Programs to Enrollment‑Based Funding Would Cost Almost $800 Million. As Figure 15 shows, we estimate shifting other programs to enrollment‑based funding would increase program costs by almost $800 million. Similar to our estimates of the main LCFF formula, we assume the state replaces ADA with enrollment but makes no other changes to the underlying formulas. (Under current law, a higher student count for ELOP would result in lower per‑student rates for some lower UPP LEAs to keep total costs within existing funding levels. We assume the state provides additional funding to prevent reductions.) The additional funding districts receive from these programs are likely to have similar distributional effects to LCFF funding—a comparatively greater increase funding for districts with lower attendance rates.
Figure 15
Shifting Other Programs to Enrollment Would Cost
Almost $800 Million
(In Millions)
|
Program |
ADA‑Based |
Enrollment‑Based |
Difference |
|
Special Educationa |
$5,683 |
$6,118 |
$435 |
|
ELOP |
4,603 |
4,938 |
335 |
|
K‑12 mandates block grant |
265 |
283 |
18 |
|
Totals |
$10,551 |
$11,339 |
$788 |
|
aIncludes base special education funding and funding for educationally related mental health services. |
|||
|
ADA = average daily attendance and ELOP = Expanded Learning Opportunities Program. |
|||
Under LAO Fiscal Outlook, Growth in the Proposition 98 Guarantee Through 2029‑30 Could Cover Most of the Costs of Transitioning to Enrollment‑Based Funding. As we discuss in our recent brief, The 2026‑27 Budget: Fiscal Outlook for Schools and Community Colleges, the state has limited capacity to fund new school and community college commitments with the projected growth in Proposition 98 funding over the next several years. We project the state will have less than $2 billion in ongoing funding available for new school and community college commitments by 2028‑29. In 2029‑30, the last year of our forecast, we project almost $6 billion would be available for new commitments, consistent with our projections that state revenues and the guarantee will grow more rapidly in that year. Assuming the state sets aside a portion of these funds for community colleges and provides a statutory COLA to K‑12 programs over the next several years, the increases in Proposition 98 funding for schools would be sufficient to cover about 80 percent of the costs of shifting to an enrollment‑based student count. These estimates are sensitive to changes in the state’s General Fund revenues. If revenues decline or grow more slowly than our forecast assumes for the next few years, the guarantee likely could not even support existing programs. On the other hand, the state could have sufficient funding by 2029‑30 to cover the costs of shifting to enrollment‑based funding if revenues grew faster than our projections. The Legislature could provide funding above the minimum guarantee if it wanted to fund the costs of enrollment‑based funding sooner.
State Could Use LCFF Approach to Phase in Costs. Given the costs of shifting to an enrollment‑based student count and the limited funding that likely will be available over the next several years, transitioning to enrollment‑based funding likely would need to be phased in over a multiyear period. The state could phase in funding using an approach similar to what was used to phase in costs of LCFF. Under this approach, the state would calculate the “gap” between current funding levels and the target funding level at full implementation for each LEA and for the state as a whole. As part of the annual budget process, the state would determine the amount of funding it would like to set aside to close the gap and calculate the proportion of the gap that would be closed. Each LEA would then have this same proportion of their gap closed. This approach has several advantages. For example, this approach ensures that LEAs further away from their target receive larger annual funding increases. This approach also provides the state with flexibility to adjust the phase‑in process depending on the amount of funding that is available.
Attendance Implications
Limited Empirical Evidence on Relationship Between State Student Count Methodology and Student Attendance. We did not identify any empirical studies that directly assessed how funding based on attendance, rather than enrollment, impacts student attendance. One exploratory study conducted in 2013 compared several student outcomes in different states, such as attendance rates and graduation rates, based on student count methodologies. However, when drawing comparisons, this study combined states that fund based on attendance with several states that fund based on enrollment. As a result, the findings reveal nothing about whether ADA‑based funding results in better student outcomes than enrollment‑based funding.
Attendance Rates Improved After Enactment of SB 727. Although limited research exists regarding the effects of state student count methodologies, the state’s experience changing its policy around funding excused absences can serve as an instructive example. After this policy change, districts had a greater fiscal incentive to improve their actual attendance since excused absences were no longer funded. The state enacted SB 727 in part because a pilot study showed improvements in actual attendance when districts were not funded for excused absences. After SB 727 was enacted and the policy was implemented, the statewide actual attendance rate increased. Using available ADA and enrollment data, as well as other historical documents, we estimate the statewide attendance rate (not including excused absences) was 92.2 percent in 1996‑97. In 1998‑99, the first year excused absences were no longer funded, attendance rates increased 1.5 percentage points, to about 93.7 percent. An analysis conducted during this period also noted an increase in attendance rates after the implementation of SB 727. Due to data discrepancies, we are not able to produce statewide attendance for subsequent years. Over time, however, statewide attendance rates for school districts and charter schools since the enactment of LCFF averaged 95.7 percent through 2019‑20. (Due to data limitations, we are not able to describe how improvement varied by district type or student subgroup.) The increase in attendance rates immediately after the implementation of SB 727, as well as the higher attendance rates in subsequent years, suggests the policy change likely was a factor in improving attendance statewide. However, given the lack of data available to evaluate the policy, we cannot measure the specific impact of eliminating funding for excused absences. Some of the improvement in attendance rates could have been due to other factors, such as greater awareness of best practices for addressing absenteeism or changing expectations around student attendance. We are also not able to describe the programmatic changes made by LEAs to increase attendance after the enactment of SB 727, as the state did not collect information from LEAs on their efforts to improve attendance.
LEAs Take Various Actions to Improve Attendance. Given the state does not collect information on actions LEAs take to address attendance, we met with several LEAs and other education experts to learn about the strategies LEAs take to support student attendance. In general, LEAs reported many key actions and initiatives they undertake to improve attendance and address chronic absenteeism, many of which have been increased in recent years. These include the following strategies, which generally align with many best practices for addressing chronic absenteeism and promoting attendance.
- Regular Tracking and Monitoring Attendance. Virtually all LEAs reported that they regularly track student attendance during the school year through a combination of daily, weekly, and monthly reviews of attendance data. These reviews typically include school‑level and student‑level analyses. This allows districts to determine patterns of absenteeism, and to provide targeted interventions to students who are on track to being chronically absent.
- Actions to Create a Culture That Supports Regular Attendance. All districts mentioned that part of their attendance improvement strategies included a team or “all‑hands‑on‑deck” approach from staff to establish a culture that promotes student attendance. When teachers, counselors, social workers, administrators, and other staff on‑site are engaged with students, this helps to set a culture where kids feel welcomed at school and makes them more likely to attend. Through these interactions, staff can also highlight the importance of regular student attendance. Districts also highlighted a variety of other strategies, such as providing rewards for schools or students that improve attendance and adjusting the school calendar when a significant number of students are regularly absent (for example, by adopting a longer winter break when a high proportion of families travel during this period).
- Interacting With Students and Families. Districts also reported they engage with students and families to determine underlying causes of absences and connect students and families with services to address reasons for absences. In some cases, this may be done through brief communications with families, such as through text messages or phone calls. Some districts implemented more intensive interventions, such as home visits that can include multiple staff members. This often included connecting students to available school and community resources. In circumstances when students are chronically truant, some LEAs refer students to their local or county SARB.
Many LEAs Are Planning to Use Short‑Term Independent Study and Attendance Recovery to Increase Funded ADA. In our conversations with school districts, all reported that they have been using the additional flexibility to provide short‑term independent study to students when they are not attending in‑person. Districts highlighted that this was a way for students who planned to be absent for a period of time to complete schoolwork they would otherwise miss, and to generate ADA for the district. (Available statewide data does not disaggregate short‑term independent study ADA from other ADA.) Many districts we spoke to also indicated they planned to implement attendance recovery programs in 2025‑26 (when they can begin to receive additional funding) to provide instruction to students who were absent and generate additional ADA. Most commonly, districts indicated they planned on using certificated teachers as part of their ELOP programs to provide attendance recovery to elementary school students. State law requires separate tracking and reporting of ADA generated through attendance recovery, so the state will have information on the additional instruction that is being provided to students who were absent. Preliminary data for the first half of 2025‑26 will be reported to the state by the spring of 2026.
Under an ADA Model, Activities That Improve Attendance Can Help LEAs Generate Additional Funding. Districts currently spend substantial resources and staff time on programs and strategies that improve attendance, as well as provide additional support and instruction to students who are absent. One factor that helps encourage the implementation of these programs and strategies is that they generate additional funding for schools if they help increase ADA. In some cases, the costs of these initiatives are more than offset by the additional revenue they generate through higher ADA, making these initiatives more appealing for LEAs. If the state switches to an enrollment‑based student count, efforts to improve attendance would no longer result in higher levels of funding. This may remove the current fiscal incentive that helps to prioritize strategies that improve attendance. We do not expect LEAs would stop conducting all these activities or immediately reduce programs under enrollment‑based funding, as they understand the importance of regular attendance on student outcomes. Over time, however, LEAs may not prioritize these initiatives to the same degree as they did under ADA‑based funding, particularly when faced with limited resources. During an economic downturn when districts have to consider making program reductions, they may be more likely to reduce initiatives that support attendance, since these initiatives would no longer generate additional funding. Under enrollment‑based funding, districts also may be less likely to provide additional instruction outside of the regular school day or provide support to students who are absent, as they would no longer receive additional funding through short‑term independent study and attendance recovery programs.
Switching to Enrollment‑Based Funding Likely Would Have Adverse Effects on Attendance. Based on our analysis of the information available, we find that shifting to an enrollment‑based student count would likely result in somewhat lower attendance rates over the long run. Our assessment is informed by the statewide increases to attendance after the enactment of SB 727, our conversations with LEAs around actions they take to support attendance, and our assessment of the way ADA‑based funding creates a fiscal incentive for LEAs to prioritize actions that support increased attendance. These changes are not likely to occur immediately, but as LEAs modify their programs over the long term. However, based on the limited data available, we are unable to estimate the magnitude of the policy change on overall attendance, or for different subgroups.
Planning Implications
Enrollment‑Based Funding Would Be More Aligned With District Planning and Somewhat More Predictable. In our conversations with districts, all reported that they use enrollment projections to allocate staff and base funding across their school sites. These enrollment projections are typically based on various demographic and community information, such as changes in the supply of housing within a district’s boundaries. Prior to the pandemic, when attendance rates were more stable, districts could apply an attendance rate adjustment to their enrollment projections to estimate their LCFF funding (for example, by taking 95 percent of their enrollment to project ADA). In recent years, however, as attendance rates have become more uncertain, ADA has become somewhat more difficult to predict. School districts also reported greater concern about events that could affect their ADA, such as student protests and federal deportation efforts—events for which they are not eligible to obtain a waiver. Given districts currently plan using enrollment figures, funding based on enrollment would be more aligned with current budget planning and would be somewhat more predictable.
Due to Hold Harmless Provisions, Attendance Does Not Affect Current Year LCFF for Most Districts and COEs. For the one‑third of school districts whose LCFF allotments are based on their current‑year ADA, the uncertainty around attendance affects their current‑year funding levels. Most school districts and COEs, however, are funded based on their prior‑year ADA, or their average ADA from of the three previous years and are not affected by the uncertainty of their current‑year ADA until future years. Similarly, ADA for purposes of special education funding is based on the higher of the current year, prior year, or second prior year, which means most districts are not affected by current‑year funding declines.
Enrollment Can Be Volatile for Alternative Schools. The school districts we met with generally reported that ADA was more volatile than enrollment. Although students can be absent throughout the year for a variety of reasons, leaving the school is much less common. For some programs, however, enrollment can also vary significantly throughout the year. In particular, alternative schools—such as continuation high schools, juvenile court schools, and opportunity schools—have significant turnover throughout the school year. Data collected by CDE known as the stability rate—the share of students that spent at least 245 days continuously enrolled in one school during an academic year—shows that 91.5 percent of students statewide remained enrolled in one school for the vast majority of the school year. In alternative schools, however, this rate was only 39 percent. The instability in alternative schools is most likely to affect planning for charter schools that primarily operate alternative school programs and COEs. (Most programs that COEs operate are alternative school programs.)
Charter Schools Face Greater Volatility From Attendance‑Based Funding. Since charter schools are not credited with prior‑year or three‑prior‑year student counts, they experience greater uncertainty from attendance‑based funding. Switching to enrollment‑based funding may offer greater stability to charter schools compared with school districts, although those that are alternative schools likely would still be subject to volatility in enrollment.
Administrative Implications
Switching to Enrollment‑Based Funding Unlikely to Significantly Change Ongoing Administrative Workload. The LEAs we spoke with indicated that their student information systems already track both daily attendance and enrollment throughout the school year. Attendance data is collected for funding purposes, but also for purposes of tracking habitually truant students and chronic absenteeism rates. Daily enrollment is necessary for calculating chronic absenteeism rates (although only Census Day and cumulative enrollment are reported to the state). Given daily enrollment is already collected, shifting to an enrollment‑based student count would not require LEAs to collect new data. However, these changes could require one‑time costs for LEAs to adjust information systems to report enrollment to CDE. Shifting away from an ADA‑based student count would not significantly reduce workload with tracking and reporting absences to the state given LEAs would still be required to do so in accordance with compulsory education laws and requirements for calculating chronic absenteeism rates.
Likely One‑Time State Costs to Shift Systems to Enrollment. Similar to the effect on LEAs, shifting to enrollment‑based funding likely would not significantly affect ongoing costs for the state. However, CDE would likely face one‑time costs to update the apportionment system for a new student count. Additionally, CDE would experience one‑time administrative workload associated with providing guidance to districts on reporting enrollment counts. These one‑time costs, would depend on how the state decides to implement an enrollment‑based student count. For example, if the state were to use Census Day enrollment, which is already reported to the state, one‑time costs to the state would likely be minimal. If the state were to use an enrollment count that is not currently reported, implementation would be more costly.
LEAs Could See Lower Administrative Costs Associated With State Funding. Switching to enrollment‑based funding could ease the administrative burden of complying with a few state requirements. For example, complying with the state’s annual financial audit requirements likely would be less burdensome if the state only required auditing of enrollment data and eliminated auditing of attendance data. Complying with independent study requirements also could be less burdensome if the state no longer made funding contingent upon completion of work products. The specific effect on administrative burden would depend upon how the state implemented the change to enrollment‑based funding and whether any new requirements were put in place. For LEAs that offer short‑term independent study and/or attendance recovery programs, switching to an enrollment‑based student count would mean that they would no longer generate additional funding for these activities. This would reduce the administrative costs of complying with the associated tracking and reporting guidelines, but would also likely result in LEAs no longer providing these services to students to the same degree.
Alternatives to Enrollment‑Based Funding
In this section, we discuss three alternatives to shifting to enrollment‑based funding that would maintain the current ADA‑based system. Consistent with the report requirements set in statute, these alternatives would yield similar statewide increases in LCFF costs.
Alternatives Vary in Distributional Effects and Share of Funding That Is Restricted. Figure 16 lists the three alternatives we use to compare with enrollment‑based funding. These alternatives all have roughly the same statewide LCFF costs and maintain the use of ADA, but modify components of LCFF base, supplemental, and concentration grants. We compare these alternatives to a switch to enrollment‑based funding and focus our comparison on two factors: (1) the effects across districts of varying UPP levels, reflecting different distributional outcomes, and (2) the proportion of the increases that are unrestricted base funding, reflecting different levels of flexibility districts would have over the funding. Due to data limitations with charter schools and COEs, our analysis focuses on the effects on school districts.
Figure 16
Selected Alternatives That Maintain ADA‑Based LCFF Funding
|
Option |
Description |
Effects |
|
Alternative 1 |
|
|
|
Alternative 2 |
|
|
|
Alternative 3 |
|
|
|
ADA = average daily attendance; LCFF = Local Control Funding Formula; and UPP = unduplicated pupil percentage. |
||
Alternative 1 Maintains Flexibility for Districts, but Less Targeted to High UPP Districts. As Figure 17 shows, compared with enrollment‑based funding and alternatives 2 and 3, alternative 1—an across‑the‑board increase to LCFF—provides larger funding increases for lower UPP districts (quartiles 1 and 2) and smaller increases for higher UPP districts (quartiles 3 and 4). Conversely, compared to alternatives 2 and 3, alternative 1 provides greater levels of flexibility. As Figure 18 shows, enrollment‑based funding and alternative 1 both provide roughly 80 percent of the increase through base funding. This is because both policy changes do not alter the weights for the components of LCFF that are based on UPP. The main difference between enrollment‑based funding and alternative 1 is the manner in which base funding is distributed across school districts. Enrollment‑based funding would provide larger increases to school districts with lower attendance rates, whereas alternative 1 provides all districts with an equal percent increase.
Figure 17
Alternatives 2 and 3 Provide Larger
Funding Increases to High UPP Districts
Increase in Average LCFF Funding Per Student, by UPP Quartile
|
Quartile |
Enrollment‑ |
Alternative 1 |
Alternative 2 |
Alternative 3 |
|
1 |
5.2% |
7.2% |
2.7% |
4.6% |
|
2 |
6.6 |
7.2 |
5.3 |
6.0 |
|
3 |
8.0 |
7.2 |
8.0 |
7.7 |
|
4 |
8.0 |
7.2 |
9.9 |
8.9 |
|
UPP = unduplicated pupil percentage and LCFF = Local Control Funding Formula. |
||||
Figure 18
Alternative 1 Provides Similar Level of Base Funding to Enrollment
Funding Increases by Grant Type (In Billions)
|
Enrollment |
Alternative 1 |
Alternative 2 |
Alternative 3 |
|
|
Base |
$4.1 |
$4.1 |
— |
$1.8 |
|
Supplemental and Concentration |
1.0 |
1.0 |
$5.1 |
3.3 |
|
Totals |
$5.1 |
$5.1 |
$5.1 |
$5.1 |
|
Share of Increase Coming From Base |
80% |
81% |
— |
36% |
Alternatives 2 and 3 Provide More Targeted Funding to Support High‑Needs Students. As Figure 18 shows, compared to enrollment‑based funding and alternative 1, alternatives 2 and 3 provide more of the funding increases through grants targeted for English learners, low‑income students, and foster youth. Providing more of the increase through supplemental and concentration grant funding would allow the state to target funding to high UPP districts, which have higher chronic absenteeism rates on average, but would place more restrictions on how LEAs could spend additional funds. Under alternative 2, the entire funding increase would be provided through a combination of supplemental and concentration grant funding, with no increase in base funding. Of the alternatives we identified, this approach would provide the largest increases to high UPP districts, although none of the increase would come through base funding. Alternative 3, on the other hand, provides about one‑third of the funding increase through base funding. This approach would provide some level of flexible base funding to all districts, while being more targeted to high UPP districts than switching to an enrollment student count methodology. Providing funding increases through supplemental and concentration funding may be more restrictive for districts with lower UPP levels, as existing regulations more easily allow for higher UPP districts to use supplemental and concentration grant funds for schoolwide or districtwide programs.
Recommendations
Recommend Continuing With ADA‑Based Funding. Overall, our analysis finds that shifting to enrollment‑based funding would be somewhat more predictable and reduce some administrative burdens for LEAs, but likely would have a negative effect on student attendance over the long run. Given attendance rates continue to remain below pre‑pandemic levels and the available research suggests a strong relationship between attendance and student outcomes, we recommend the Legislature maintain its ADA‑based system at this time. Shifting away from ADA‑based funding could hinder efforts to improve attendance and reduce chronic absenteeism levels in schools. One potential concern with an ADA‑based system is that high UPP districts are negatively affected because they tend to serve student groups that historically have had higher absence rates. If the Legislature is interested in providing funding increases that would disproportionally benefit LEAs with higher UPP levels, it could do so by making changes under the existing ADA‑based model that provides higher rates for these LEAs. This would target high UPP districts while maintaining the current ADA‑based system that places greater attention on regular student attendance. (As we discuss in the nearby box, the Legislature could consider changes to improve another key tool used to focus efforts on student attendance: the California school dashboard chronic absenteeism indicator.)
Changes to Chronic Absenteeism Indicator Could Increase Accountability
Chronic Absenteeism for Transitional Kindergarten (TK) Through Grade 8 Is an Indicator on California School Dashboard. As part of the state’s accountability system, districts report various student outcomes, referred to as statewide indicators, which are then displayed on a public website known as the school dashboard. Each statewide indicator is linked to one of eight state priority areas. Outcomes from standardized tests, for example, are part of the student achievement priority area, while chronic absenteeism is one of two indicators (along with the high school graduation rate) used to measure student engagement. Students are identified as chronically absent if they are absent for more than 10 percent of the time they are enrolled at a school. (A student enrolled at a school district for a full academic year is considered chronically absent if they miss 18 or more days of school.) As part of their annual Local Control and Accountability Plans, local education agencies (LEAs) are required to specify actions they will take to meet goals they set for several indicators, including their chronic absenteeism rates. Although the state collects and publishes chronic absenteeism data for all students, the chronic absenteeism rates reported on the dashboard only include data for students in grades TK through 8.
Dashboard Assigns Performance Levels for Statewide Indicators. For each statewide indicator shown on the school dashboard, the state assigns one of five performance levels, with data available by LEA, school, and student subgroup within an LEA or school. These performance levels are based on a combination of overall status and change in performance over the past year. In 2025, 108 (out of over 900) school districts were assigned the lowest performance level in chronic absenteeism for their total student population, while another 388 school districts were assigned the lowest performance level for at least one subgroup. In the same year, 206 (out of more than 1,000) charter schools were assigned the lowest performance level in chronic absenteeism for their entire student population, with an additional 195 assigned the lowest performance level for at least one subgroup. LEAs are identified for differentiated assistance if they have at least one student subgroup that is assigned the lowest performance level in more than one priority area. As part of differentiated assistance, LEAs must examine their root issues and access support to help them improve. To comply with federal accountability rules, the state uses a similar process to identify schools in need of support.
School Dashboard Does Not Provide Accountability for High School Absenteeism. The state brings attention to student attendance in two key ways. First, it funds LEAs based on their average daily attendance. Second, it publishes chronic absenteeism data on the school dashboard and uses this data as part of the state’s approach to identify LEAs that are eligible for differentiated assistance. The latter approach, however, does not measure or track absenteeism at the high school level. The dashboard currently uses chronic absenteeism rates as an indicator of student engagement for grades TK‑8, while the four‑year graduation rate is used for high schools. Based on conversations with the State Board of Education, our understanding is that the state excluded high school absenteeism rates as part of its negotiations with the federal government to ensure compliance with federal Every Student Succeeds Act (ESSA) requirements. Including high school absenteeism rates on the dashboard would have resulted in a larger imbalance of high school indicators compared with elementary school indicators. Under the state’s current ESSA plan, the state has two indicators that only apply to high schools (graduation rates and the College and Career Indicator) and one that only applies to elementary schools (chronic absenteeism). An imbalance of indicators can result in an overidentification of high schools as needing to receive additional support under federal rules.
Legislature Could Consider Ways to Highlight High School Chronic Absenteeism Rates. Increasing transparency and accountability around high school chronic absenteeism rates would help bring greater focus to student attendance, particularly if the state were to shift to enrollment‑based funding. One option would be for the Legislature to require high school absenteeism rates be included in the dashboard. This approach would be well‑aligned with the existing accountability system, but would require the state to revise its ESSA plan and potentially make other changes to its accountability system to remain in compliance with federal government. For example, the state may need to add an indicator for elementary schools or change how indicators are weighted under the current system. Alternatively, the state could identify other ways to highlight high school absenteeism rates outside of the accountability system. For example, the Legislature could require the California Department of Education to separately publish high school absenteeism rates by LEA, school, and student subgroup, similar to how data is disaggregated on the dashboard.
Issues to Consider if Adopting Enrollment‑Based Funding
Although we do not recommend a switch to enrollment‑based funding, in this section we describe several implementation issues the Legislature may want to consider if it were to shift to an enrollment‑based student count.
Enrollment Count Methodology
If State Switches to Enrollment, Recommend Using Enrollment Averaged Across the School Year. If the state switches to an enrollment‑based student count, we recommend the state use enrollment averaged across the school year, similar to how ADA is currently calculated. This approach would account for changes in the number of students served across the whole school year, and would be particularly helpful for LEAs that experience significant fluctuations in enrollment throughout the school year (such as COE and charter schools that operate alternative schools). We do not expect this change to be administratively burdensome to implement, as existing school information systems already collect this information to calculate chronic absenteeism rates. The Legislature also could consider maintaining the existing reporting time lines, where districts must submit data three times a year. Consistent with current practices related to ADA, we recommend any new enrollment count be subject to annual audits.
Consider Setting Specific Rules Around How Enrollment Is Funded. If the Legislature were to adopt enrollment‑based funding, it may want to consider setting specific rules around how enrollment is counted for funding purposes. For example, the Legislature may want to consider setting a policy for how to count students who are concurrently enrolled at two schools, such as a student enrolled in a school district who is temporarily enrolled at a COE‑run juvenile court school. (Under the current funding system, the home district does not generate ADA while the student is receiving instruction at the court school.) The Legislature may also want to establish rules regarding students who are counted as enrolled but never attend during the school year or drop out of school. The specific solutions to these issues would depend on the methodology the state uses to calculate enrollment.
Proposition 98 Calculations
California Constitution Requires ADA for Certain Proposition 98 Calculations. The Constitution sets forth three main tests (formulas) for calculating the Proposition 98 guarantee. Test 1—the most commonly used test over the past 15 years—is based on a share of General Fund revenue and is unaffected by attendance. For Test 2 and Test 3, the state applies the percentage change in ADA to the prior year’s funding level, along with an inflation adjustment. The state has modified the ADA in this calculation several times, notably removing excused absences in 1997‑98 and excluding concurrently enrolled adults in 1993‑94. Using enrollment instead of ADA, however, would likely require voter approval, as the Constitution explicitly references attendance. (The version of Proposition 98 approved by voters in 1988 might have allowed the Legislature to make this change, but an amendment in 1990—Proposition 111—tightened the attendance requirement.)
Enrollment‑Based Funding Is Unlikely to Affect the Guarantee Significantly. Whereas the Constitution requires attendance to calculate the Proposition 98 guarantee, it sets no requirements for LCFF or other state categorical programs. Switching programs to enrollment‑based funding could indirectly affect the guarantee, but only under two specific conditions. First, it would need to affect year‑over‑year attendance growth. For example, if the change caused attendance rates to decline over several years, the annual attendance adjustment in those years would be lower than it would have been otherwise. Conversely, if an enrollment‑based approach does not affect attendance rates, the guarantee would be unaffected. Second, Test 2 or Test 3 would have to be the applicable test. Our November 2025 fiscal outlook, however, projects Test 1 will likely remain operative through the end of our forecast in 2029‑30. This projection is mainly related to declines in births and reductions in the school‑age population—trends that are unlikely to reverse quickly or change in response to enrollment‑based funding.
Statutory Adjustment Could Avoid Any Unintended Reduction in Proposition 98 Guarantee. Although enrollment‑based funding seems unlikely to have much effect on the guarantee, the Legislature could adopt a special adjustment to remove any possibility of a reduction. Specifically, the state could calculate Test 2 and Test 3 using changes in enrollment, then compare those results with the constitutionally required calculations based on changes in attendance. If the enrollment‑based calculation produced a higher funding amount, the law could require a supplemental appropriation equal to the difference. This adjustment would not require voter approval because it involves augmenting the guarantee in certain situations rather than altering the underlying constitutional formulas. Moreover, the law already requires a similar supplement in certain years when revenues are weak. (The state adopted this mechanism in the early 1990s to prevent disproportionate funding reductions during economic downturns.) The state could use this approach during a transition period while districts adjust to enrollment‑based funding, and then repeal it once attendance rates stabilize. Alternatively, the Legislature could, on an annual basis, appropriate more than the guarantee whenever it determines that the constitutional formulas are insufficient to fund its school priorities.
Considerations for Other Programs
Shifting to Enrollment May Require Changes to Other Programs. Several existing programs and state policies rely on the use of attendance. If the state were considering shifting all programs to enrollment, the Legislature may want to consider how this would impact other programs. Below, we identify a few key programs or policies that could be affected by a switch to enrollment‑based funding.
- Independent Study. Currently, LEAs generate ADA from independent study programs when students participate in synchronous instruction and complete coursework. If LEAs were funded based on enrollment, they would receive funding regardless of how much independent study students participate in instruction and complete work. LEAs are currently required to establish procedures for reengaging with students who are not regularly attending or completing work. The Legislature may want to reassess these requirements and consider whether additional requirements should be put in place to ensure students are receiving sufficient support.
- California State Lottery Revenues. State law requires a portion of revenues from the State Lottery to be allocated annually among schools, community colleges, and other public and higher education systems. These requirements were initially established by Proposition 37 (1984) and subsequently amended by the Legislature. The State Controller’s Office allocates available lottery funding to each public education segment using a student‑count measure—ADA for schools and full‑time equivalent enrollment for the other segments. If the state were to begin using school enrollment for these allocations, the total statewide student count for schools would increase and schools would receive a larger share of funding than other segments. The Legislature could consider modifying the allocation so that schools do not receive a larger share. Consistent with the requirements of Proposition 37, any changes to state law would likely require a two‑thirds vote.
- Necessary Small Schools (NSS). The NSS program provides an alternative LCFF base grant formula for districts with ADA of 2,500 or fewer that operate very small schools and that are geographically isolated. The NSS allocation uses funding bands based on the combination of a school’s ADA and its staffing levels, whichever provides the lesser amount. The Legislature may want to consider whether the ADA thresholds should instead be based on enrollment, and consider modifying the bands to minimize changes in funding due to the policy change.
- Funding Determination Process for Nonclassroom‑Based Charter Schools. State law requires charter schools that provide less than 80 percent of their instruction in person to be considered a “nonclassroom‑based” charter school. This determination is currently made based on the proportion of a school’s ADA that is classroom‑based. Student enrollment, by contrast, is not classified as classroom‑based or nonclassroom‑based, and students can receive part of their instruction in person and partly through independent study. If the state shifts to enrollment‑based funding, the Legislature may want to consider creating a new definition that does not use ADA. For example, it could create a definition based on the proportion of a school’s instruction that is provided in the classroom and the proportion provided through independent study.
- ELOP. LEAs receive ELOP funding based on their classroom‑based ADA, and nonclassroom‑based charter schools are ineligible to receive ELOP funding. Given the state does not categorize student enrollment as classroom‑based or nonclassroom‑based, the Legislature may want to create an enrollment‑based definition of in‑person instruction if it wants to continue to restrict funding to classroom‑based programs.
- Programs That Can Generate More Than One Unit of ADA Per Student. In general, a student cannot generate more than one unit of ADA from attending school for a full academic year. However, state law provides exceptions for some specific programs—such as juvenile court schools and Extended School Year services for special education students—that operate longer than a traditional 180‑day school year. (For example, juvenile court schools run by COEs operate on every weekday of the calendar year, except for holidays.) If switching to enrollment, the Legislature may want to consider allowing students enrolled in these programs to generate more than one unit of enrollment. The specific adjustment would depend on the specific enrollment count the Legislature decided to implement.
Options to Support Student Attendance
If the Legislature is interested in adopting an enrollment‑based student count, it may want to consider making other changes to mitigate potential negative effects on student attendance. Below, we describe a few options the state could take to improve attendance under an enrollment‑based funding model.
Require Schools Take Specific Actions to Support Students Who Are at Risk of Being Chronically Absent. To address concerns that LEAs would place less emphasis on attendance, the Legislature could require schools take specific actions to address absenteeism that are aligned with best practices. For example, the Legislature could require that LEAs periodically review attendance data and talk with students and parents when a student is at risk of being chronically absent. These conversations could focus on identifying root causes of attendance issues and emphasize the importance of regular attendance. The Legislature could also require LEAs establish attendance teams and create a plan with a tiered system of interventions, similar to other states. In addition, the Legislature could require LEAs to offer absent students access to additional instructional support outside of the school day, similar to what they might currently receive through attendance recovery programs.
Consider Ways to Maintain Focus on Attendance. If funding is no longer based on student attendance, schools may not monitor attendance trends as closely as they did under an ADA‑based funding system. The Legislature could explore policies that help maintain attention on attendance rates. For example, the state could publish real‑time attendance data for every LEA and school, similar to the approach recently implemented in Rhode Island. Publishing this information could increase transparency and draw greater public attention to changes in student attendance.
Provide One‑Time Grants for Training and Sharing Best Practices. The state could use one‑time Proposition 98 funding to contract with one or more LEAs experienced in implementing effective attendance improvement initiatives to provide training across the state. This approach could help LEAs reflect on their current practices and identify ways to make them more effective. The state could prioritize grant funding for LEAs with the highest rates of chronic absenteeism.
Conclusion
Through its school funding formula, the state establishes important priorities and sets specific requirements for LEAs. We find that shifting to enrollment‑based funding would be somewhat more predictable and less administratively burdensome for schools, but likely would reduce student attendance over the long run. Given attendance rates continue to remain below pre‑pandemic levels and the available research suggests a strong relationship between attendance and student outcomes, we recommend the Legislature maintain its attendance‑based system at this time. As the Legislature considers how to spend additional school funding moving forward, it will want to consider how the benefits and drawbacks of shifting to enrollment‑based funding compare with other approaches, such as increasing funding through the existing attendance‑based funding model. If the Legislature is interested in transitioning to an enrollment‑based model, it will also want to consider changes to other existing programs and policies to ensure they are aligned with the new funding approach, as well as additional actions to mitigate potential negative effects on student attendance.