At the end of last year, the Pew Charitable Trusts published data and analysis on the state-by-state distribution of federal spending in federal fiscal year 2012-13. Until 2010, the U.S. Census Bureau published this information, but it discontinued the report and Pew prepared an analysis to fill the gap. The Pew data show various measures of federal spending in California.
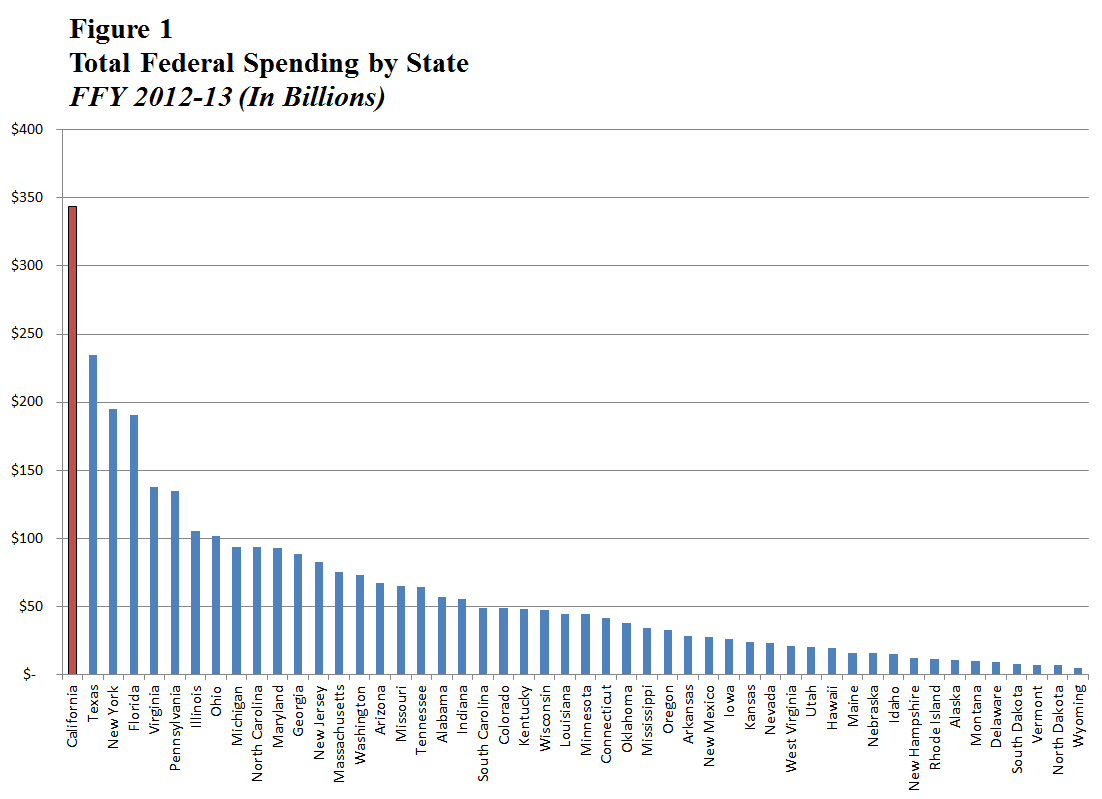
California Receives More Federal Money Than Any Other State. In FFY 2012-13, California received $343 billion in federal spending. As shown in Figure 1, that amount was more than any other state received and about $100 billion more than the next largest recipient of federal funds, Texas. In absolute terms, California receives the largest quantity of federal funding because it has the nation’s largest population.
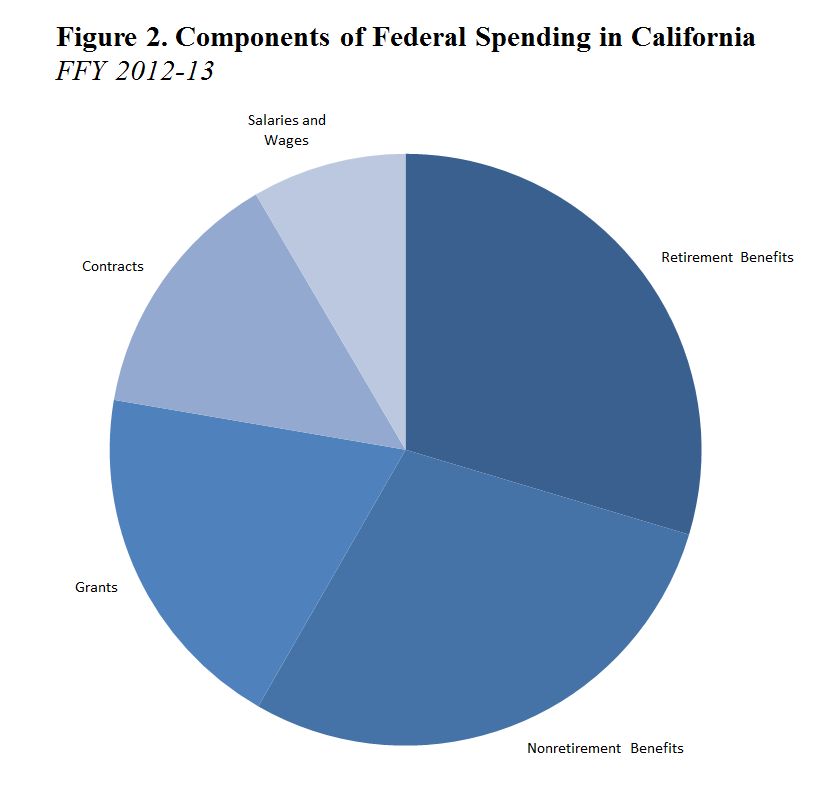
Pew divides this spending into five categories, as shown in Figure 2:
-
Retirement Benefits. Just under one third, or $102 billion, was devoted to retirement benefits, including Social Security payments and veterans benefits.
-
Nonretirement Benefits. Less than one third, or $99 billion, was spent on nonretirement benefits, like Medicare, food assistance, and unemployment insurance.
-
Grants. About one fifth, or $67 billion, was devoted to grants, which includes those for Medicaid and other health care programs, transportation, education, and housing. (To capture federal funding for grants to states, Pew used USAspending.gov—a site devoted to federal spending transparency. The site has well-known problems with data quality, and some of these issues may have affected Pew’s results.)
-
Contracts. About one seventh, or $48 billion, included money for contracts for the purchases of goods and services, like military and medical equipment.
-
Salaries and Wages. Finally, less than one tenth, or $29 billion, was spent on salaries and wages for federal employees, including military personnel. (Pew measured salaries and wages using sources that report salaries and wages by place of employment, rather than residency, which could distort this measure.)
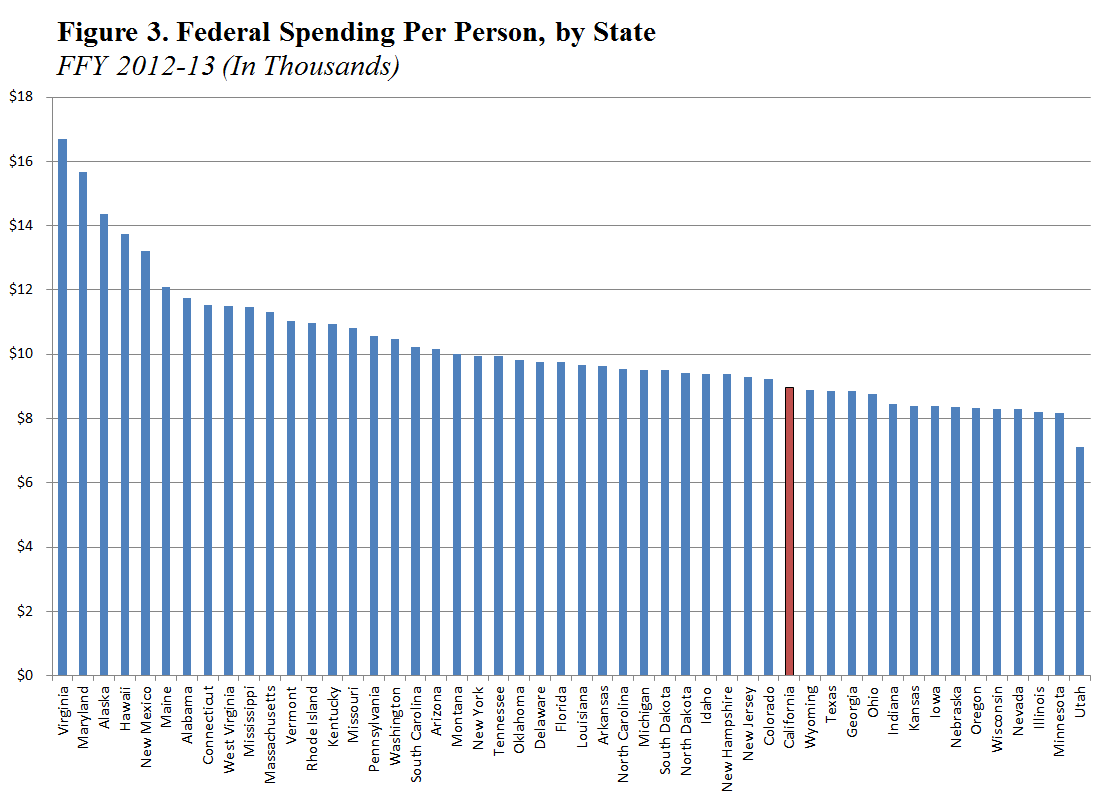
Compared to Other States, California Receives a Small Amount of Federal Money Per Person. As displayed in Figure 3, FFY 2012-13 federal spending in California was $8,967 per person, lower than the national average of $9,961. Based on this measure, California ranks 37th. In part, this ranking is below average because California has a smaller proportion of retirees. About 10.7 percent of California’s population is over the age of 65, which is lower than the national average of 12.4 percent and ranks the state 45th overall. We can also see this demographic difference reflected in California’s per person federal funds for retirement benefits. Per person spending on retiree benefits in California is $2,657, much lower than the national average of $3,357, which ranks the state second to last on this measure (only Utah receives fewer retirement funds per person).
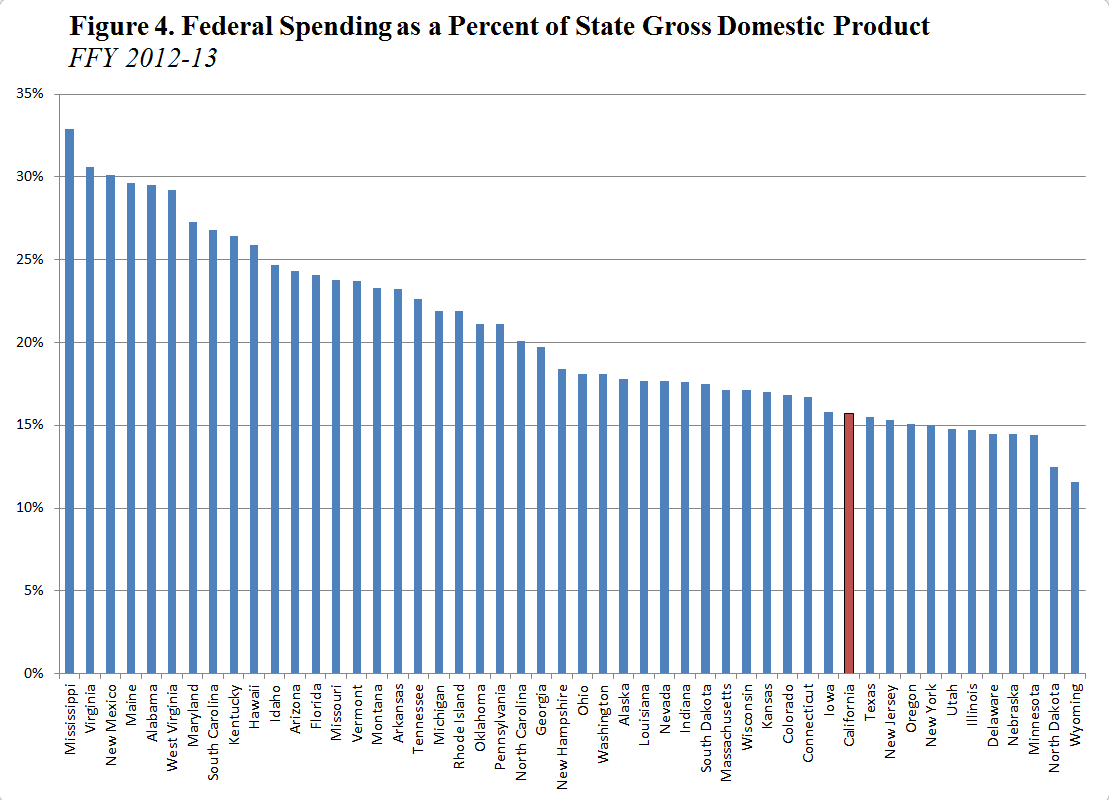
Compared to Other States, Federal Spending Also Accounts for Small Share of California’s Economy. As shown in Figure 4, federal funding is equivalent to less than 16 percent of California’s statewide economic activity, which is lower than the national average of 19 percent. These shares range from about 33 percent in Mississippi to less than 12 percent in Wyoming. Using this measure, California ranks 39th. We can explain this relatively low ranking with California’s relative economic size and wealth. California has a large economy in part because its population is large, but also because Californians have higher incomes relative to the rest of the United States. In 2012, for example, California’s income per capita was about $44,980, higher than the U.S. average of $42,693, ranking the state 8th overall.