Introduction
Special education is the catch–all term that encompasses the specialized services that schools provide for disabled students. Policymakers might have several reasons for seeking a deeper understanding of the state’s approach to delivering special education. First, a notable share—roughly 10 percent—of California’s K–12 students receive special education services. As such, the effectiveness of these services relates directly to the academic outcomes of almost 700,000 of the state’s children. Second, special education is one of the most complicated and regulated areas of K–12 education, with multiple sets of federal and state laws governing how schools must provide services. Finally, special education is among the most significant areas of K–12 expenditures, supported by a combination of the single largest state categorical allocation, one of the biggest federal education grants, and a substantial portion of local school budgets.
This report is intended to provide the Legislature and public with an overview of the state’s approach to educating disabled students. It provides a “primer–style” review—conveying information on special education laws, affected students, services, and funding. We also describe the academic outcomes of the students who receive these special services. Additionally, the end of the report includes a glossary defining some common terms related to special education.
What Is Special Education?
Public Schools Must Provide Special Support for Disabled Students. Since 1975, federal law has required public schools to make special efforts to educate disabled students. Revised and reauthorized as the Individuals with Disabilities Education Act (IDEA) in 2004, federal special education law requires local educational agencies (LEAs) to provide “specially defined instruction, and related services, at no cost to parents, to meet the unique needs of a child with a disability.” (Throughout this report, we use the term “special education” to refer to both special instruction and related services, such as speech or behavioral therapy.) These services are in addition to what a nondisabled student receives. The IDEA requires schools to provide these special supports to children with disabilities from age 3 until age 22, or until they graduate from high school, whichever happens first. (The IDEA also guarantees some early intervention services for infants and toddlers with developmental disabilities, but the state’s Regional Centers, not schools, typically are tasked with providing these services.)
Both Federal and State Laws Govern Special Education. Most special education requirements are contained in federal law, although the state Legislature also has passed some additional laws governing how California schools must serve disabled students. Generally, state special education laws make relatively minor additions to the more substantial federal requirements. For example, whereas the federal entitlement for services ends on a student’s 22nd birthday, California law extends services for 22–year–old students through the end of that school term.
Who Receives Special Education Services?
Not all disabled children need special education services. Below, we discuss the process for identifying which students require special education services and the types of disabilities that commonly affect these students.
How Do Schools Decide Which Students Require Special Education Services?
Schools First Must Try to Meet Students’ Needs Within the General Education Program. A student cannot qualify to receive special education services until after the school has tried to meet his or her needs within the parameters of the general education program. Educators typically attempt a series of informal strategies to address struggling students’ needs before employing the formal special education process. Two such approaches include Student Study Teams (SSTs) and Response to Intervention (RtI). The SST—a group that usually includes the student’s school–site administrator, teacher, and parent—typically discusses the student’s progress and identifies in–class strategies for the classroom teacher to try. The RtI is an instructional approach designed to identify struggling students and provide interventions explicitly targeted to meet their needs.
Schools Evaluate Whether Student Has Disability That Requires Special Education Services. If LEAs determine that general education programs cannot adequately meet a student’s needs, they next refer the student for a professional evaluation to see if he or she qualifies to receive special education. Once the LEA makes the referral and the parent consents, the law requires that the evaluation be conducted within 60 days. The evaluator assesses whether the student has a disability and whether that disability interferes with the student’s education. Federal law only requires schools to provide special education services to students who meet both of these criteria.
Students’ IEPs Define Their Special Education Services. Once an evaluator recommends that special education services would be appropriate, a team of stakeholders come together to prepare an IEP—an individualized written statement defining the services the LEA will provide for the student. Federal and state laws outline the IEP process, including setting timelines for completing and reviewing the plan (at least annually, but more frequently if a student’s needs change); specifying what the plan should include (described in Figure 1); and designating required IEP team participants. An IEP team typically includes the student’s parents, a school administrator, a special education teacher or service provider, the student’s general education teacher, the evaluator who determined the student’s eligibility for services, and—when appropriate—the student. The IEP becomes a legal document requiring the LEA to provide the services described for the SWD. (Throughout the remainder of this report, we use the term SWD to refer to disabled students who have formally qualified to receive special education services.)
Figure 1
Required Components of Individualized Education Programs
|
|
- Current Status. The child’s present level of academic achievement and functional performance.
|
- Goals. Measurable annual goals for the child’s academic and functional performance.
|
- Progress Measures. How progress towards meeting annual goals will be measured.
|
- Services to Be Provided. Special education and related services to be provided, such as supplementary services and/or program modifications for the child. Details must include the projected beginning date, frequency, location, and duration of the services to be provided.
|
- Inclusion in Mainstream Setting. The extent to which the child will/will not participate with nondisabled children in the regular class.
|
- Assessment Plan. Accommodations necessary for child to participate in state and district assessments or alternate assessments necessary to measure the child’s academic achievement and functional performance.
|
- Additional Considerations. As appropriate: employment or career goals, alternative course of study for grade promotion and high school graduation, plan for transitioning to general education or postsecondary activities, specialized equipment or transportation needs, goals for learning English, and/or extended school–year services.
|
Section 504 Plans Describe Noninstructional Accommodations. Some SWDs who need other special accommodations to fully participate in school activities may have a Section 504 Plan in addition to, or instead of, an IEP. Section 504 Plans, which also are federal entitlements for eligible students, typically cover noninstructional modifications like wheelchair ramps, blood sugar monitoring, or tape recorders for taking notes.
Students Attending Private Schools Also Are Entitled to Special Education Services. Students with disabilities attending private schools also have the right to access publicly funded special education services. Those services, however, frequently are provided in the public school setting and may be less extensive than what would be available if the student opted to enroll in public school full time.
What Types of Disabilities Affect Students?
Federal Law Has 13 Disability Classifications. To be eligible for special education services under federal law, students must have a primary disability that falls into one of the 13 categories listed in Figure 2. The figure shows that about 686,000 SWDs ages 3 to 22 receive special education services in California. About 618,000 are in grades K–12, comprising about 10 percent of the state’s overall K–12 public school enrollment.
Figure 2
About 10 Percent of California Students Have Disabilities Affecting Their Education
2011–12
|
Disability
|
Number of SWDsa
|
Percent of SWDs
|
Percent of Total K–12 Population
|
|
Specific learning disabilityb
|
278,698
|
41%
|
4.4%
|
|
Speech or language impairment
|
164,600
|
24
|
2.1
|
|
Autism
|
71,825
|
10
|
1.0
|
|
Other health impairmentc
|
61,843
|
9
|
0.9
|
|
Mental retardation
|
43,303
|
6
|
0.5
|
|
Emotional disturbance
|
25,984
|
4
|
0.4
|
|
Orthopedic impairment
|
14,261
|
2
|
0.2
|
|
Hard of hearing
|
9,991
|
1
|
0.1
|
|
Multiple disability
|
5,643
|
1
|
0.1
|
|
Visual impairment
|
4,327
|
1
|
0.1
|
|
Deaf
|
3,946
|
1
|
0.1
|
|
Traumatic brain injury
|
1,771
|
—d
|
—e
|
|
Deaf and blind
|
160
|
—d
|
—e
|
|
Totals
|
686,352
|
100%
|
9.9%
|
Learning Disabilities Are Identified Most Frequently. As shown in the figure, 41 percent of the state’s SWDs and over 4 percent of all K–12 students are identified as having specific learning disabilities. These are disorders affecting one or more of the basic processes involved in understanding/using language or performing mathematical calculations. (Dyslexia is one commonly identified learning disability.) The next largest category—speech or language impairments—affects almost one–quarter of SWDs. Autism affects 10 percent of SWDs. Rarer disability categories include students who are blind, deaf, or have traumatic brain injuries. Students with these less common disabilities often require more intensive and expensive special education services.
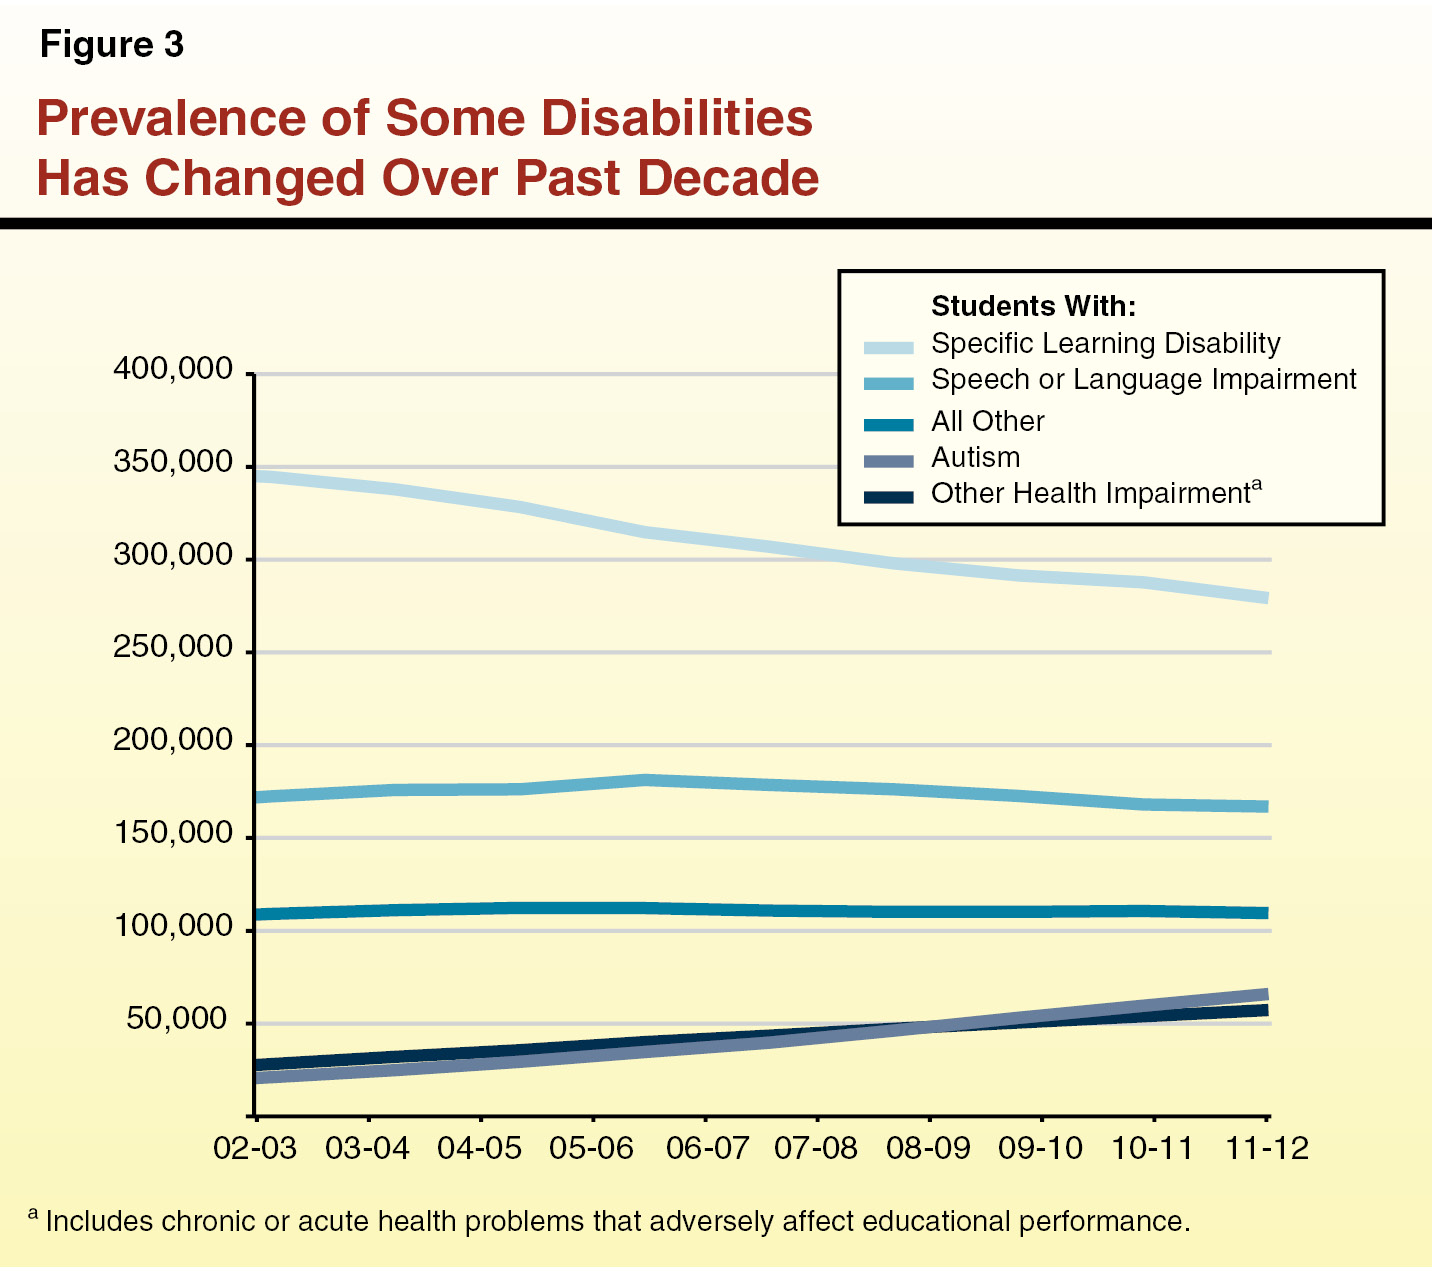
Prevalence of Some Disabilities Has Changed Over Past Decade. Figure 3 displays the number of California students identified in various disability categories over the past ten years. The figure shows that while the prevalence of many disabilities has stayed relatively constant, the number of students identified with specific learning disabilities has dropped by almost 20 percent. In contrast, while the overall prevalence of autism and other health impairments still is relatively rare, the number of students diagnosed with these disabilities has increased notably over the past decade—by 241 percent and 120 percent, respectively. While California’s identification rates vary somewhat from other states, these general trends also are visible across the nation. Experts believe these changes are partially related to evolving diagnoses and instructional practices. For example, some children who might previously have been classified with learning disabilities now are receiving early and intensive instructional interventions and avoiding special education designations. Some of the trends—such as the dramatic growth in autism—remain more difficult to explain.
What Special Education Services Do Students Receive?
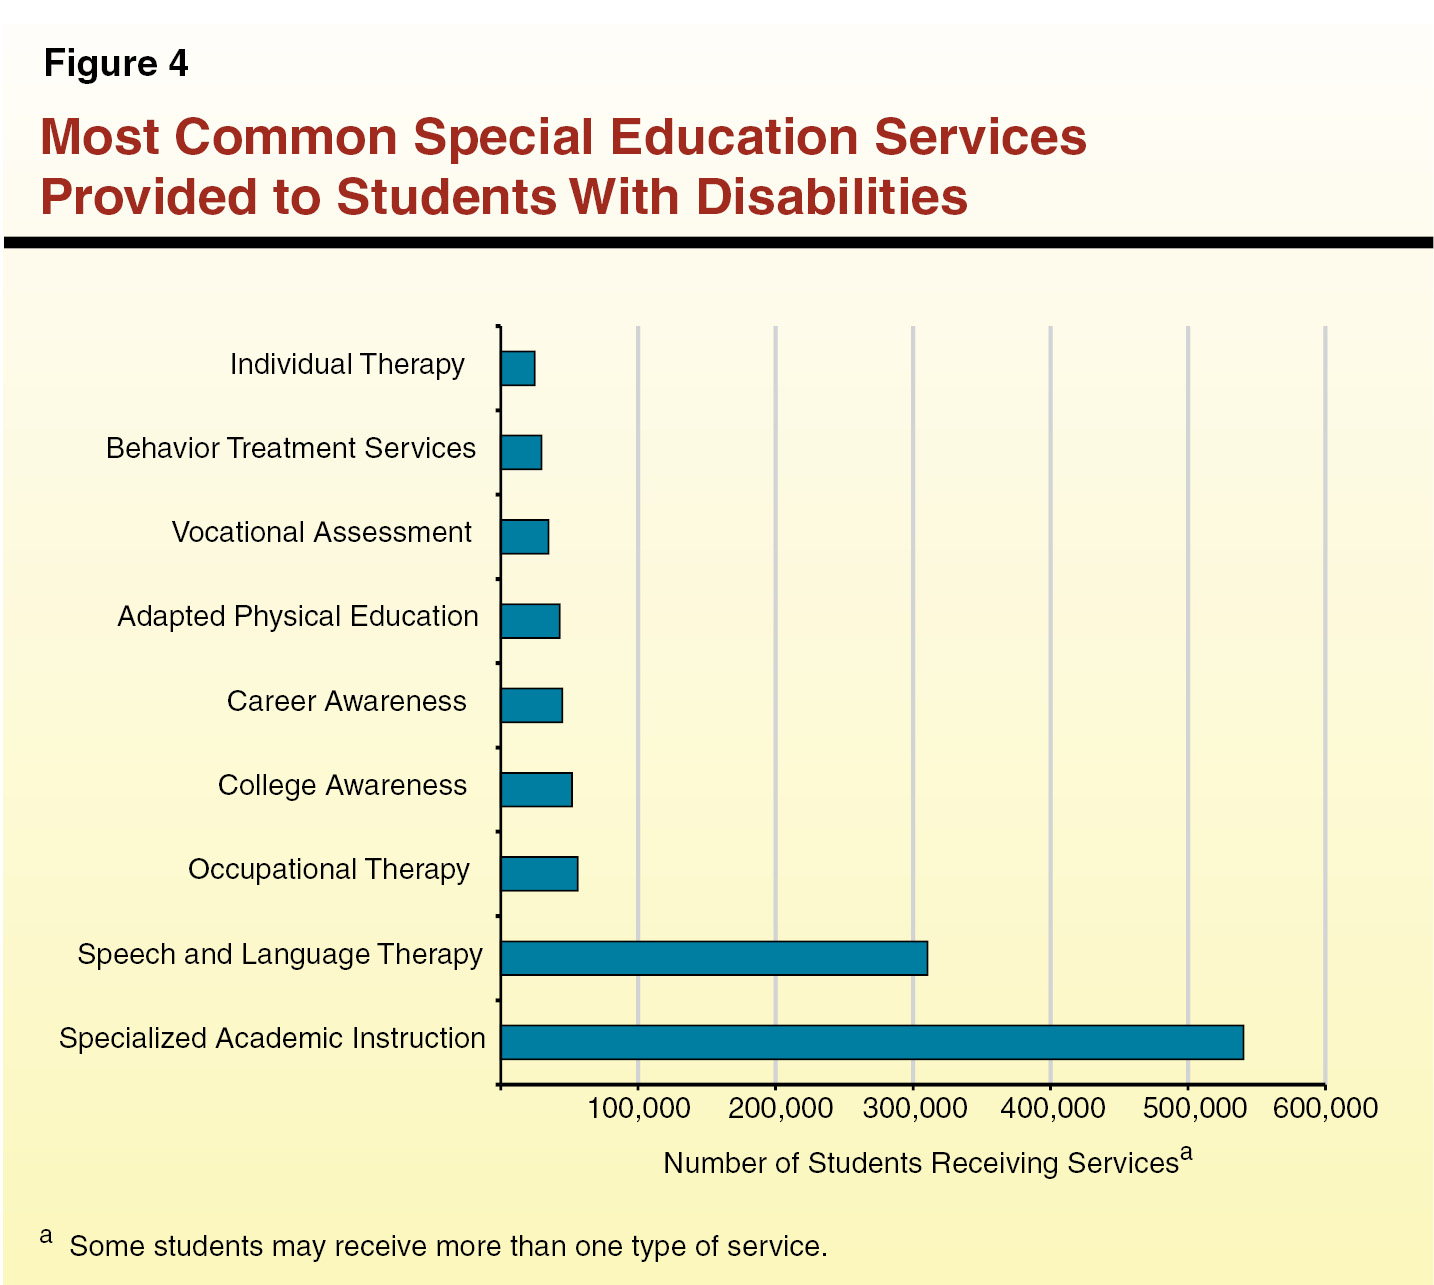
Services for SWDs Vary Based on Individual Student Needs. Figure 4 displays the most frequently provided special education services. As shown, specialized academic instruction is the most common service. This category includes any kind of specific practice that adapts the content, methodology, or delivery of instruction to help SWDs access the general curriculum. Examples include one–to–one tutoring, specialized instruction in a separate classroom, or modified assignments. Other commonly provided services include speech and language assistance, career and college awareness activities, and various types of therapies for physical and psychological needs that may be impeding a SWD’s educational attainment.
Older SWDs Receive Services to Help Transition to Adulthood. One of the IDEA’s goals is to prepare SWDs for success in life after high school, when the federal entitlement to special education services typically ends. As such, beginning when students are age 16, LEAs are required to develop specific services in IEPs to help SWDs prepare for the transition to postsecondary activities. Transitional services typically include vocational and career readiness activities, college counseling, and training in independent living skills. The state provides some funding specifically targeted for these types of activities, including the “WorkAbility” program and specialized Regional Occupational Center/Program services.
Where Are Special Education Services Provided?
Federal Law Encourages LEAs to Educate SWDs in Mainstream Settings. Federal law requires that SWDs be educated in separate settings only when the nature or severity of their disabilities is such that the regular educational environment is not practical, even with the use of supplementary aids and services. Educating SWDs alongside their nondisabled peers often is referred to as “inclusion” or “mainstreaming.” Based on this principle of the “least restrictive environment” (LRE), around half of California’s SWDs spend at least 80 percent of their time in regular classrooms. This rate is somewhat lower, however, than most other states. On average, about 60 percent of SWDs across the country spend at least 80 percent of their instructional time in regular classrooms. Accordingly, California’s annual federal performance review for special education has set a goal of increasing inclusion rates even further—to at least three–quarters of SWDs being in the regular classroom for 80 percent of the day.
Most SWDs Receive Specialized Services in Settings Other Than the Regular Classroom. Rather than focusing on student time, a somewhat different but related metric focuses on the extent to which special education services are delivered in the regular classroom. One reason California fails to meet federal LRE targets is that only about one–quarter of its special education services are delivered in the regular classroom. By comparison, about half of specialized services are delivered at SWDs’ regular schools but in separate classrooms. These latter services consist of part–day “pull–outs” from or supplements to regular classroom instruction (for students with less severe needs) as well as “special day” classes (for students who need more intensive accommodations). Students in special day classes typically spend most or all of their days in a specially designed instructional setting. The remaining one–quarter of special education services are provided at locations other than the regular school. For students with very severe disabilities, services sometimes are offered at district–operated disability centers, specially certified nonpublic schools, or residential facilities. Other typical off–site locations include therapists’ offices. Teachers and service providers who work with SWDs must hold—or be supervised by someone who holds—special credentials from the California Commission on Teacher Credentialing.
How Is Special Education Organized in California?
In General, State Uses Regional Structure to Organize Special Education. Providing individualized services for SWDs—particularly for students with severe or low–incidence disabilities—can be costly and difficult for individual LEAs, especially small LEAs with limited fiscal and staffing resources. Because economies of scale often improve both programmatic outcomes and cost–effectiveness, special education funding and some services typically are administered regionally rather than by individual school districts or charter schools. The state distributes special education funding to 127 SELPAs, rather than to the approximately 1,000 LEAs in the state. State law requires that every school district, COE, and charter school belong to a SELPA.
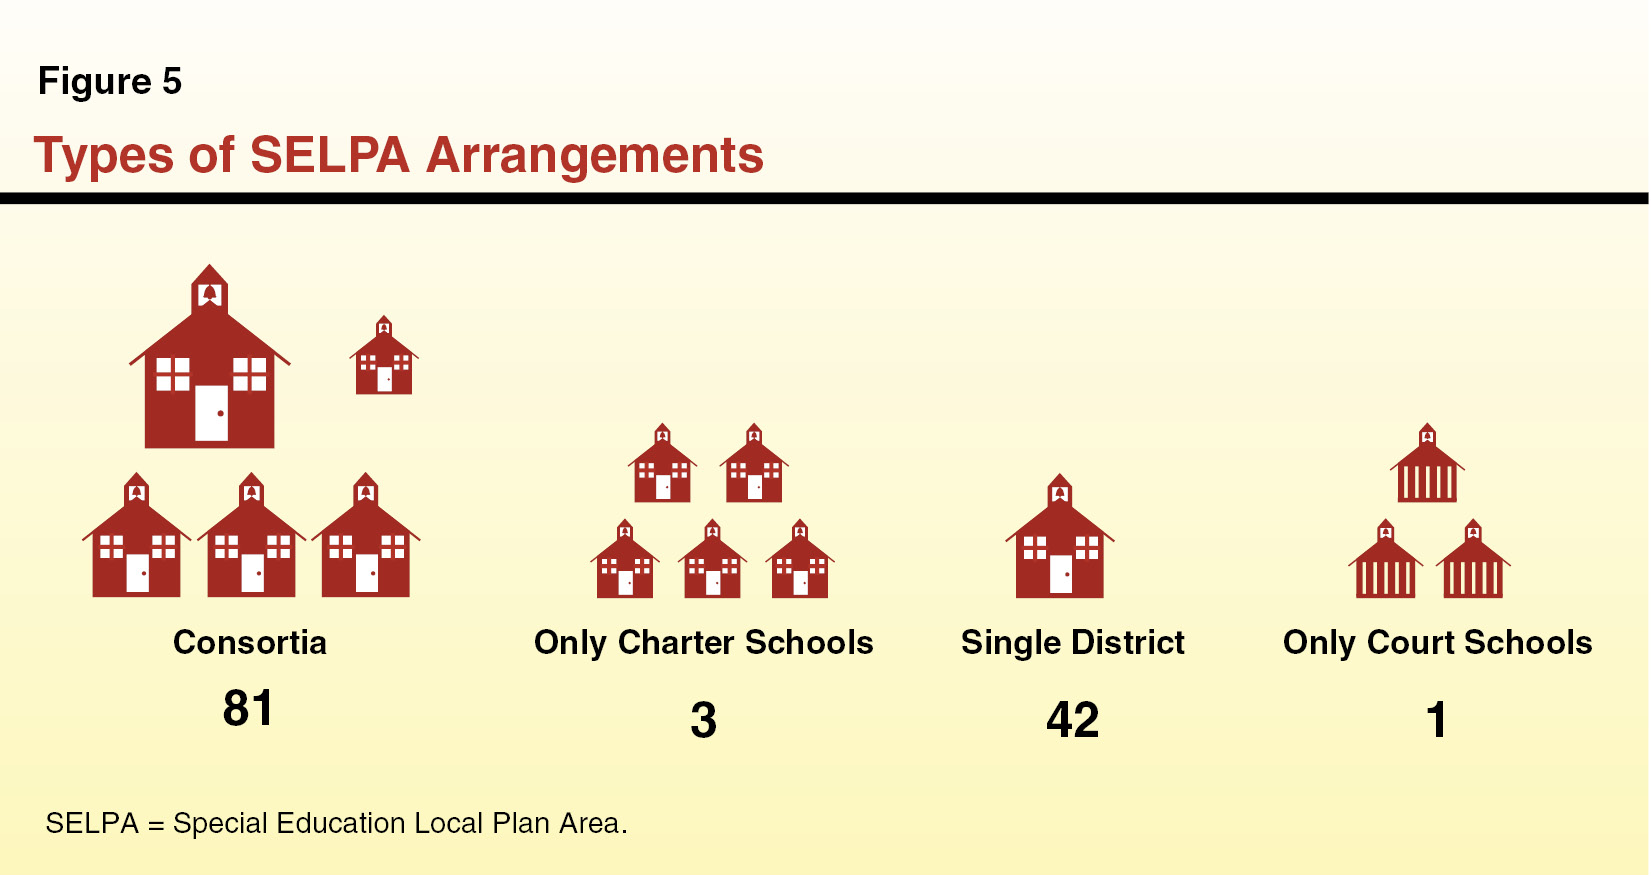
SELPAs Organized in One of Four Ways. As shown in Figure 5, LEAs have arranged themselves into four distinct types of SELPA configurations. Most (81) are consortia of nearby districts, COEs, and charter schools. In these consortia, one entity—often the COE—is designated to receive funding, facilitate coordination, and meet state and federal data reporting requirements. In contrast to the consortia model, 42 school districts, including many of the state’s largest, have opted to form their own independent SELPAs. (A LEA must provide one–year notice if it plans to leave one SELPA and join another, and it must receive approval from the state in order to establish a new SELPA.) Three SELPAs—run out of COEs in El Dorado, Los Angeles, and Sonoma counties—consist exclusively of charter schools. Finally, one SELPA consists solely of court schools in Los Angeles County. The state’s SELPAs vary notably in size. In 2011–12, the state’s largest SELPA (Los Angeles Unified) served almost 82,300 SWDs, while the smallest (Sierra County SELPA) served 44 SWDs.
An Increasing Number of Charter Schools Participate in Charter–Only SELPAs. Charter schools can choose to organize special education services in three different ways: as a school of its authorizing school district, as an independent LEA member of a consortia SELPA, or as a LEA member of one of the three charter–only SELPAs. Charter schools that opt for LEA status—either within a consortia SELPA or as a member of a charter–only SELPA—assume legal responsibility for ensuring their SWDs receive the special services to which they are entitled under federal law. Charter schools increasingly are opting for the third option. The El Dorado County charter–only SELPA grew from 23 charter school members in 2008–09 to 138 charter school members in 2011–12. These schools are located across the state, not just in El Dorado County. The California Department of Education (CDE) also is anticipating increased membership in the two more newly established charter–only SELPAs in Los Angeles and Sonoma counties.
Consortia SELPAs Frequently Offer Some Regionalized Services. While single–district SELPAs typically serve all of their SWDs directly, consortia SELPAs often pool resources to offer some regionalized special education services on behalf of member LEAs. For example, consortia SELPAs frequently organize professional development for teachers, preschool programs, and services for students with low–incidence disabilities at the regional level. Even if members of consortia SELPAs decide to provide some special education services on a regional basis, federal law still holds each LEA ultimately responsible for ensuring SWDs are served appropriately.
Charter–Only SELPAs’ Service Model Typically Differs From Regional Consortia SELPAs. Because charter–only SELPAs can include charter schools from across the state, their service model typically differs from those of traditional consortia SELPAs, which contain members from the same geographic region. Specifically, individual members of charter–only SELPAs typically run their own special education services, by either hiring or contracting with qualified staff. Some charter schools do seek economies of scale by forming special education service collaboratives outside of the traditional SELPA structure, either with other charter schools or nearby school districts. Unlike with traditional SELPAs, however, the COEs that administer charter–only SELPAs typically do not organize such collaborative arrangements.
How Is Special Education Funded in California?
Special education is among the most significant areas of K–12 expenditures. Below, we discuss the sources that fund special education, how much special education services cost to provide, how the state distributes funds to SELPAs, and how SELPAs distribute funds to LEAs.
Which Funding Sources Support Special Education?
Services Supported by Federal, State, and Local Funds. Special education services are subsidized by a combination of three funding sources—federal, state, and local. Federal IDEA and state funds each are provided through discrete special education categorical grants. The state grant (which is comprised of both state General Fund and local property tax revenues) counts towards the Proposition 98 school funding requirement. The “local contribution” represents spending from LEAs’ unrestricted general funds.
How Much Do Special Education Services Cost?
Dedicated Special Education Funds Intended to Support the Excess Costs of Educating SWDs. Local educational agencies are allocated billions of dollars to provide an educational program—including teachers, instructional materials, academic support, and enrichment activities—for all students, including SWDs. To the degree their disabilities cause SWDs to require additional services beyond what mainstream students receive, LEAs use federal IDEA and state special education categorical funds to provide such services. That is, federal and state special education funds are not intended to support the full costs of educating a SWD—just the excess costs resulting from the need to address his or her disabilities. (See the nearby box for a discussion of this and another common misconception regarding local special education expenditures.) Because federal and state special education funds typically are not sufficient to cover the costs of all IEP–required services, local LEAs spend from their local unrestricted general funds to make up the difference.
Misconceptions About “Encroachment”
Some local educational agencies (LEAs) complain that local contributions for special education “encroach” upon their general education programs, sometimes implying that any local dollar spent towards educating a student with disabilities (SWD) imposes unfair expenditure requirements on their general purpose budgets. This argument, however, is a mischaracterization of both federal and state laws. Federal Individuals with Disabilities Education Act (IDEA) and state special education categorical funds never were intended to cover the full costs of educating a SWD—instead the bulk of the “regular” education costs are intended to be covered using local revenue limit and categorical funding, just as for nondisabled students. Moreover, federal IDEA and state special education categorical funds never were intended to fully cover the excess costs of educating a SWD—the special education funding model always has been predicated on a three–way cost–sharing model, including local sources. Despite this basic design of the funding model, LEAs sometimes express frustration that their local share of special education costs is too high. This frustration tends to increase as their local share of special education costs increases, as this leaves them with fewer resources to serve other students.
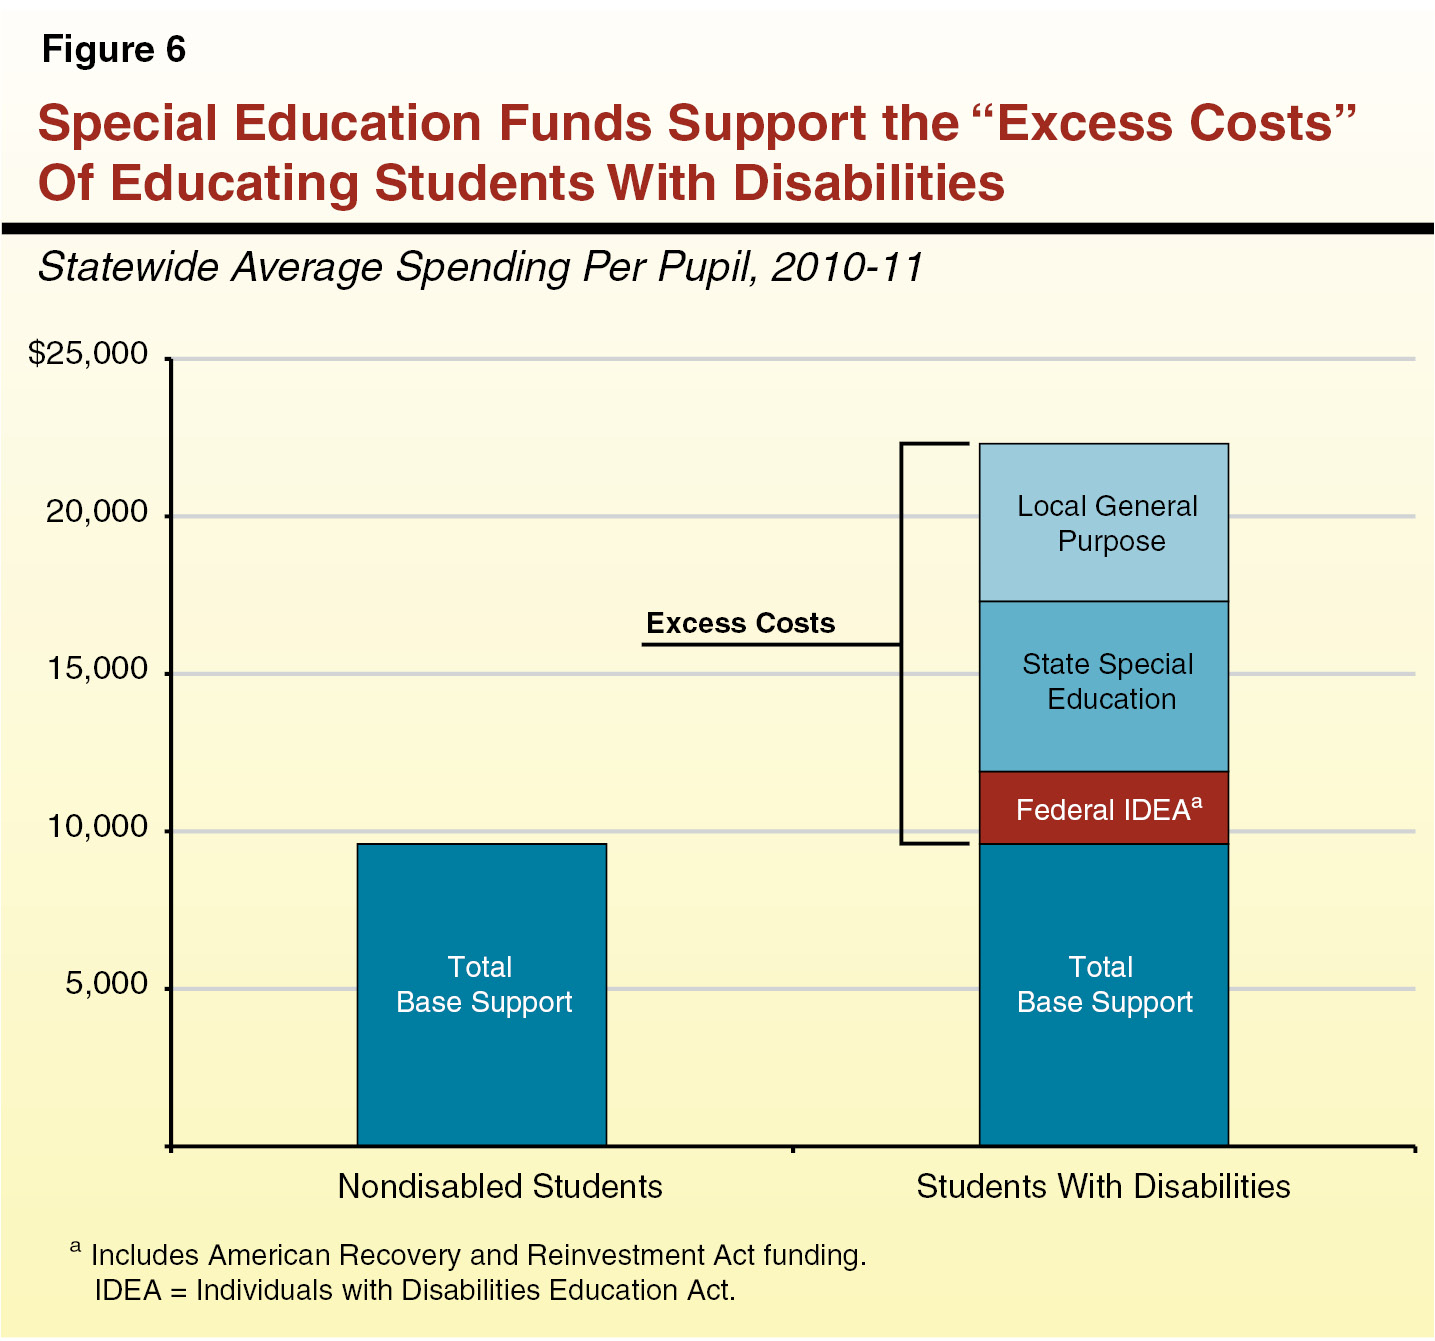
Average Costs of Educating SWDs More Than Double Those of Mainstream Students. Figure 6 illustrates the concept of excess costs. The figure shows that in 2010–11, LEAs spent an average of roughly $9,600 in total funds per nondisabled student and more than twice as much, about $22,300, per SWD. The additional $12,700 to provide special IEP–required services for SWDs was supported by an average of about $2,300 in federal funds, about $5,400 in state funds, and about $5,000 local funds. While $12,700 was the approximate statewide average excess cost for an SWD, it is important to note that most SWDs require less severe, less costly services, whereas some students require intensive interventions that cost notably more than $12,700 a year.
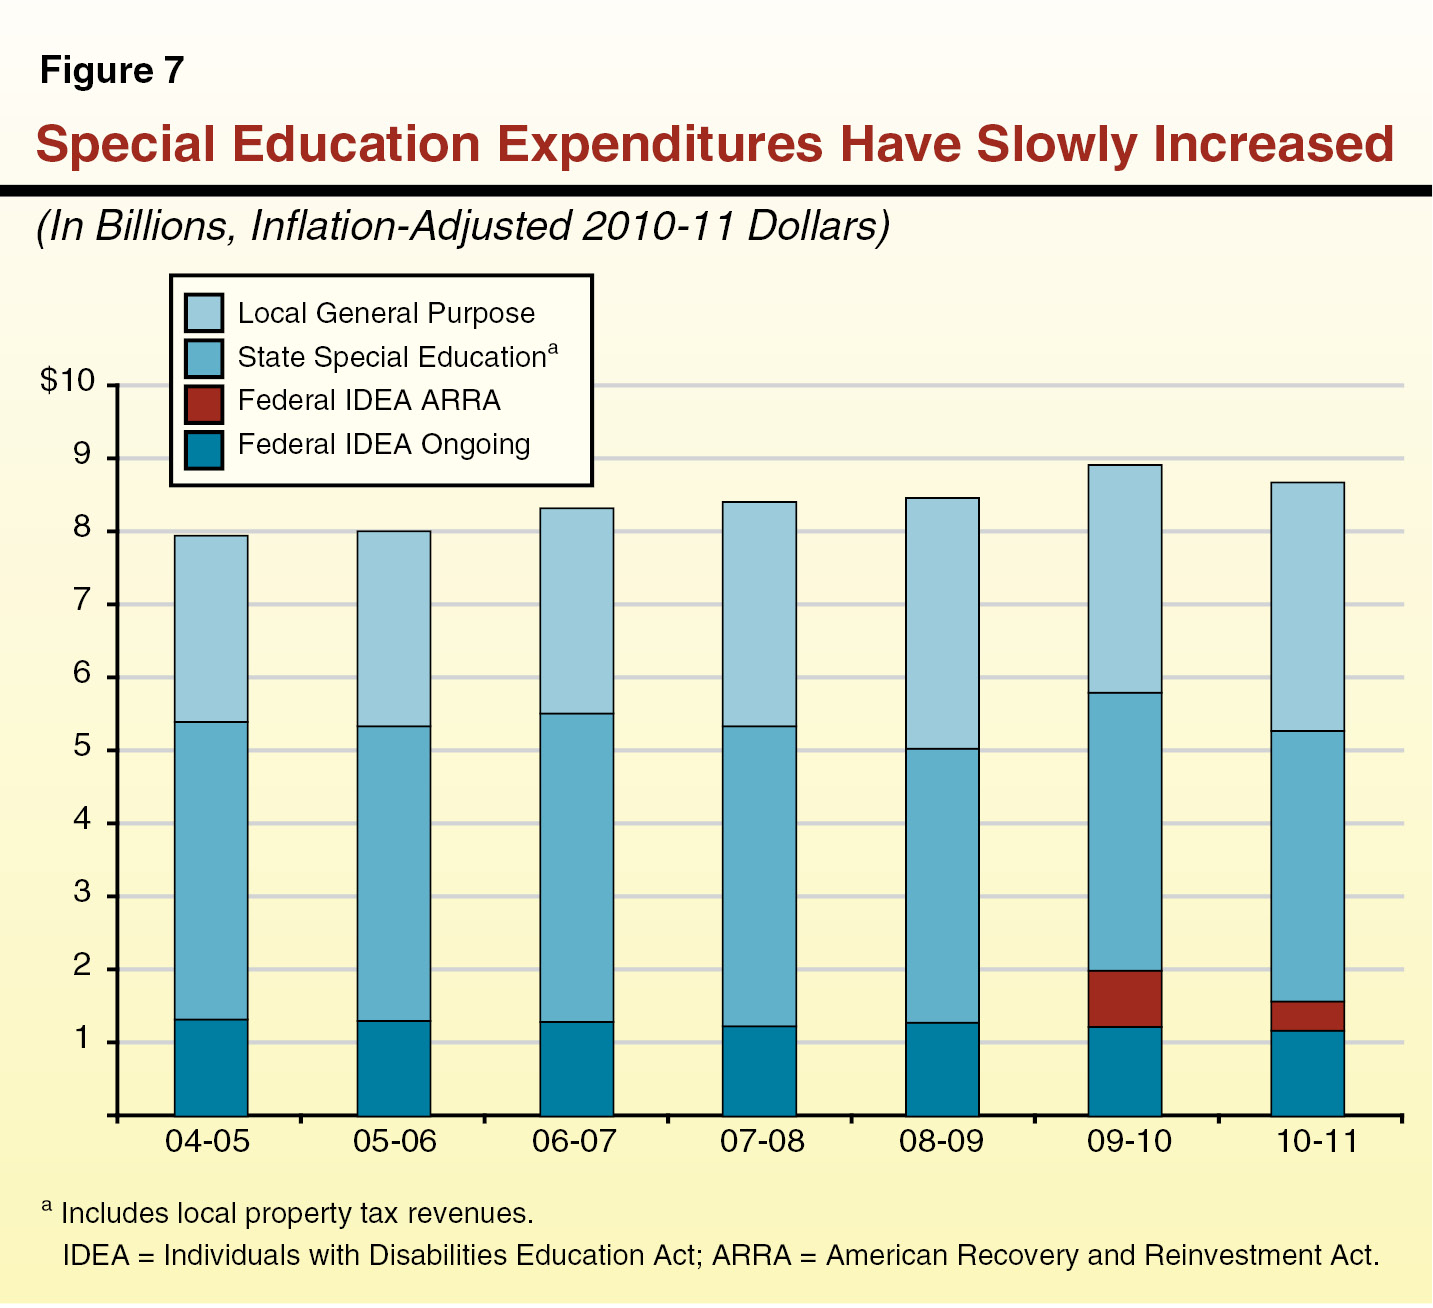
Excess Costs of Educating SWDs Have Slowly Increased Over Past Several Years. Figure 7 displays total special education expenditures from federal, state, and local funds between 2004–05 and 2010–11, adjusted for inflation. (While these data are self–reported by LEAs and may contain some inconsistencies, they represent the best available proxy for calculating the excess costs associated with educating SWDs.) In 2010–11, total special education expenditures were covered by $3.7 billion in state funds (including local property tax revenues), $3.4 billion in local general purpose funds, and $1.6 billion in federal funds. As illustrated in the figure, inflation–adjusted expenditures increased by an average of 2 percent annually over the period, growing by a total of about 9 percent. The increases likely are due to a variety of factors, including the increasing prevalence of students with severe disabilities like autism who require more intensive and expensive services. Notably, adjusted expenditures dropped slightly—by 3 percent—between 2009–10 and 2010–11. The figure also shows that the federal government provided additional short–term funds for special education through the American Recovery and Reinvestment Act (ARRA) in 2009–10 and 2010–11.
Local Budgets Have Covered an Increasing Share of Special Education Costs. Figure 8 compares the proportion of special education expenditures covered by local, state, and federal funds in 2004–05 and in 2010–11. As shown in the figure, the share of overall costs funded through local contributions grew from 32 percent to 39 percent, while the shares covered by state and ongoing federal funds each declined. This is due to the combination of increasing overall costs and relatively flat state and federal funding. Moreover, even if costs have remained flat in 2011–12 and 2012–13 (years for which data are not yet available), the local share of costs likely has grown since LEAs have had to backfill for the expiration of short–term federal ARRA funds.
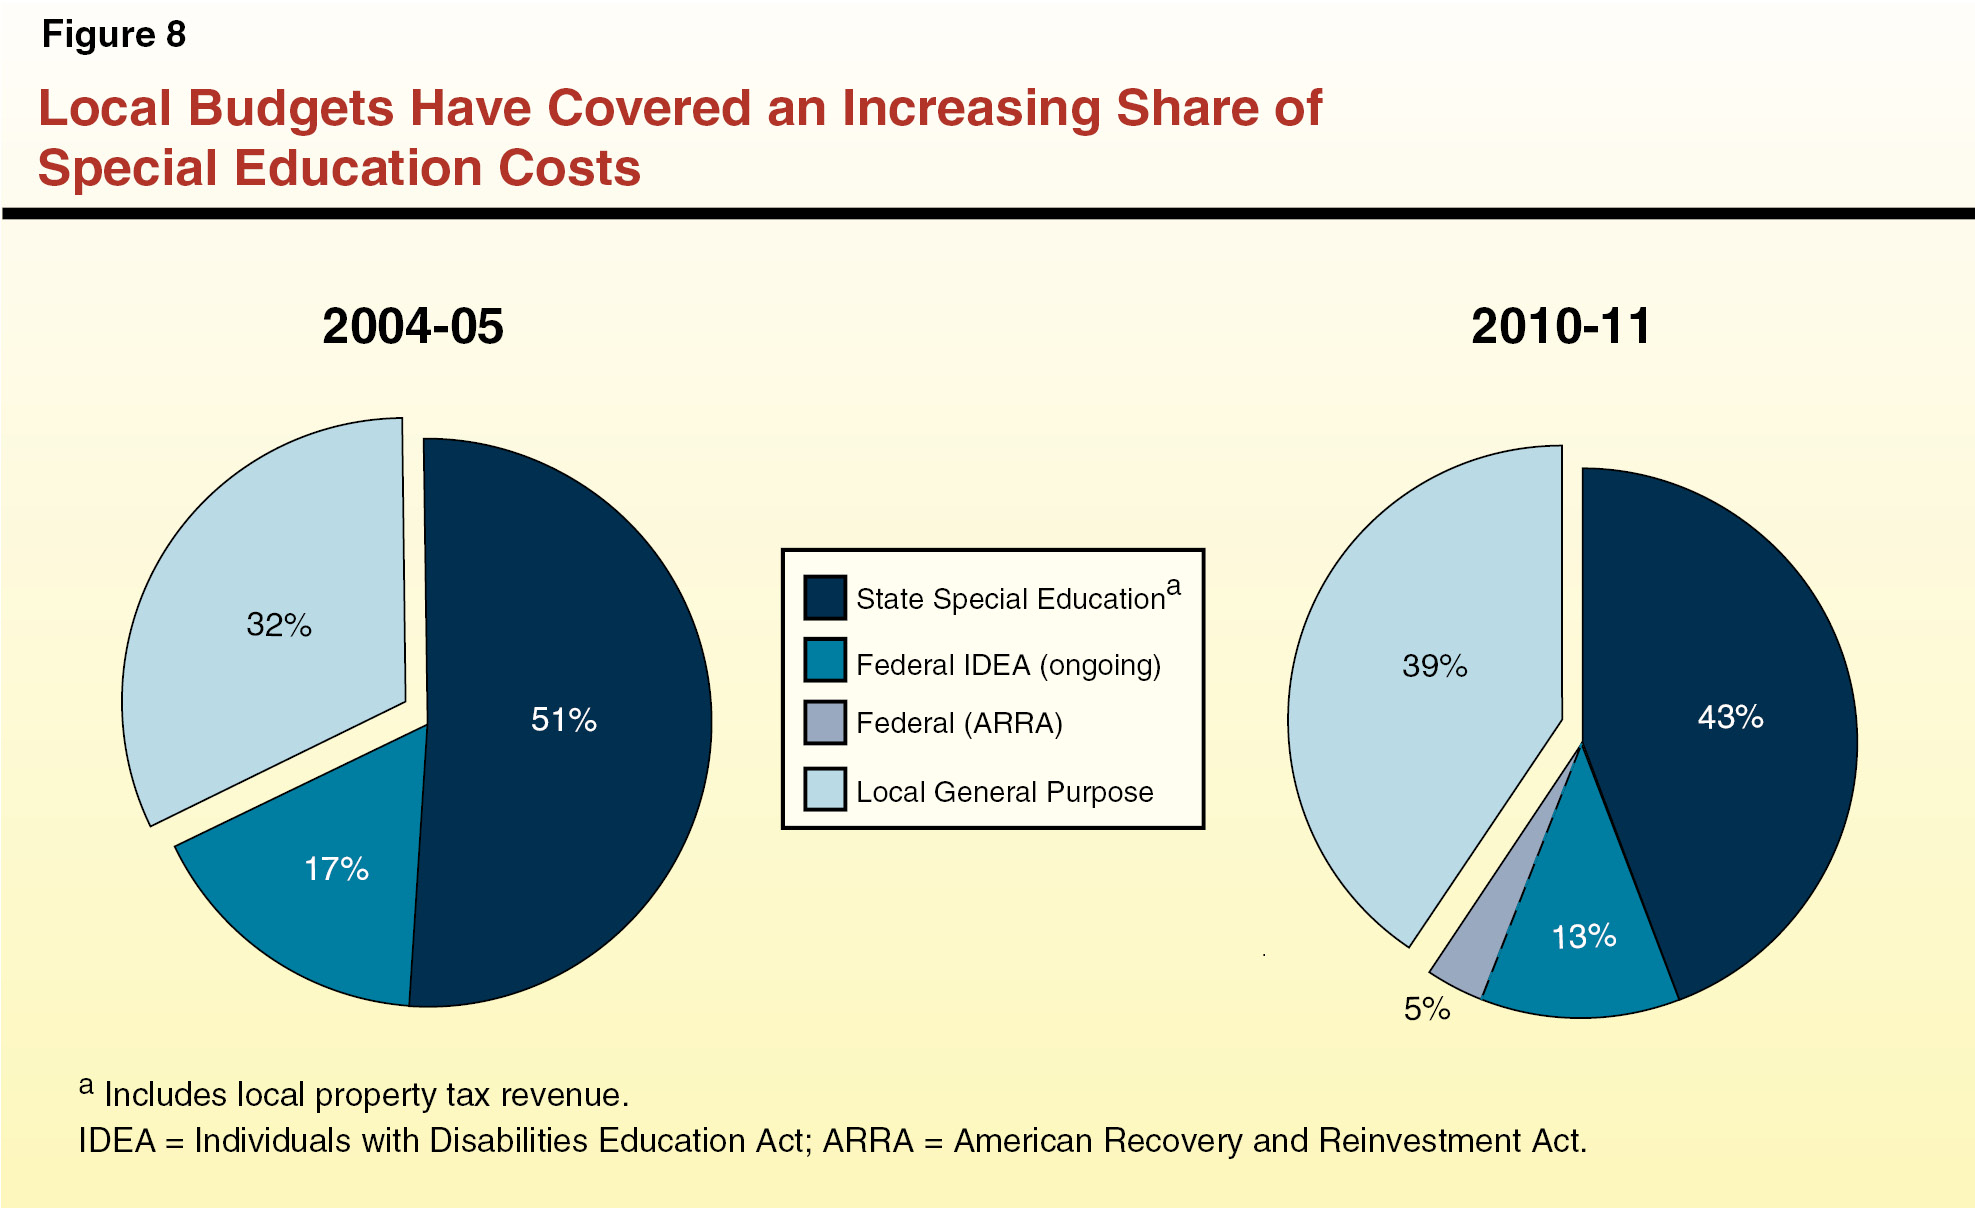
Federal Share Has Never Reached Intended Contribution Level. As shown in Figure 8, federal IDEA funds typically cover less than 20 percent of overall special education expenditures. This is notably lower than the amount the federal government originally committed to provide in support of special education services. The IDEA expresses intent to appropriate funding for each SWD up to 40 percent of the national average expenditure level per K–12 pupil, which would equate to roughly 40 percent of California’s overall special education expenditures. The federal budget, however, has never come close to providing states with this amount. We estimate that California would receive roughly $2 billion more annually if the federal government were to “fully fund” the intended level articulated in the IDEA.
How Are Funds Distributed to SELPAs?
Two Distribution Models Exist. Across the nation, states generally use one of two approaches to distribute special education funding to the local level. Some use a “cost–based” model, with funding allocations driven by how many SWDs are served or the magnitude of special education costs incurred. In contrast, other states rely primarily on a census–based funding methodology that is not linked to particular SWDs. Under this model, the state allocates special education funds based on the total number of students enrolled, regardless of students’ disability status. This funding model implicitly assumes that SWDs—and associated special education costs—are relatively equally distributed among the general student population and across the state. While the majority of federal special education funds are distributed using a census–based model, the IDEA formula does allocate a small portion (typically around 10 percent) of funds based on counts of economically disadvantaged students, on the assumption that this group contains a greater proportion of SWDs.
California Now Uses Census–Based Model. Beginning in 1998–99, California switched from a cost–based to census–based allocation model, which is commonly referred to as the “AB 602” formula after the authorizing legislation. Since that change, more than three–quarters of state special education funds are allocated based on a SELPA’s total average daily attendance (ADA), with the remainder distributed based on specific students and circumstances. In general, data support the incidence assumptions underlying the census–based approach—that is, most SELPAs do report serving proportionally similar numbers and types of SWDs. (Charter–only SELPAs, however, tend to serve proportionally fewer SWDs than most traditional consortia or single–district SELPAs.) While SELPAs receive AB 602 funds based on overall ADA counts, they use them to support the IEP–driven excess costs of educating SWDs.
The AB 602 Formula Blends State and Federal Funds to Provide Each SELPA a Unique Per–Pupil Rate. Each SELPA has a unique per–pupil special education funding rate consisting of both state and federal funds. These “AB 602 rates” vary across SELPAs from about $500 per ADA to about $1,100 per ADA, based primarily on what the SELPA received before the AB 602 legislation was adopted. (In prior years the state invested some funding to equalize AB 602 rates, but large discrepancies remain.) In 2011–12, the weighted statewide average AB 602 rate was $645 per ADA, with charter–only SELPAs having the lowest rates in the state. The exact mix of federal and state funds making up each SELPA’s AB 602 rate varies based on a number of factors, however IDEA funds average about $180 per ADA, with state funds making up the difference.
State and Federal Funds Also Support a Number of Discrete Special Education Subprograms. The AB 602 base allocation—which in 2012–13 includes about $2.9 billion in state funds and $1 billion in IDEA monies—is the largest source of funding SELPAs receive for special education. The SELPAs, however, also receive almost $1 billion in additional state and federal special education funds targeted for more specific purposes. The largest of these special education “categorical” programs allocates over $400 million for SELPAs to provide educationally necessary mental health services to SWDs. Other separately funded initiatives include services for infants and preschoolers with disabilities, vocational education programs for SWDs, and staff development. Some SELPAs also receive supplemental funding if they have sparse population density or if they are located near licensed children’s institutions (based on the assumption that these “group homes” will have higher rates of SWDs). In addition to SELPA–level grants, state and federal funds support state–level special education activities, including compliance monitoring and technical assistance.
How Are Funds Distributed to LEAs?
Consortia SELPAS Determine How to Allocate Funding Amongst LEA Members. Each SELPA develops a local plan for how to allocate funds in its region, based on how it has chosen to organize services. This process is relatively straightforward in the 42 single–district SELPAs, as they receive funding directly from the state and offer or contract for services on their own. The two–thirds of SELPAs that contain multiple LEAs work internally to decide how best to divvy up funding for all the SWDs in their region. These allocation plans differ notably across SELPAs based on local preferences and the service plans they have adopted. In most cases, consortia members opt to reserve some funding at the SELPA level to operate some shared, regionalized services, then distribute the remainder to LEA members to serve their own SWDs locally. In a slightly different approach, some consortia SELPAs choose to allocate essentially all funding to member LEAs, then fund any regionalized services on a “fee for service” basis for those LEAs who choose to participate. (Because charter–only SELPAs do not usually offer regionalized services, they tend to distribute the bulk of AB 602 funds directly to member charter schools.) The SELPAs are not required to use the state’s census–based AB 602 formula to distribute funding to member LEAs. Rather, internal SELPA allocation plans can be based on ADA, specific student populations (for example, counts or characteristics of SWDs), or any other local priority or consideration.
What Are the State Special Schools?
State Uses Different Model to Serve Some Deaf and Blind Students. Like students with other disabilities, most hearing and visually impaired students attend and receive special education services from their local school district or COE. The state, however, also operates three specialized residential schools for deaf and blind students. The California Schools for the Deaf in Riverside and Fremont each serve around 400 students ages 3 to 22, totaling about 6 percent of the state’s deaf and hard of hearing students. The California School for the Blind in Fremont serves around 70 students, or about 2 percent of the state’s visually impaired students. Parents and IEP teams determine whether to send children to these schools in lieu of being served by their local districts. In contrast to the SELPA funding model, these schools are funded through a direct state appropriation—not linked to the school’s enrollment—at a rate that far exceeds the amount SELPAs receive to serve comparable students.
How Are Special Education Laws Monitored and Enforced?
Two Statutory Processes Help Ensure Compliance With Special Education Laws. While the IDEA was established to ensure all SWDs receive the special support they need to benefit from their education, the best approach to meeting those goals for an individual SWD can be complicated, subjective, and contentious. Anticipating difficulties and disagreements, federal and state laws specify two detailed processes for enforcing compliance with the IDEA—one process to ensure LEAs include appropriate content and services in students’ IEPs and another process to ensure LEAs appropriately implement IDEA processes and IEP–required services. Disputes regarding the former are handled by the state’s Office of Administrative Hearings (OAH), whereas the latter is monitored and enforced by CDE. (The following paragraphs describe each process in more detail.) The federal government funds Family Empowerment Centers and Parent Training Institutes to educate and assist parents of SWDs in supporting their children and navigating the legal and logistical facets of the special education system.
Federal Law Provides Parents the Right to Dispute Which Special Education Services Their Child Is Entitled to Receive. Sometimes parents and LEAs disagree over the contents of a student’s IEP. If parents fail to convince the IEP team that different or additional services are necessary to ensure their child receives an appropriate education, they can file a formal complaint with the OAH to revise the IEP. Federal and state laws detail the dispute resolution process, typically beginning with dual–party resolution sessions, progressing to formal mediation sessions with an OAH facilitator, and ultimately—if necessary—to due process hearings with an OAH administrative law judge. Although the number of formal cases filed with OAH represents less than one percent of all SWDs, the dispute resolution process can be costly and contentious for both families and LEAs. Both parties therefore have incentives to avoid lengthy and litigious disagreements. Of the roughly 3,100 dispute cases filed with OAH in 2011–12, only 3 percent ultimately were decided through a due process hearing and legal ruling. The rest were resolved through mediation, settled before the hearing, or withdrawn. The state also provides small funding grants to some SELPAs to pursue alternative dispute resolution strategies and try to settle disagreements outside of the OAH process.
The CDE Monitors LEA Compliance With IDEA Requirements. The CDE is tasked with investigating and resolving allegations that a LEA is failing to comply with federal or state special education laws. Parents, students, or teachers might file individual complaints, or CDE might identify problems while conducting LEA reviews and audits. Commonly cited complaints include LEAs failing to provide IEP–required services or failing to meet statutorily required timelines (such as timelines for evaluating students’ eligibility for services or holding IEP meetings). The CDE tries to correct findings of noncompliance by implementing corrective action plans and increasing monitoring.
How Do California’s Students With Disabilities Perform Academically?
In addition to monitoring how well LEAs meet required special education procedures, federal and state laws also hold LEAs accountable for SWDs’ academic performance. Below, we provide outcome data on how SWDs perform on state assessments and how prepared older SWDs are to transition to adult life.
How Do SWDs Perform on State Assessments?
Federal and State Accountability Systems Based on Standardized Assessments. The federal and state governments each have established systems to hold schools accountable for student achievement. While the two systems are somewhat different, both require schools to measure the academic performance of all students in grades 2 through 11—regardless of disability status—using standardized assessments based on state content standards. (California uses the Standardized Testing and Reporting, or STAR, assessments.) Additionally, each accountability system establishes performance expectations both for overall school performance and for the performance of specific student groups within the school, including SWDs. (The federal system also sets expectations for overall student performance and SWD performance at the LEA level.) The federal system sets Adequate Yearly Progress (AYP) benchmarks whereby progressively higher proportions of students must reach “academic proficiency” each year until 2014, at which point all students are to display proficiency. For example, in 2011–12 the AYP target was for 78 percent of students to display proficiency. (In California, students meet federal proficiency requirements if they score at the “proficient” or “advanced” levels on the state’s STAR assessments.) The LEAs and schools that fail to meet expectations for multiple years face increased monitoring and sanctions. In contrast to the federal system that sets the same annual proficiency requirement for all schools and LEAs, the state’s accountability system—known as the Academic Performance Index (API)—requires individual schools to display annual improvements in student performance relative to their prior–year performance.
Three Options for SWDs to Participate in State’s Assessment System. Because academic outcomes understandably may vary depending upon the nature and severity of a student’s disability, both the federal and state accountability systems allow some SWDs to meet performance expectations using modified or alternate assessments. As shown in Figure 9, California has developed three different sets of STAR tests for SWDs to meet federal and state testing requirements—the California Standards Tests (CSTs), the California Modified Assessment (CMA), and the California Alternate Performance Assessment (CAPA). Which assessment an individual SWD takes depends on the severity of his or her disability and the decision of the IEP team. The selected assessment must be clearly defined in the student’s IEP. The figure shows that in 2011–12 almost half of special education students in grades 2 through 11 took the CSTs, although in many cases with IEP–specified accommodations or modifications. (Such accommodations might include assistive devices, such as audio recorders or calculators, or having an extended period of time to complete the test.) Slightly more than 40 percent of special education students, or about 4 percent of all students in grades 2 through 11, took the CMA. Only about 10 percent of SWDs—those with the most severe cognitive disabilities—took the CAPA.
Figure 9
Three Options for Assessing Students With Disabilities’ (SWDs’) Proficiency in Meeting California Content Standards
2011–12
|
Test
|
Description
|
Number of SWDs Testeda
|
Percent of
Total SWDs (Grades 2–11)
|
|
California Standards Tests (CSTs)
|
Assess students’ proficiency in California content standards for grades 2 through 11. Taken annually by majority of students. Some SWDs allowed some test–taking accommodations or modifications.
|
236,000
|
47%
|
|
California Modified Assessment (CMA)
|
Covers same content standards as the CSTs but designed to be more accessible for SWDs (for example: fewer questions, simpler language, more pictures). Taken by students whose disabilities preclude them from achieving grade–level proficiency on the CSTs, even with accommodations.
|
210,000
|
42
|
|
California Alternate Performance Assessment
|
Presents a series of tasks designed to display proficiency on those portions of content standards accessible to students with severe cognitive disabilities. The K–12 standards are grouped into five grade–span levels, and the Individualized Education Program team decides which level is most appropriate for each student to take. Taken by students whose disabilities prevent them from participating in either the CSTs or CMA.
|
48,400
|
10
|
|
Totals
|
|
494,400
|
99%b
|
The CMA Is a Unique Option for the State’s SWDs. California is one of only 15 states to have developed a special assessment for SWDs with moderate disabilities—the CMA. (Federal law requires states to develop an alternative assessment such as the CAPA for students with the most severe disabilities, but leaves it up to states whether to develop another alternative for SWDs.) While the CMA covers the same grade–level content standards as the CSTs, questions are presented in a more accessible fashion, including fewer questions and fewer possible answers, simplified language, more pictures, and larger type. To qualify to take the CMA in lieu of the CSTs, the IEP team must determine that students’ cognitive disabilities preclude them from accurately demonstrating their knowledge and achieving proficiency on the CSTs, even with testing modifications. The state first administered CMA tests with proficiency level standards for grades 3 through 5 in 2008–09, introducing tests for additional grades in subsequent years. Correspondingly, an increasing number of SWDs have taken the CMA in lieu of the CSTs in recent years. (Specifically, 20 percent of SWDs in grades 2 through 11 took the CMA in 2008–09, compared to 42 percent in 2011–12.)
Federal Accountability System Seeks to Limit Over–Reliance on Alternative Assessments. In an effort to ensure SWDs are held to the same high standards as mainstream students, the federal government attempts to discourage states from having exceptionally high proportions of SWDs take alternative assessments. While federal law does not cap how many SWDs may take the alternative assessments, the percentage of proficient scores LEAs can count towards meeting federal AYP benchmarks is limited to 2 percent of all students for the CMA and 1 percent for the CAPA. (If greater numbers of students take the tests and score at the proficient level, their scores are counted as not proficient.) In contrast to the federal system, the state’s accountability system does not limit the share of students who may take the CMA or CAPA and have their associated scores count towards meeting annual API requirements.
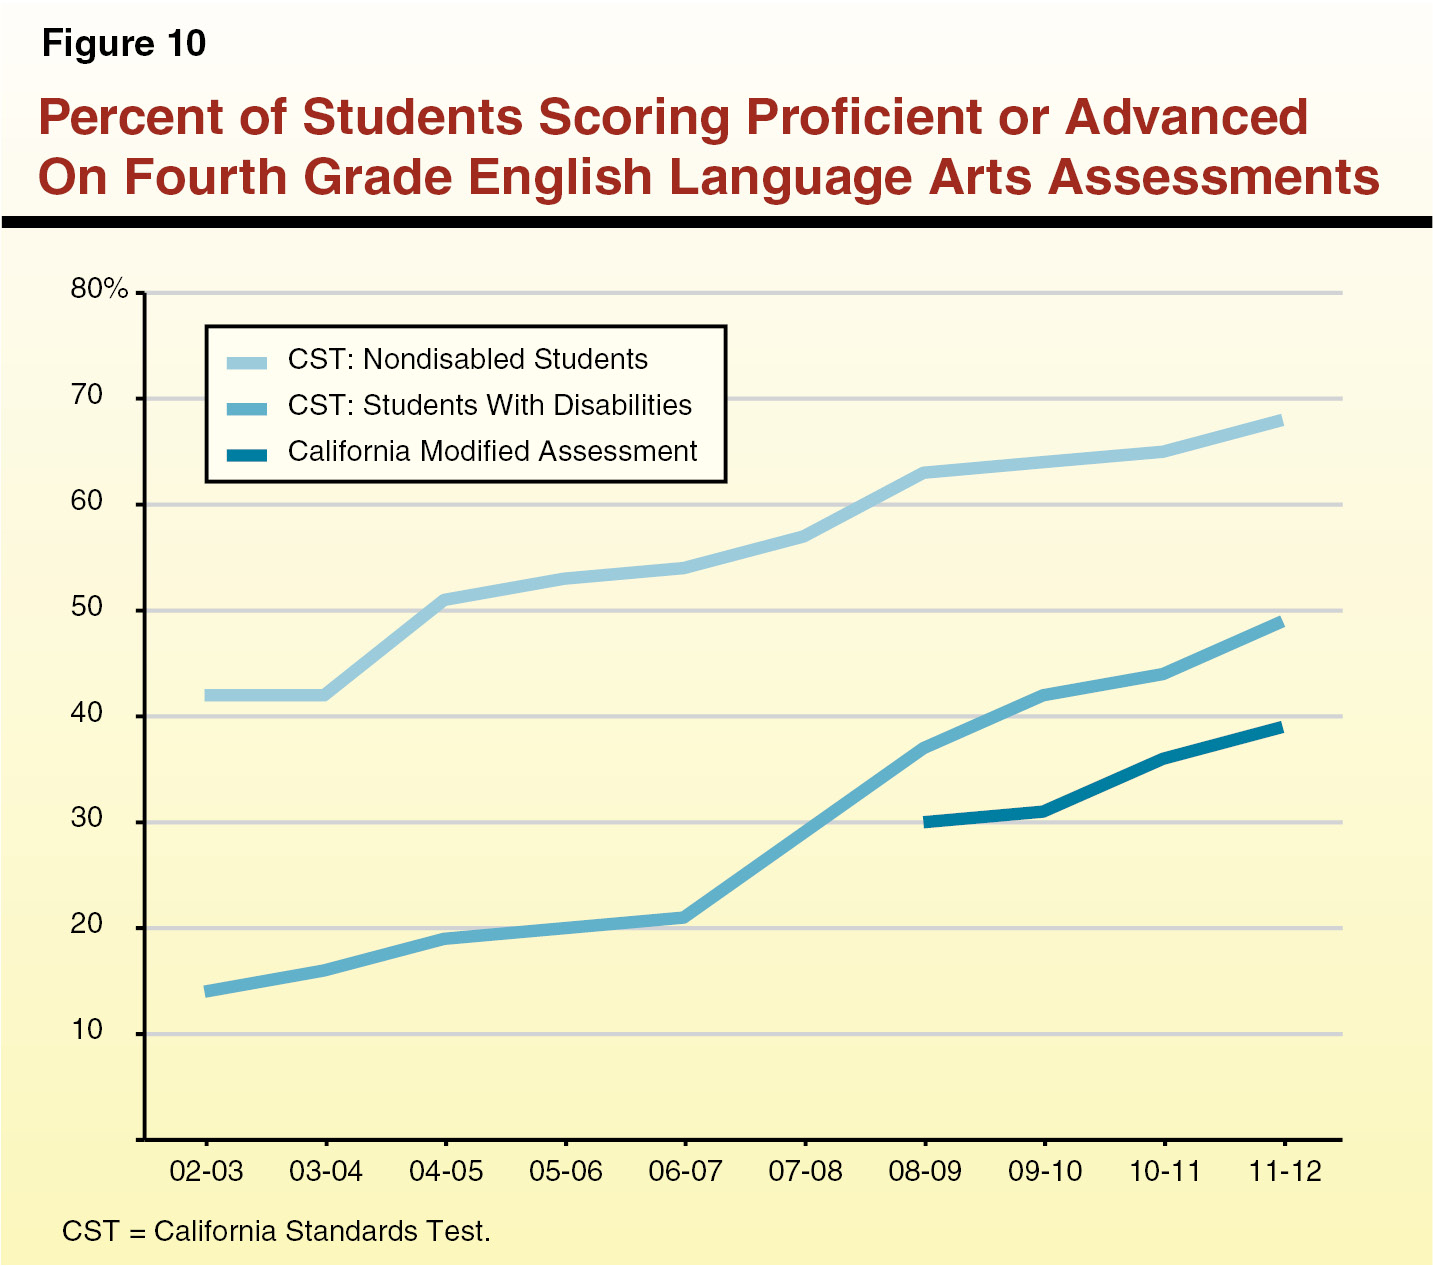
Performance Has Improved, but Majority of SWDs Score Below Proficient Level on State Assessments. Figure 10 displays the percentage of fourth–grade SWDs and nondisabled students that met federally required proficiency targets in English Language Arts over the past several years. (The figure excludes results from the CAPA, as they are not based on grade–level specific standards and therefore are not comparable.) As shown, both groups have displayed improvements in recent years. Improvements for SWDs in recent years may be partially due to increasing proportions of students taking the CMA in lieu of the CSTs. A majority of SWDs, however, still fail to meet federal performance standards with either test. In 2011–12, only 49 percent of SWDs who took the CSTs scored at the proficient or advanced levels. This compares to 68 percent of nondisabled students. Moreover, only 39 percent of the students who took the CMA—which is specially tailored for SWDs—met proficiency targets.
Many Schools and Districts Struggle to Meet Performance Targets for SWDs. As might be expected given the performance levels displayed in Figure 10, a majority of LEAs are failing to meet federal proficiency requirements for their SWDs. In 2011–12, only 11 percent of LEAs met federal AYP benchmarks (that 78 percent of students score proficient or advanced in both English Language Arts and Mathematics) for their disabled student groups. This compares to 29 percent of LEAs that met this AYP benchmark for their overall student population. Schools perform somewhat better on the state’s accountability system, but SWD gains still lag. In 2011–12, 52 percent of schools met state API growth targets for their SWDs, compared to 67 percent that met the targets for their overall student populations. As described in the nearby box, however, these statistics exclude about half of the state’s LEAs (for AYP) and almost 90 percent of schools (for AYP and API), as their populations of SWDs are deemed too small to report as discrete groups for accountability calculations.
Size Thresholds Mean Majority of Districts and Schools Not Held Accountable for Disabled Student Group Performance
Because a majority of the state’s local educational agencies (LEAs) and schools serve smaller populations of students, many of them are not subject to federal and state accountability requirements and performance benchmarks for students with disabilities (SWDs). Specifically, to be held accountable for SWD group performance under both the federal and state systems, LEAs and schools must have valid test scores from either (1) at least 50 SWDs who make up at least 15 percent of the total number of valid scores or (2) at least 100 SWDs. If a school or LEA does not meet these thresholds, state law deems its SWD population too small to be numerically significant for federal Adequate Yearly Progress (AYP) and state Academic Performance Index (API) calculations. In 2011–12, 521 of the state’s 1,016 LEAs (51 percent) did not have numerically significant groups of SWDs for AYP calculations. Even more notably, 8,759 schools out of 9,905 schools (88 percent) did not meet the threshold for calculating AYP or API targets for their SWDs. Thus, just over half of the state’s LEAs and almost nine out of ten schools did not face achievement targets, monitoring, or sanctions related to how their SWDs performed.
What Happens to SWDs After High School?
Even With Exemption From Exit Exam Requirement, Many SWDs Struggle to Complete High School. To meet federal testing requirements, all students—including SWDs—must take the California High School Exit Exam (CAHSEE) in 10th grade. State law also requires that most students pass the CAHSEE in order to graduate from high school. However, in 2011–12 only about 40 percent of SWDs passed the exit exam as 10th graders, compared to 87 percent of nondisabled students. For the class of 2012, only 56 percent of SWDs had passed the CAHSEE by the end of 12th grade, compared to 95 percent of nondisabled students. Because of such low passage rates (and an associated lawsuit), state law was changed in 2009–10 to allow certain SWDs to receive diplomas without passing the CAHSEE. Specifically, students’ IEPs or Section 504 Plans can explicitly exempt them from the requirement to pass CAHSEE if they meet all other local graduation requirements. The state currently is investigating alternative measures for SWDs to demonstrate the same content knowledge as the CAHSEE, but no new requirements have yet been adopted. Even with the CAHSEE exemption, Figure 11 shows that only 59 percent of SWDs graduate on time and almost one–fifth drop out of school.
Data Suggest More Than Half of SWDs Successfully Transition to College or Career Activities. As discussed earlier, the IDEA requires that LEAs offer plans and services to help prepare SWDs for life after high school. While comprehensive information on these efforts is somewhat limited, data suggest many SWDs are successfully transitioning to postsecondary education and careers (some even without a high school diploma). Specifically, CDE estimates that about half of SWDs enroll in an institute of higher education after high school. The CDE estimates an additional roughly 15 percent of SWDs are competitively employed within one year of leaving high school.
Figure 11
Students With Disabilities (SWDs) Struggle to Complete High School
Cohort Data for Class of 2010–11
|
|
All Students
|
SWDs
|
|
Graduate high school in four years
|
76%
|
59%
|
|
Drop out before completing high school
|
14
|
18
|
|
Remain enrolled past expected graduation date
|
9
|
19
|
|
Receive GED or certificate of completiona
|
1
|
4
|
|
Totals
|
100%
|
100%
|
Conclusion
Developing a more thorough understanding of how California’s disabled students are served is the first step towards improving their educational outcomes. In this report, we provide a high–level review of special education laws, services, delivery models, funding formulas, and outcomes. In almost all of these areas, special education is characterized by the complex interplay of policies and practices at the federal, state, and local levels.