Executive Summary
Background. The Unemployment Insurance (UI) program provides weekly UI payments to eligible workers who lose their jobs through no fault of their own. The program is financed by unemployment tax contributions paid by employers.
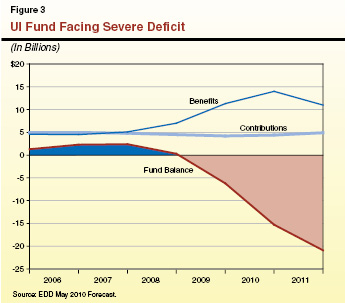
The UI Fund Is Currently Insolvent. The UI fund became insolvent in January 2009 and ended that year with a shortfall of $6.2 billion. Absent corrective action, the fund deficit is projected to increase to approximately $20 billion at the end of 2011 (Employment Development Department [EDD] will soon update these projections). During 2009, the state paid about $11.3 billion in benefits to workers while collecting only about $4.5 billion from employers. This recent spike in benefit costs is due to the recession, which resulted in more workers than ever applying for UI benefits.
Federal Loan Supports Benefit Payments With Interest Costs to the State. Since January 2009, EDD has been obtaining quarterly loans from the federal government to cover the UI fund deficit. These federal loans have permitted California to make payments to UI claimants without interruption. Generally, loans lasting more than one year require interest payments. The federal American Recovery and Reinvestment Act (ARRA) of 2009 provides temporary relief to states from making interest payments on UI loans through December 31, 2010. With the expiration of these ARRA provisions, EDD estimated in May 2010 that California could owe about $500 million in September 2011 and would face growing interest obligations in the out years.
Difficult Choices for the Legislature. The Legislature essentially has three main choices for returning the UI fund to solvency: (1) reducing benefit payments, (2) increasing employer tax contributions, or (3) adopting some combination of the previous two options. To assist the Legislature we examined multiple scenarios for achieving solvency and found that:
- Decreasing UI benefits alone cannot address the fund insolvency in the near future.
- Options involving UI tax increases could quickly improve the fund condition.
- Employer tax increases could hurt California’s competitiveness.
- The UI financing structure is not sufficiently robust.
Strategies for Achieving Solvency. In developing a strategy to bring solvency to the UI fund, we recommend that the Legislature:
- Attempt to minimize adverse impacts on the economy.
- Make both tax and benefit changes.
- Consider different approaches for the short term (2011 and 2012) than for the long term.
- At a minimum, take prompt action to bring UI benefits and tax revenues into line so that the accumulated deficit and associated interest obligation stops growing.
Introduction
The state’s UI fund is currently insolvent and, absent corrective action, will remain so for the foreseeable future. During the November 2008 special session, the Governor introduced a proposal, which has not yet been acted upon by the Legislature, to restore solvency to the UI fund. In addition, two bills—SB 222 (Ducheny) and AB 1298 (Coto)—were introduced in February 2009 to address the insolvency. However, neither bill moved out of its respective policy committees.
In our January 2009 report, 2009–10 Budget Analysis Series—General Government, we provided an overview of the UI program, described the deterioration of the UI fund, and provided our initial thoughts on the administration’s proposal to restore solvency. The purpose of this report is to provide an update on the status of the UI fund, compare California’s UI tax and benefit measures to other states, review options for restoring fund solvency, and analyze various scenarios to provide the Legislature with some context as it considers potential solutions to address the UI fund deficit.
Background
Overview
The UI program is a federal–state program, authorized in federal law but with broad discretion for states to set benefit and employer contribution levels. The UI program provides weekly UI payments to eligible workers who lose their jobs through no fault of their own. The program is financed by unemployment tax contributions paid by employers for each covered worker. Regular UI benefits are generally paid for a maximum of 26 weeks. However, during periods of high unemployment, some state and federally funded extended benefits may be available to workers who have exhausted regular UI benefits. California’s UI program is administered by EDD.
California’s UI Financing Structure
The current average weekly benefit is about $300 per week and paid for an average of 20 weeks. To pay for the cost of providing UI benefits, California employers currently pay a combination of federal and state unemployment taxes of up to $490 per covered employee per year. The majority of these employer taxes are used to fund benefit payments. A smaller portion of the taxes goes to the federal government to pay for administration. We describe the California UI program’s financing structure in more detail below.
Taxable Wage Base. California employers pay unemployment taxes on the first $7,000 in annual wages paid to employees. Federal law requires states to have a minimum taxable wage base of $7,000. Currently, California and four other states have a taxable wage base at this federal minimum.
Federal Tax Rate. The federal portion of unemployment taxes is used to fund program administration. The effective federal tax rate for administration is 0.8 percent as long as a state’s UI program is in compliance with federal requirements.
State Tax Rates. The state portion of unemployment taxes funds benefit payments. Current state law establishes a series of contribution rate schedules ranging from AA to F (schedule AA has the lowest employer contribution rates, with the remaining schedules increasing from A to F). Each rate schedule varies in accordance with the condition of the UI fund. Schedule AA is used when the fund condition is the healthiest and schedule F (with the highest contribution rates) is used when the fund condition is weak (approaching a deficit). Current law also authorizes schedule “F+,” which includes a 15 percent solvency surcharge above the rates established in schedule F, for use when the fund is under extreme distress, as it is now. Based on the UI fund condition, the F+ schedule is currently in place. Current state tax rates range from 0.1 percent (the lowest rate on Schedule AA) to 6.2 percent (the maximum rate on Schedule F+).
What an employer contributes to support the UI system also is affected by the record of an employer’s former employees in claiming UI benefits. This is known as an “experience rating.” The EDD keeps a separate account for each business in California, recording tax payments into the system and benefit payments to the firm’s former employees. Firms that pay more in taxes than is paid out to their laid off employees have a positive reserve ratio. When benefits paid out exceed a firm’s tax payments, the firm has a negative reserve ratio. Firms with high positive ratios pay the lowest taxes while firms with negative ratios pay the highest taxes. Although actual taxes paid correspond to a firm’s specific reserve ratio, certain industries tend to have positive ratios (like retail trade), while other industries tend to have negative reserve ratios. Figure 1 shows the range of average tax rates by industry. (We note that positive reserve firms subsidize negative reserve firms and the cross subsidization is sometimes called “socialization.”)
Figure 1
State UI Tax Burdens Vary Across Industries Average 2009 Tax Rates on the F+ Schedule
|
Industry
|
Tax Rate
|
|
Retail trade
|
3.6%
|
|
Transportation and public utilities
|
4.5
|
|
Wholesale trade
|
4.7
|
|
Public administration
|
4.7
|
|
Services
|
5.2
|
|
Manufacturing
|
5.4
|
|
Finance, insurance, real estate
|
5.4
|
|
Mining
|
5.9
|
|
Other
|
5.9
|
|
Agriculture, forestry, fishing
|
6.2
|
|
Construction
|
6.2
|
California’s UI Benefit Provisions
Statutory Benefit Level. State law establishes the benefit levels to be paid to unemployed workers. The current UI weekly benefit in California ranges from a minimum of $40 to a maximum of $450. The amount of benefits available is based on the claimant’s earnings in the “base period,” which is 12 months. (Please see the nearby box for more information on the base period and how it is calculated.) The quarter within the base period in which the highest wages were received generally is the basis for determining the weekly benefit amount. Figure 2 provides examples of various UI benefit amounts based on earned wages. For 2009, the average benefit payment was $299 per week.
Figure 2
Examples of How UI Benefit Amounts Vary With Prior Wages
|
Amount of Wages in Highest Quarter
|
Weekly Benefit Amount
|
|
$900.00–$948.99
|
$40
|
|
3,822.01–3,848.00
|
148
|
|
7,956.01–7,982.00
|
307
|
|
11,674.01 and over
|
450
|
Federal Incentive Opportunity for Base Period Modification
All states use a base period to determine whether potential claimants have earned enough wages to qualify for unemployment insurance (UI) benefits. A base period is typically four calendar quarters, and most states, including California, traditionally define their base period as the first four of the last five completed quarters at the time a UI claim is filed. This means that, when using a traditional base period, the last few months of wages earned by a potential claimant cannot be counted in determining UI benefit eligibility.
Alternative Base Period Expands Coverage. In the past few years, some states have adopted alternative base periods (ABP) to allow more unemployed individuals to qualify for UI benefits. The ABP typically shifts the 12–month base period to count wages earned in the calendar quarter in which the claimant files for UI or the most recent prior completed quarter. The ABP generally allows claimants to qualify for UI benefits sooner than under a traditional base period, which will tend to benefit part–time or low–wage earners, seasonal workers, and recent entrants to the workforce.
Federal Incentive Payment Available for Expanded UI Coverage. The federal American Recovery and Reinvestment Act (ARRA) of 2009 appropriated $7 billion for states to expand their UI coverage, including through the adoption of ABPs. The additional funding may be used by states to make UI benefit payments, or to fund improvements to the UI program. The incentive payments will be provided to states in two separate lump sums—(1) the first one–third of the incentive payment will be provided to a state once it authorizes the use of an ABP in determining UI eligibility and (2) the remaining two–thirds of the incentive payment will be provided once the ABP is implemented and the state meets two of four additional expanded coverage requirements. The ARRA also included $500 million for state grants, intended to assist states in upgrading their information technology systems and/or the administration of the program.
California to Implement ABP. Because the state’s UI program meets the federal requirements, California only needs to implement an ABP in order to qualify for the entire incentive payment, estimated to be about $840 million. In March 2009, the Legislature and Governor enacted Chapter 23, Statutes of 2009 (AB 3 29, Coto and Garrick), to create an ABP for California’s UI program by April 2011. (We note that the Legislature has recently extended this deadline due to various implementation issues.) Chapter 23 provides that if a potential claimant does not qualify for UI benefits using the traditional base period, an ABP that includes the most recently completed calendar quarter may be used to determine UI eligibility.
Incentive Payment Must Fund Benefit Payments. The Employment Development Department (EDD) is using a portion of California’s ARRA UI administration grant of about $60 million to make the technical changes necessary to implement ABP. The EDD estimates that the additional benefit payment costs resulting from expanding UI coverage through ABP implementation will be about $70 million per year (although this amount will fluctuate over time). This means that the incentive payment could cover around ten years of additional UI payments related to ABP. We note that because the UI fund is currently insolvent, the state will have less discretion in how it uses the incentive payment. |
The primary goal of the UI program is to provide partial replacement of wages for individuals who involuntarily experience job loss. California’s wage replacement rate for the UI program—which is set in statute—is 50 percent, subject to the maximum amount of $450 per week. As previously mentioned, most states, including California, provide regular UI benefits for a maximum of 26 weeks.
Eligibility Provisions. Eligibility for the UI program depends upon both monetary and non–monetary requirements. In terms of monetary requirements, a claimant must have generally earned (1) at least $900 in a single quarter, as well as $1,125 total in the 12–month base period or (2) at least $1,300 in any quarter in the base period to qualify for UI benefits in California. These eligibility requirements have been in place since 1992 and have not been adjusted since that time for changes in average wages.
In terms of nonmonetary requirements, claimants must be out of work through no fault of their own. In addition, claimants must be able to work, be seeking work, and be willing to accept a suitable job if offered one. As part of the eligibility process, claimants must show that they are looking for work and are meeting these requirements. If a claimant is not in compliance with these nonmonetary requirements, overpayment notices and penalty assessments may be applied.
Legislative Changes to Benefit Provisions. From 1992 through 2001, the maximum weekly benefit amount for UI was $230, paid for 26 weeks. The wage replacement rate was also limited to 39 percent, subject to the cap of $230 per week. Chapter 409, Statutes of 2001 (SB 40, Alarcón), provided for a total increase in the maximum weekly benefit of $220 phased in over a four–year period. Chapter 409 also increased wage replacement from 39 percent to 45 percent effective January 2002, and to 50 percent effective January 2003. Since Chapter 409 was implemented, there have not been additional changes to the state’s UI benefit provisions.
We note that although Chapter 409 nearly doubled the maximum UI weekly benefit amount from $230 to $450 over a phased–in period, the legislation did not raise the taxable wage base of $7,000 per worker nor did it increase the tax rate schedules.
The UI Fund Is Currently Insolvent
The UI fund became insolvent in January 2009 and ended that year with a shortfall of $6.2 billion. Absent corrective action, the fund deficit is projected to increase to $15.3 billion at the end of 2010 and $20.9 billion at the end of 2011. These EDD deficit estimates assume California unemployment rates of 12 percent for 2010 and 11 percent for 2011, which we believe are reasonable projections. As shown in Figure 3, EDD forecasted in May 2010 that benefits paid from the state UI fund will total $11 billion in 2009, $14 billion in 2010, and $11 billion in 2011. Employer contributions, however, are much lower, totaling $4.2 billion in 2009, $4.4 billion in 2010, and $4.9 billion in 2011. We note that California is not alone in experiencing a UI fund deficit, as about 30 other states are in deficit situations. (The actual and projected UI fund conditions discussed in this report tie to EDD’s May 2010 forecast. The EDD updates their forecast semiannually—in late May and October of each year. Future changes in EDD forecasts are unlikely to alter our findings in a significant way.)
Evolution of the UI Fund Condition
One of the contributing factors to the current UI fund insolvency problem was the inability of the fund to build a healthy reserve in the last decade. Below, we describe the changing conditions that have impacted the UI fund over the years.
History of the UI Fund Condition. As Figure 4 shows, California’s UI financing structure worked well up until recent years. The fund balance built sufficient reserves during times of economic expansion so that the lowest tax rate schedule could be used before entering a period of economic contraction.
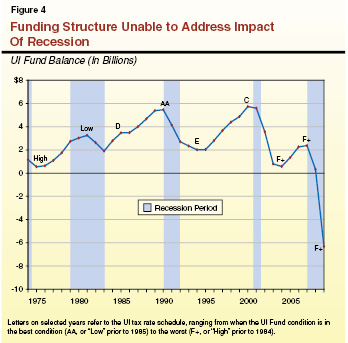
This pattern ended in the 1990s. In the years leading up to the recession of the early 2000s, the fund was unable to build a high enough reserve to safely cover the next recession. Employers were still on schedule C in the late 1990s and in the early 2000s, as the state entered into a brief recession. Soon after, benefits levels were increased with no changes to the revenue structure. As shown in Figure 4, the fund balance dipped below $1 billion in 2004. As the state entered this most recent recession in 2008, in which the unemployment rate hit record highs, the fund had an insufficient reserve, even though employers had been on the highest state tax rate schedule—F+—since 2004. The EDD estimates that even as more firms pay higher rates under the F+ schedule, the current system can only generate about $6 billion in annual revenues.
The situation in the late 1990s and early 2000s suggests that the UI financing system was not robust enough to build sufficient reserves. According to EDD estimates, the existing UI financing system can be sustained in the long run only if the state unemployment rate averaged around 4 percent over time. Such low rates of unemployment have been historically rare in California. Given that the state’s current unemployment rate tops 12 percent and is expected to remain fairly high for the next several years, the Legislature will need to reform California’s UI system to achieve and maintain the solvency of the UI fund. We discuss specific approaches to modifying the UI financing structure later in this report.
Federal Loan Means No Interruption In Benefits
Federal Loan. Since January 2009, EDD has been obtaining quarterly loans that are available from the federal government to cover the UI fund deficit. These federal loans have permitted California to make payments to UI claimants without interruption. As of September 2010, the state’s outstanding federal loan for benefit payments was approximately $8 billion.
Repayment. Federal loans to state UI funds that are repaid within a federal fiscal year are generally interest free. However, federal loans that carry over from one federal fiscal year to the next will generally be assessed interest pursuant to a federal formula. Currently, the interest rate is about 5 percent per year on the outstanding balance. Interest charges may not be paid out of the fund and must be paid separately by states from another fund source—in California’s case, most likely the General Fund. The principal amount of any funds borrowed is not due immediately, but must be repaid automatically to the federal government from the UI fund whenever it has a positive balance.
Interest Temporarily Waived. The ARRA includes several provisions impacting the UI program, which we outlined in our March 2009 report, 2009–10 Budget Analysis Series—Federal Economic Stimulus Package: Fiscal Effect on California. In particular, ARRA provides temporary relief to states from making interest payments on federal UI loans through December 31, 2010. Interest does not accrue on the principal amount borrowed during this forgiveness period. The EDD estimated that these provisions would save California a few hundred million in interest costs in 2009 and 2010.
When these ARRA provisions expire, the state must start making these interest payments. In May 2010, the EDD estimated that, absent any corrective action, the state would owe about $500 million in the fall of 2011. Absent an alternative financing solution, the payment of this interest cost will likely come from the General Fund.
Potential Consequences of Fund Insolvency Are Significant
The current UI fund insolvency has significant potential consequences. Specifically, the state must meet several conditions in order to (1) obtain the federal loans which support the uninterrupted payment of UI benefits and (2) maintain the federal tax rate at 0.8 percent. (This federal tax rate can increase to as much as 6.2 percent absent state compliance.) These conditions include (1) making progress toward addressing the underlying problem that resulted in the borrowing of federal funds for California’s UI system and (2) making timely payments of the interest owed on the federal loan. As described below, failing to meet these conditions could result in increased costs for employers and the state.
Condition 1: Addressing the Underlying Problem. Employers would face serious long–term consequences if the state fails to address the underlying problem that resulted in this borrowing of federal funds for the UI system. Federal law includes provisions to ensure that a state does not continue to incur loans over an extended period. Specifically, if a state has an outstanding loan balance on January 1 for two consecutive years, the full amount of the loan must be repaid before November of the second year or employers would face higher federal UI taxes. (The current 0.8 percent federal tax would increase each year in increments—starting with an increase of 0.3 percentage points—until the loan was repaid.) Once the fund reached solvency, the annual federal UI tax rate would once again drop to 0.8 percent. As shown in Figure 5, employers could face their first tax increase as early as 2012, which would result in an increased annual cost of about $325 million to employers. Absent corrective action, the federal tax would continue to increase incrementally each year to a maximum of 6.2 percent, resulting in increased employer costs of approximately $6 billion annually. We note that even this $6 billion tax increase would not be enough, at this point, to address the insolvency problem and cover the projected fund deficit. These additional federal administrative taxes are applied to the principal balance of the state’s federal UI loan. (References in this report to the state’s UI deficit do not reflect crediting the federal tax increases shown in Figure 5.)
Figure 5
Federal UI Tax Increases if Fund Continues to Be Insolvent
|
Year
|
Annual Federal UI Tax Per Employee
|
Aggregate Increase in Employer Cost (In Millions)
|
|
2011
|
$56
|
—
|
|
2012
|
77
|
$325
|
|
2013
|
98
|
650
|
|
2014
|
119
|
975
|
|
2015
|
140
|
1,300
|
|
2016
|
196
|
2,167
|
Condition 2: Making Interest Payments on Time. If the state fails to make interest payments on time, employers would immediately face the $6 billion in costs that might otherwise be phased in gradually as described above. The state would also lose its entire federal UI administrative grant, which is typically around $400 million annually, until the interest has been paid. Absent these federal funds, UI administrative costs would most likely be backfilled by the General Fund.
Earlier Proposals to Address Insolvency
As previously noted, the Governor introduced a proposal in November 2008 to address the UI fund insolvency. In addition to the Governor’s proposal, two bills were introduced in the spring of 2009 to address the problem. Below, we briefly describe the key features of these proposals.
Key Features of the Governor’s Proposal
To address the UI fund insolvency, the Governor’s proposal included several changes, which would have commenced on January 1, 2010, to both the revenue and benefit sides of the UI program.
The key features of the Governor’s proposal were:
- Increasing the taxable wage base from $7,000 to $10,500 per employee.
- Increasing the tax rates on each of the tax schedules, which would increase the maximum state tax rate from 6.2 percent to 8.1 percent.
- Reducing the wage replacement rate from 50 percent to 45 percent for certain employees.
- Tightening eligibility by increasing the amount a claimant must generally earn in the highest wage quarter in a 12–month base period to qualify for benefits from $1,300 to $3,200.
- Increasing the penalty assessments imposed on individuals disqualified from UI benefits for quitting work without good cause or being terminated from work with good cause.
Figure 6 details the estimated impact of the Governor’s proposal on employers and UI claimants.
Figure 6
Impact of the Governor’s November 2008 Proposed Changes to the UI Program
|
Proposed Policy Change
|
Examples of Estimated Employer Impact
|
Effect onWorkers
|
|
Increasing the taxable wage base from $7,000 to $10,500 per employee.
|
Median tax increase of $230 per employee per year.
|
—
|
|
Increasing the tax rates on each tax schedule (on $10,500 base).
|
Median tax increase of $123 per employee per year.
|
—
|
|
Reducing the wage replacement rate from 50 percent to 45 percent.
|
—
|
396,000 ( 26% of claimants) would have decreased benefits.
|
|
Increasing the minimum eligibility to qualify for benefits.
|
—
|
29,700 (2% of claimants) would lose benefits.
|
Legislative Proposals to Address UI Problem
Senate Bill 222, which was introduced in February 2009, proposed to increase the taxable wage base from $7,000 to $21,000. Assembly Bill 1298, which was also introduced in February 2009, proposed several changes to the UI program beginning in 2011, including increasing and indexing the taxable wage base to the average annual wages of employees and increasing tax rates. These bills were not enacted into law.
Comparing California’s UI Taxes and Benefits To Other States
As the Legislature considers the best approach to addressing the UI program deficit, it may be helpful to consider how California’s UI program compares to those of other states. The EDD commissioned such a review in the summer of 2009, and the resulting study—California’s Unemployment Insurance System and Financing Study Parameters—was released in August 2009. Based on data from that report, as well as our own review and analysis of U.S. Department of Labor data, we have compared several measures of UI benefits and taxes under current law with those of the ten largest states in population and the national average. Figures 7 and 8 include several key UI program measures, some of which are described in more detail below. In summary, while California’s UI benefits are near the average for the ten largest states and the national average, the average employer cost in California for the UI program is substantially higher than the average cost for the ten largest states and the national average cost. We believe this is because (1) California provides UI benefits to more claimants as compared to other states, and (2) the average duration of benefits in California is longer than other states, as we discuss later in the report.
Figure 7
California’s UI Benefits Near Average of Other Large States
|
Measure
|
California
|
Average for the Ten Largest States
|
U.S. Average
|
|
Average weekly benefit amount
|
$307
|
$297
|
$297
|
|
Maximum weekly benefit amount
|
450
|
432
|
420
|
|
Average wage replacement rate
|
31%
|
35%
|
35%
|
|
Average duration of benefits (in weeks)
|
16.6
|
14.9
|
14.9
|
Figure 8
Data Provide a Mixed Picture of How California UI Tax Rates Compare
|
Measure
|
California
|
Average for the Ten Largest States
|
U.S. Average
|
|
Average annual employer contribution per covered employee
|
$363
|
$297
|
$281
|
|
Maximum annual employer contribution per covered employee
|
434
|
724
|
995
|
|
Average employer contribution as a percentage of maximum contribution
|
84%
|
41%
|
28%
|
|
Average effective UI tax rate on employers
|
0.70
|
0.64
|
0.60
|
|
Taxable wage base
|
$7,000
|
$9,760
|
$14,321
|
|
Maximum tax rate
|
6.20%
|
7.52%
|
7.50%
|
Comparing Benefits
Weekly Benefit Amounts. As shown in Figure 7, California’s average weekly benefit amount for calendar year 2008—$307—was a little higher than that of other large states. Specifically, this amount was tied for third highest among the ten largest states, and was $10 more than both the average for the ten largest states and the national average. The state’s maximum weekly benefit amount of $450 was the fourth highest among the ten largest states. It was $18 more than the average for the ten largest states and $30 more than the national average.
Wage Replacement. Because California is considered a high–wage and high–cost state, our analysis also considered how UI benefits compare with those of other states in replacing the wages lost by recipients. California’s average weekly benefit covered about 31 percent of average weekly wages in 2008. This average wage replacement rate was below the average rate for the ten largest states and the national average, which were both 35 percent. Therefore, although California’s actual weekly benefit amount was above average in 2008, the benefit amount covered a lesser share of workers’ average wages.
Duration of Benefits. As previously mentioned, California and most other states provide regular UI benefits for a maximum of 26 weeks. In 2008, the average duration of benefits in California was 16.6 weeks, while both the average for the ten largest states and the national average was 14.9 weeks.
Comparing Employer Contributions
Taxes Paid Per Employee. In our January 2009 analysis of the UI deficit, we considered how California’s current maximum state tax per employee ($434 per year) compared to the national average ($995 per year). The Governor’s 2008 proposal would have brought the maximum state tax charged per employee per year to about $851—considerably closer to the national average. A more important measure to consider, however, is the average (rather than the maximum) contributions by employers per employee. By this measure, California employers bear a relatively heavy UI tax burden. As shown in Figure 8, the estimated average annual UI contribution per covered employee in 2008 was $363. This contribution level is the fourth highest among the ten largest states. This was $66 more than the average for the ten largest states, and $82 more than the national average.
Employer Costs Compared to Wages. California’s average annual effective UI tax rate for employers (computed as the total UI contributions collectively paid by employers divided by the total wages for the year) was 0.70 percent in 2008. This was slightly higher than both the average tax rate in that year for the ten largest states (0.64 percent) and the national average (0.60 percent). This means that even when taking California’s higher wages into account, our employers are, on average, paying a little more in UI taxes per dollar of wages when compared to other states.
Comparing Taxable Wage Bases. As previously discussed, California’s taxable wage base of $7,000 per employee per year for UI taxes is the minimum federal requirement. This is much lower than the average taxable wage base in 2008 for the ten largest states ($9,760) and the national average ($14,321). We note that several states index their taxable wage base to their average wage, rather than having a static taxable wage base.
Comparing Maximum State Tax Rates. As previously described, California’s current maximum state tax rate for UI—which includes the solvency surcharge—is 6.2 percent. This rate was lower than the 2008 average for the ten largest states and the national average, which was around 7.5 percent for both.
Earlier Proposals To Address UI Shortfall Now Insufficient to Restore Solvency
As previously described, absent corrective action, the UI fund will remain insolvent for the foreseeable future. This means that the state will bear significant interest costs—from continuing to borrow federal funds to make UI benefit payments—in the out years. Employers will face automatic, incremental increases in their federal UI tax, rising from $56 per employee per year to $196 by 2016, and continuing to increase in the out years. Figure 9 details EDD’s May 2010 estimates of the out–year financial impacts of the UI fund condition under current law on the state and employers. As noted earlier, the fund balances do not include the impact of any increases in the federal tax rate that could trigger on in the future.
Given the magnitude of the fund deficit, below we examine how the earlier proposals to address the UI fund insolvency would affect UI benefits and taxes and the fiscal condition of the program. Our updated analysis indicates that the fiscal situation has deteriorated so badly that the Governor’s November 2008 proposal is not sufficient to restore solvency to the system.
Figure 9
Estimated Impacts of the UI Fund Condition Under Current Law
(In Billions)
|
Year
|
Fund Balance
|
State Interest Cost
|
Aggregate Increase in Employer Cost for Federal Administration
|
Federal UI Tax Per Employee
|
|
2010
|
–$15.3
|
—
|
—
|
$56
|
|
2011
|
–20.9
|
$0.5
|
—
|
56
|
|
2012
|
–25.7
|
0.9
|
$0.3
|
77
|
|
2013
|
–30.0
|
1.1
|
0.7
|
98
|
|
2014
|
–34.4
|
1.3
|
1.0
|
119
|
|
2015
|
–39.0
|
1.5
|
1.3
|
140
|
|
2016
|
–43.7
|
1.7
|
2.2
|
196
|
Updated Analysis of the Governor’s Proposal
At the time the proposal was introduced, the administration estimated that its proposed changes to the UI program would (1) increase employer contributions by approximately $4.1 billion in 2010 and (2) decrease benefit payments by about $300 million annually. Figure 10 outlines the major revenue and benefit policy changes and their initial estimated impacts on the UI fund. The Governor proposed that these changes become effective January 2010.
Figure 10
Governor’s Proposed Changes to the UI Program
(In Millions)
|
Proposed Policy Change
|
Annual Fund Benefita
|
|
Increasing the taxable wage base from $7,000 to $10,500 per employee
|
$2,700
|
|
Increasing the tax rates on each tax schedule
|
1,400
|
|
Reducing the wage replacement rate from 50 percent to 45 percent
|
200
|
|
Increasing the minimum eligibility to qualify for benefits
|
92
|
|
Total Solution Value
|
$4,392
|
Governor’s Proposal Not Sufficient to Restore Solvency. The magnitude of the UI fund insolvency has grown to such a degree that even the Governor’s existing proposal is not enough to address the fund insolvency in the foreseeable future. Since the fall of 2008 when the Governor first proposed his solution, the economy has performed worse than expected with higher sustained levels of unemployment than contemplated in late 2008. Moreover, the proposal was not implemented for calendar year 2010 as the Governor proposed. For these reasons, the UI deficit was about $6 billion at the end of 2009 and was forecasted to reach $15.3 billion by the end of 2010. If the Governor’s 2008 plan were put in place effective January 1, 2011, it would roughly bring benefit payments and revenues into alignment, holding the projected deficit at current levels.
If the Governor’s proposal was implemented (beginning in 2011), the estimated average employer contribution per employee would increase to around $800 per year through 2016. This would be a 120 percent increase over the average UI tax contribution employers paid per employee in 2008, which was $363. The average tax rate on total wages would increase to about 1.4 percent in the years immediately following implementation of the proposal, compared to the average tax rate of 0.70 percent in 2008. This new average tax rate would be more than double the average rate from 2008 for the ten largest states (0.64 percent) and the national average rate (0.60 percent). (We would point out that these are point–in–time estimates. These measures of employer costs reflect near–maximum contribution levels due to the current poor health of the UI fund, and would gradually decline as the fund condition improved.)
Earlier Legislative Proposals Insufficient
As with the Governor’s proposal, adoption of the earlier legislative proposals (SB 222 and AB 1298) would not fully address the UI insolvency. The deficit is now significantly larger than had been projected when this legislation was introduced.
UI Insolvency Requires Stronger Solution
Given the magnitude of the UI fund insolvency, we believe the Legislature must go beyond earlier administration and legislative proposals to achieve and maintain long–term solvency for the system. The Legislature essentially has three main choices for returning the UI fund to solvency: (1) reducing benefit payments, (2) increasing the taxable wage base and/or tax rate schedules, or (3) adopting some combination of the previous two options.
In order to help the Legislature understand the magnitude of the benefit and revenue changes that would be needed to fully address the problem, we explored various alternative scenarios to achieve fund solvency. To test the sensitivity of changes to UI taxes and benefits on the fund condition, our scenarios show the impact of attempting to achieve solvency under each of the three main approaches described above. We acknowledge that there are actually a myriad of different specific types of changes to the UI tax and benefit provisions that could be made to address the fund insolvency. The scenarios described below, which were developed with data provided by EDD, are for illustrative purposes only, to provide the Legislature with some context as it weighs various approaches to address this problem.
We also note that the scenarios utilized the specific economic outlook information available at a particular point in time. Also, all of the scenarios are highly sensitive to changes in the unemployment rate. This is because an increase or decrease in the unemployment rate impacts both the total benefit amount paid and total contributions by employers, which in turn impacts the fund balance.
Scenario Descriptions
Decreasing UI Benefits Alone. There are a number of different ways the UI benefit structure could be changed to decrease total benefit payments. For example, the Legislature could decrease the maximum weekly benefit amount, decrease the wage replacement rate, change the monetary and nonmonetary eligibility requirements to qualify for UI benefits, or adopt some combination of these options. To assess the impact of changing UI benefit provisions on the fund condition, our scenario tested (1) decreasing the wage replacement rate from 50 percent to 45 percent, (2) increasing the minimum amount a claimant must earn to qualify for benefits to the level proposed by the Governor in November 2008, and (3) decreasing the maximum weekly benefit amount to $230, which, as described earlier in this report, was last set at this level in 2001. (We tried to test deeper reductions but the department of Labor model used by EDD was not designed to analyze extreme benefit decreases.)
Increasing UI Taxes Alone. The Legislature also has the option of increasing the taxable wage base, increasing the tax rates to address the UI fund deficit, or taking both actions. To assess the financial impact of addressing the fund condition only through these options, our scenarios tested the effect of increasing tax rates to a maximum rate of 10.3 percent (which was the highest tax rate among the ten largest states in 2008) and adjusting the taxable wage base to $19,000 (which was about the 70th percentile for all states) to achieve fund solvency quickly.
Combining UI Benefit Changes With Tax Changes. We also looked at a scenario in which both benefit and tax changes were made to the UI system. This specific scenario tested a combination of (1) the tax increases proposed by the Governor in November 2008; (2) decreasing the wage replacement rate from 50 percent to 45 percent; (3) decreasing the maximum weekly benefit amount from $450 to $338, which amounts to a 25 percent decrease; and (4) increasing the minimum monetary eligibility level to qualify for UI benefits from $1,125 in earnings in 12 months to $3,680 (which amounts to about 11.5 weeks of work at the current minimum wage).
Impact on the UI Fund
Below, we summarize the impact of the various scenarios we tested on the UI fund condition, including changes in the outflow of total benefits paid and the inflow of UI revenue. Figure 11 summarizes the impact of the various scenarios on the UI fund balance.
Our analysis suggests that the benefit reductions scenario would not achieve solvency in this decade. As Figure 11 indicates, the UI fund would continue to face significant shortfalls through at least 2016 (the last year for which projections are available). Increasing UI taxes alone to the level in our scenario would quickly improve the condition of the UI fund, as shown in Figure 11. It would become solvent within two years, by the end of 2012, and would achieve a fund balance of $15 billion by 2016. Finally, the last scenario, in which we combined UI benefit changes with tax changes, results in a more gradual solution that would likely make the UI fund solvent in 2016.
Figure 11
How Different Program Scenarios Affect Year–End Fund Balances
(In Billions)
|
Year
|
Current Law
|
Scenarios
|
|
Benefit Decreases Alone
|
TaxIncreases Alone
|
Combination of Benefit and Tax Changes
|
|
2011
|
–$20.9
|
–$14.1
|
–$5.1
|
–$12.1
|
|
2012
|
–25.7
|
–12.7
|
5.0
|
–8.8
|
|
2013
|
–30.0
|
–10.8
|
9.4
|
–5.7
|
|
2014
|
–34.5
|
–8.7
|
11.1
|
–2.8
|
|
2015
|
–39.0
|
–6.5
|
13.0
|
–0.2
|
|
2016
|
–43.7
|
–4.3
|
15.1
|
2.6
|
Impact on the State
As previously described, the state would face significant ongoing interest costs from continuing to borrow federal funds to make UI benefit payments when the fund is insolvent. Because the scenarios we analyzed result in various levels of solvency, Figure 12 summarizes the impact on the state’s borrowing costs. As shown in the figure, the state’s interest costs decrease, compared to current law, in all scenarios. In the example in which UI taxes are increased alone to achieve fund solvency by the end of 2012, future state interest costs are avoided beginning in 2013. As previously noted, the federal government has waived these interest costs for 2009 and 2010.
Figure 12
How Different Program Scenarios Affect State Federal Borrowing Costs
(In Millions)
|
Year
|
Current Law
|
Scenarios
|
|
Benefit Decreases Alone
|
TaxIncreases Alone
|
Combination of Benefit and Tax Changes
|
|
2011
|
$554
|
$439
|
$343
|
$417
|
|
2012
|
947
|
580
|
133
|
468
|
|
2013
|
1,143
|
511
|
—
|
323
|
|
2014
|
1,331
|
424
|
—
|
191
|
|
2015
|
1,531
|
332
|
—
|
77
|
|
2016
|
1,733
|
238
|
—
|
7
|
Impact on UI Claimants
Addressing the UI insolvency through employer taxes alone would not directly affect persons claiming their benefits. However, the scenarios involving proposals to address the problem through benefit changes alone, or a combination of tax and benefit changes, would (1) mean some workers would no longer be eligible for UI benefits and (2) reduce the amount of benefits paid to those who still qualified for them.
Under our scenario which decreases benefits alone, an estimated 30,000 claimants (about 2 percent of the 2009 total) would no longer qualify for UI benefits. Our scenario combining benefit and tax changes would make an estimated 119,000 claimants (about 7 percent of the 2009 total) ineligible for UI benefits.
Figure 13 compares the impact of our benefit changes on the average weekly benefit amount, as compared to current law. The benefit decreases we tested would reduce the average weekly benefit amount for UI claimants to below the national average amount, which was around $300 in 2008. As Figure 14 shows, the benefit change scenarios we analyzed would also substantially reduce the total amount of benefits paid collectively to UI recipients, as compared to current law. In the out years, in particular, total benefit payment levels under the scenarios would be significantly lower compared to current law.
Figure 13
How Different Program Scenarios Affect Average Weekly Benefit Amounts
(In Billions)
|
Year
|
Scenarios
|
|
Current Law
|
Benefit Decreases Alone
|
Combination of Benefit and Tax Changes
|
|
2011
|
$309
|
$253
|
$275
|
|
2012
|
320
|
205
|
250
|
|
2013
|
334
|
189
|
243
|
|
2014
|
350
|
184
|
241
|
|
2015
|
367
|
183
|
242
|
|
2016
|
384
|
184
|
243
|
Figure 14
How Different Program Scenarios Affect Total Benefit Payments
(In Billions)
|
Year
|
Current Law
|
Scenarios
|
|
Benefit Decreases Alone
|
Combination of Benefit and Tax Changes
|
|
2011
|
$10.7
|
$8.7
|
$9.5
|
|
2012
|
10.1
|
6.4
|
7.8
|
|
2013
|
10.4
|
5.8
|
7.5
|
|
2014
|
10.7
|
5.6
|
7.3
|
|
2015
|
11.1
|
5.4
|
7.2
|
|
2016
|
11.4
|
5.4
|
7.1
|
Impact on Employers
Addressing the UI insolvency through benefit changes alone would, of course, not affect employers. However, our scenarios involving proposals to address the problem through tax increases alone, or a combination of tax and benefit changes, would affect (1) the tax rates that employers would pay and (2) the wage base to which those tax rates would be applied. As shown in Figure 15, the scenario relying on increases in UI taxes alone almost quadruples the average employer cost per employee in 2012 (to about $1,600 per employee) and more than triples the average UI tax rate for employers (to 2.8 percent of employee wages). These employer costs would fall below $1,000 in 2014, and the tax rates would drop to the lowest contribution schedule in 2016.
Figure 15
California’s UI Benefits Near Average of Other Larger States
|
Year
|
Current Lawa
|
|
Tax Increases Alone
|
|
Combination of Benefit and Tax Changes
|
|
ContributionPer Employee
|
Effective Tax Rate
|
ContributionPer Employee
|
Effective Tax Rate
|
Contribution Per Employee
|
Effective Tax Rate
|
|
2011
|
$418
|
0.8%
|
|
$1,503
|
2.7%
|
|
$800
|
1.5%
|
|
2012
|
444
|
0.8
|
|
1,621
|
2.8
|
|
883
|
1.5
|
|
2013
|
458
|
0.8
|
|
1,139
|
1.9
|
|
835
|
1.4
|
|
2014
|
467
|
0.8
|
|
918
|
1.5
|
|
785
|
1.3
|
|
2015
|
476
|
0.8
|
|
936
|
1.4
|
|
753
|
1.2
|
|
2016
|
485
|
0.7
|
|
958
|
1.4
|
|
746
|
1.1
|
Relying on a combination of tax and benefit changes would about double the average employer contribution in the short term (to around $800 to $900 per employee). The average tax rate would also double in the short term to about 1.5 percent of employee wages. However, as in the scenario described above, average employer costs would decrease in the out years as economic conditions and the UI fund balance improved.
As Figure 16 shows, the tax change scenarios we analyzed would substantially increase the total level of employer contributions paid, as compared to current law. In the short term, in particular, total employer contributions under the scenarios would be significantly higher than compared to current law.
Figure 16
How Different Program Scenarios Affect Total Employer Contributions
(In Billions)
|
Year
|
Current Law
|
Scenarios
|
|
Benefit Decreases Alone
|
Combination of Benefit and Tax Changes
|
|
2011
|
$4.9
|
$17.7
|
$9.4
|
|
2012
|
5.3
|
19.5
|
10.6
|
|
2013
|
5.6
|
13.9
|
10.2
|
|
2014
|
5.8
|
11.3
|
9.7
|
|
2015
|
6.0
|
11.7
|
9.4
|
|
2016
|
6.2
|
12.2
|
9.5
|
We note again that, regardless of the scenario, employers could face gradual federal UI tax increases (as summarized earlier in Figure 5), beginning as early as 2012, if the UI fund continues to be insolvent. This would be in addition to the state UI tax increases described above.
For simplification, the discussion above focused on how tax increases would impact employer costs. We would point out, however, our review of the economic literature suggests that in the long run, these costs would largely be passed to workers in the form of lower compensation.
Findings From Scenario Analyses
The results of the various scenarios we tested to try to achieve UI fund solvency indicate that the Legislature will need to make substantial changes to the state’s UI system. Below, we summarize our findings from these scenario analyses.
Decreasing UI Benefits Alone Cannot Address Fund Insolvency in the Near Future. The illustrative scenario regarding decreased UI benefits alone would not resolve the problem by 2016. Benefit payments would exceed employer contributions during 2011. However, beginning in 2012, contributions would exceed benefit payments, and the state would make slow progress toward reducing the debt to the federal government. A $4.3 billion debt would remain in 2016 and an unanticipated increase in unemployment would threaten the path to solvency after 2016.
Options Involving UI Tax Increases Would Quickly Improve the Fund Condition. Both the scenarios in which we increased UI taxes, either alone or in combination with some benefit decreases, show that the state could quickly improve the fund condition by raising revenues to a level that could cover benefit payments. Potential adverse consequences of this tax increase are discussed below.
Tax Increases Could Hurt California’s Competitiveness. As our scenario analysis indicates, in order to achieve UI fund solvency in the short term, employers would face significant tax increases. The magnitude of the tax increases shown in our scenarios is so significant that they could harm California’s economic competitiveness when compared to other states. California employers’ average UI tax is already higher than the national average and the average for the ten largest states. Our analysis indicates that addressing the current fund insolvency problem would involve increasing taxes significantly more.
Strategies To Address The UI Fund Insolvency
As we described, the magnitude of the UI fund insolvency is so great at this point that it poses significant financial risk for the state and employers. Below, we outline some strategies for the Legislature to consider as it weighs various potential solutions to address the UI fund insolvency.
Attempt to Minimize Impacts On the Economy
As our analysis of the different scenarios demonstrates, the Legislature would need to make substantial UI tax and benefit changes to achieve fund solvency in the short term. However, severe UI tax increases on employers and/or benefit reductions for unemployed individuals would negatively impact the state’s recovering economy. That said, failure to adequately address the fund insolvency would increase the financial burden on the state due to ballooning interest payments that the state would have to make to the federal government for continued borrowing. Because these interest costs would likely be paid from the General Fund, it could lead to reductions in other state programs or increases in other state revenue sources. The Legislature should also carefully consider what actions should be taken now, in the context of the recovering economy, versus those that could be taken later when the economy is in a better condition.
Make Both Tax and Benefit Changes
We would recommend against solutions that go as far as the illustrative scenarios presented above in which benefits would be decreased alone or taxes would be increased alone to address the UI fund insolvency. We do think, however, that some combination of tax and benefit changes must be implemented soon to improve the UI fund condition. Therefore, we recommend the Legislature consider using our example of combining UI benefit decreases with tax increases as a starting point for a possible solution. As that specific scenario illustrates, however, fund solvency may take several years to achieve, so there are likely to be some state costs from continued federal borrowing to cover UI benefit payments. We believe this is a reasonable trade–off that the Legislature should consider as part of its approach.
Potential Tax Changes. As we previously pointed out, the current UI financing structure caps revenues at about $6 billion annually. Although California employers already pay above–average UI taxes, we recommend that the Legislature increase UI taxes by the amount that would be sufficient to (1) improve the UI fund condition in the short term and (2) create a more flexible financing structure that can achieve and maintain a healthy fund balance in the long term, especially during economic downturns.
Similar to the Governor’s November 2008 proposal, we recommend increasing both the taxable wage base and tax rates. To minimize the impact on the economy, employers’ UI taxes should probably not be more than doubled. Increasing the taxable wage base and maximum tax rate to the levels proposed by the Governor’s November 2008 proposal or near the national average (as shown in Figure 8) would about double employers’ UI costs in the short term.
Beyond increasing the taxable wage base and tax rates, the Legislature may wish to consider other tax policies to reform the UI system. For example, it could consider indexing the taxable wage base to average annual wages, which may keep the UI financing system more fluid and in line with changing economic conditions.
Potential Benefit Level Changes. As previously discussed, although California’s actual average weekly UI benefit amount is slightly above the national average, it is lower than the national average when taking into account California’s high wages and high cost of living. Therefore, we would advise against making drastic reductions to the weekly benefit amount. That said, in light of the UI fund condition, we recommend that the Legislature consider some level of benefit reduction, either by decreasing the maximum weekly benefit amount and/or the wage replacement rate.
Potential Eligibility Changes. There are other programmatic changes, such as updating or altering various eligibility provisions that could be made to decrease total UI benefit costs. For example, we recommend that the Legislature increase the minimum monetary eligibility requirements to qualify for UI benefit payments, as these provisions have not been adjusted since 1992 to account for changes in average wages. The Legislature should also consider indexing these monetary requirements to changes in average wages in order to keep eligibility requirements more up to date over time.
Another component to review is the average duration of benefits, which is an area where California has averaged about two weeks longer than the national average for the last few years. The Legislature may wish to look into what types of program components may be contributing to this longer than average duration of UI benefits in California.
Implement Solutions Quickly Yet Carefully
Because the magnitude of the UI fund insolvency is so great, the Legislature should act quickly to improve the fund condition. Ideally, some changes should be adopted this year. This is because businesses and payroll processing companies need time to prepare for changes in tax rates and/or the taxable wage base prior to the start of calendar year 2011. Mid–calendar year changes pose administrative difficulties for employers. Although not ideal, it is possible to change the tax rates after the start of the fiscal year. As we discuss below, the Legislature may ultimately need to phase in a series of changes over multiple years. Legislative action during the fall of 2010 to improve the fund condition during 2011 would in part lessen the need for stronger action in later years.
Consider Different Short–Term and Long–Term Strategies
The Legislature may wish to consider differing strategies to address the UI fund insolvency in the short term versus the long term. For example, as our scenario analyses indicate, some of the difficult tax changes that will be necessary to quickly bring the fund back into solvency could be scaled back after a few years when the fund balance is healthier. The Legislature could gradually phase in various changes to the UI system over time, although this approach would inevitably mean that the state would face larger General Fund impacts for paying back interest to the federal government on loans received to sustain the system. At a minimum, the Legislature should take prompt action to bring UI benefit costs and tax revenues into line so that the accumulated deficit does not continue to grow. This would eliminate the need for additional federal borrowing and would cap the state’s interest costs at current levels. In the long run, the Legislature should modify the UI financing and benefit system so that it can be self–sustaining through periods of economic contractions and expansion.
Considering “Outside” Options Regarding the State’s UI Debt
This report has focused on addressing the UI insolvency by making changes “inside” the UI system. By inside, we mean changes to UI benefit levels, eligibility standards, and/or employer taxes. As described earlier, the UI insolvency can be divided into two parts: (1) the ongoing deficit created from benefit payments exceeding employer contributions and (2) the outstanding debt of about $20 billion owed the federal government. The first part must be solved within the UI system. The Legislature needs to bring benefit payment and employer taxes into line. However, once the Legislature has balanced the program’s inflows and outflows, there are options outside the UI system for repaying the loan to the federal government. These outside options include (1) creating new revenue sources of a time–specific duration to pay down the debt over time, (2) dedicating existing revenues to loan repayment, and (3) issuing bonds. Other states have issued bonds rather than seek federal loans when their UI programs became insolvent. This was typically because the debt–service costs on the bonds was less than the interest charged by the federal government.