Ann Hollingshead

September 16, 2026
Understanding the State’s Astonishing Cash Position
- Introduction
- What Is the State’s Cash Balance and Why Is It Important?
- Cash Balance Reached Astonishing $100 Billion
- In What New Ways Has the State Used This Cash?
- What Are the Trade‑Offs?
- Will High Balances Persist?
- Conclusion
Executive Summary
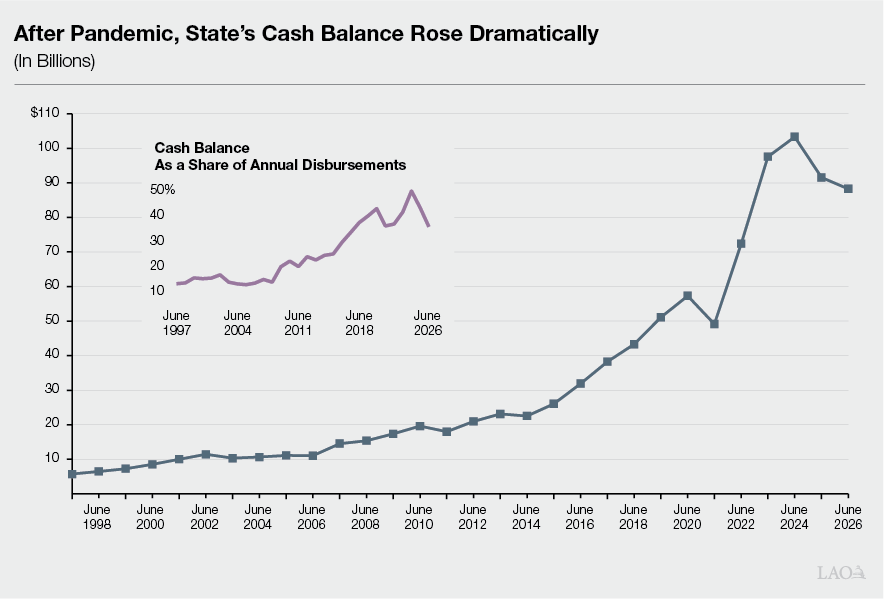
California’s Cash Balance Reached Astonishing $100 Billion. The state’s cash balance—the internal borrowable resources the State Controller uses to ensure the state can pay its bills on time—is very strong. It now sits around $90 billion, only modestly below the peak of over $100 billion held in May 2024. As shown below, the state’s cash balance has been rising for some years, but it rose most dramatically after the pandemic in 2020. This is all the more remarkable given the situation less than two decades ago: during the Great Recession, California faced a cash crisis, with cash nearing administrative minimums while a frozen credit market nearly precluded emergency borrowing.
This Balance Results From Unplanned Cash in Special Funds, Not Necessarily an Inherent Sign of Fiscal Strength. The state’s cash balance has remained strong despite weakness in the state budget—double digit deficits in 2023‑24, and persistent structural shortfalls since. This is because the state’s cash balance and its General Fund budget condition can be related but are not directly linked. Rather, most of the balance increase reflects unplanned cash that built up in special funds: money that has been appropriated but not yet disbursed, now representing about half of all special fund balances. These balances accumulated for several reinforcing reasons—increased state and federal infrastructure funding occurred simultaneously with supply chain constraints and slowing project time lines, the pandemic‑era General Fund revenue surge spilled into special funds through transfers and loans, and federal funds surged such that departments rationally drew down those time‑limited funds before their own state fund balances. Beyond unplanned cash, reserves also built up during the surplus years—which does reflect genuine fiscal strength—and new funds and expanded services have added modestly to balances since 2020.
Having This Much Cash Has Been Useful to the State… A large cash balance confers genuine benefits. The state’s ability to manage daily cash flow without external borrowing saves interest costs and reduces bond market dependence. California has not needed to borrow for cash flow purposes in more than a decade and has not been at risk of a cash crisis, despite a sharp revenue decline in 2022‑23 and significant budget deficits since. Beyond routine cash flow management, the state has also used its cash balance to advance specific policy goals and has used indirect borrowing from cash resources to balance the General Fund budget. This latter borrowing occurred via two “maneuvers”—which essentially allow the state to make cash payments now while deferring their recognition in the budget to future years, effectively using the cash balance for an interest‑free loan.
…But Over Reliance on Cash Borrowing Carries Real Risks. Using the state’s cash balance in these ways is not without trade‑offs and risks. These maneuvers create real future obligations that are invisible in standard budget documents. Further, cash borrowing carries two structural risks that make it a poor substitute for more conventional budget solutions. First, the policymakers and taxpayers who benefit from deferring costs today will not always be the same ones who must repay them, creating an incentive to borrow and a disincentive to repay. And, second, repayment must be proactive: if repeatedly deferred, the obligation grows and the tool eventually disappears. As such, in this report, we recommend the Legislature treat cash borrowing as an option of last resort, maintain its planned repayment schedules, and avoid any further delays.
Maintaining Cash Vigilance Is Critical. The state’s cash balance has already declined somewhat from its May 2024 high, and we expect it to continue declining. In particular, this will occur as the backlog of infrastructure funds eventually works through the system, as pandemic‑era federal programs unwind, and if the state continues to use reserves to address deficits. This decline should be viewed as normal and expected—it reflects the unwinding of the dynamics described in this report, not fiscal deterioration. Nonetheless, we recommend the Legislature avoid actions that accelerate that decline unnecessarily. This would include further cash borrowing to balance the budget, or further delays in repaying existing maneuvers. The state has come a long way from the cash crisis of the Great Recession. We recommend the Legislature preserve that fiscal resilience, particularly given heightened economic and financial market uncertainty.
Introduction
The state’s budget and cash situations are related but distinct concepts. The budget is a plan. Each year, the Legislature and the Governor agree on how much the state will commit in expenditures and expect to receive in revenues over the coming fiscal year. The cash position is the daily reality. It reflects the actual expenditures (or disbursements) leaving state accounts and actual revenues (or receipts) arriving in them. Revenues are received unevenly throughout the year—with about half the state’s General Fund revenue coming in just four months: December, January, April, and June. In contrast, disbursements occur relatively continuously. These normal, seasonal cash flows occur even when the budget is in balance.
As a result of these normal fluctuations, the State Controller (Controller) must borrow to pay the state’s bills on time. The Controller has the option to borrow externally—for example, from the bond market. But the Controller’s first choice is always to borrow internally from the state’s own cash balance—essentially from the money held in all of the state’s borrowable funds.
Less than two decades ago, during the Great Recession, California faced a cash crisis. The Legislature passed the 2008‑09 budget on September 15, the same day Lehman Brothers filed for bankruptcy. By November, the state’s cash balance stood around $4 billion—critically low compared to monthly disbursements that were around double that figure. But when California approached the bond market for cash flow borrowing, officials found the U.S. credit market had frozen, partly in response to the uncertainty following Lehman Brothers’ collapse. In the months and years that followed, the Governor, Legislature, and Controller needed to take extraordinary actions to ensure the state could pay its bills.
Since then, the turnaround in the state’s cash balance has been remarkable. Although the balance today is somewhat lower than the $107 billion peak in May 2024—with internal borrowable resources now sitting at just over $85 billion, or 35 percent of annual disbursements—the state’s cash balance is strong. This remains the case even though the budget condition is weak. Specifically, since the COVID‑19 pandemic, California’s General Fund budget condition has swung dramatically—from double digit surpluses in 2021‑22 and 2022‑23, to double digit deficits in 2023‑24, which have persisted since.
Understanding why these two things can be true simultaneously—a strong cash balance despite a weak overall budget—and the implications, is the central purpose of this report. Specifically, we: describe the nature of the state’s cash balance, explain the reasons it increased so dramatically after 2020, describe how the state has used this surge of cash, weigh the trade‑offs of holding—and using—a large cash balance, and assess whether high balances are likely to persist.
What Is the State’s Cash Balance and Why Is It Important?
Controller Manages Daily Cash Flows. The Controller is responsible for ensuring the state pays its bills on time—a function that requires managing billions of dollars on a day‑to‑day basis. (As described in the box below, we refer to this daily reality as the state’s cash position.) On any given day, the state might receive billions of dollars more in revenues than it has in expenditure disbursements (or vice versa). Because major revenues arrive in concentrated bursts while disbursements occur more continuously, the General Fund routinely faces weeks and months where outflows significantly and consistently exceed inflows, even in years when the budget is structurally balanced.
Key Terms
Cash Balance. Throughout this report, we use the term “cash balance” to refer to the total borrowable resources available to the state. This is the aggregate of cash held in special funds, reserves, nongovernmental cost funds, and federal funds that the State Controller is permitted by law to draw upon to cover temporary General Fund cash shortfalls. These loans draw down the state’s cash balance.
Cash Position. Throughout this report, we use the term “cash position” to refer to the day‑to‑day liquidity situation of the General Fund. Because revenues are received unevenly throughout the year while disbursements are made more continuously, the General Fund’s cash position fluctuates significantly day to day, even when the annual budget is in balance. When the cash position turns negative, the Controller draws on the cash balance to ensure the state can pay its bills on time.
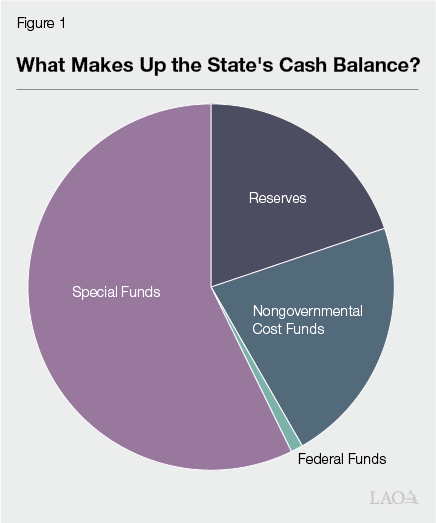
Cash Balance Allows Controller to Manage Daily General Fund Cash Shortfalls. To cover temporary cash shortfalls in the General Fund, the Controller first draws on internal borrowable resources—which we refer to as the state’s cash balance. Essentially, the state uses short‑term loans from its cash balance to support General Fund expenditures, and those loans are repaid as soon as the General Fund has capacity to do so. For practical purposes, four main types of funds make up the cash balance, as shown in Figure 1. (Bond funds are not one of the types because bond proceeds are restricted and cannot be used for internal borrowing.) They are:
- Special Funds (57 Percent). Most of the state’s cash balance is held in special funds. These are funds that receive revenues from specific taxes, licenses, and fees, which are designated for particular purposes by law. Examples include: the Motor Vehicle Account (funded primarily by vehicle registration), the Greenhouse Gas Reduction Fund (or GGRF, funded by cap‑and‑invest auction proceeds), and transportation funds (funded by the gas tax, among others).
- Non‑Governmental Cost Funds (NGCFs) (22 Percent). Like special funds, NGCFs receive revenues from specific, dedicated sources rather than general taxes. The key distinction is that NGCFs hold money that belongs to, or is held on behalf of, other entities—such as employees, benefit recipients, or private parties—rather than the state for use on state programs. Examples include: the State Disability Insurance Fund, which holds payroll contributions from workers to pay disability benefits, and the State Lottery Fund, which holds lottery proceeds before a share is distributed to public schools, colleges, and universities. Although the underlying money is not the state’s own, most NGCF’s cash balances are borrowable for short‑term cash flow purposes.
- Reserve Funds (20 Percent). The state’s reserves receive transfers from the General Fund and hold cash until it is needed during a revenue downturn. The three main reserves are the Budget Stabilization Account (BSA), the Public School System Stabilization Account (PSSSA), and the Special Fund for Economic Uncertainties (SFEU).
- Federal Trust Fund (1 Percent). On any given day, the state’s cash balance likely includes a transitory balance in the Federal Trust Fund—essentially, the daily float of federal reimbursements in transit. Federal law requires the state to transmit these funds on a timely basis. This balance is relatively small and fluctuates based on the timing of federal payments.
Importantly, General Fund loans from the state’s cash balance are to never jeopardize the proper functioning of those accounts, including disbursements of their own expenditures.
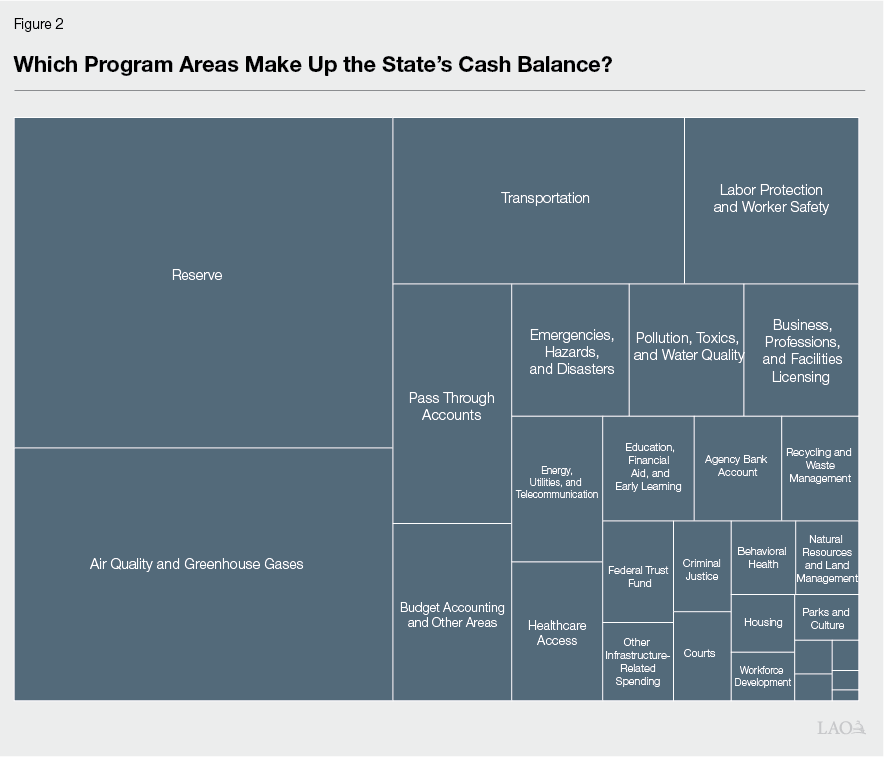
State’s Cash Spread Across Many Program Areas. Figure 2 shows the distribution of the state’s cash balance by program area. Certain areas carry disproportionate balances—most notably reserves, air quality and greenhouse gases (which includes GGRF), and transportation. However, the overall cash balance is spread across many hundreds of funds spanning more than a dozen program areas. This diffuse structure is important context: apart from GGRF and the BSA, there is no single account whose drawdown would significantly change the cash balance. As such, understanding the state’s cash balance as a whole necessitates a case study approach.
When the Cash Balance Is Insufficient for Cashflow Needs, State Uses External Borrowing. Sometimes the cash balance is insufficient to address the General Fund’s cash flow needs. In these cases, the state borrows externally from municipal bond investors. There are two types of external borrowing instruments. First, revenue anticipation notes (or RANs), which are routinely used cash flow borrowing instruments usually issued shortly after the budget is passed and mature before the following June. In less frequent cases, the state has needed to use revenue anticipation warrants (or RAWs, but technically called registered reimbursement warrants), which can mature after the end of the fiscal year. Unlike RANs, RAWs allow the state to borrow across fiscal years. (If the state faces very serious cash problems, the Controller also has some more extraordinary measures to manage the state’s cash flows, including delaying payments administratively and issuing IOUs.)
Due to Cash Balance, the State Has Not Used External Borrowing in Over a Decade. Because of the state’s large cash balance, California has not needed to issue a RAN since 2014‑15. This has saved the state some money in interest costs and marginally reduced its dependence on credit markets. Further, even though the state experienced a sharp revenue decline in 2022‑23, and significant budget deficits since, California has not been at risk of a cash crisis or a cash crunch as it has in previous revenue downturns, for example, during and immediately after the Great Recession, and in the early 2000s after the dot‑com bust. In fact, the state’s cash balance has remained robust and the Controller has continued to exclusively rely on internal borrowing to manage the General Fund’s cash position throughout these deficit years. The nearby box explains why the state’s cash balance has remained strong despite revenue declines and structural shortfalls.
Why Has Cash Remained High Despite Revenue Declines and Structural Shortfalls?
General Fund revenues declined sharply in 2022‑23 and although they have since recovered, the budget still faces structural shortfalls. A reasonable question is: why didn’t the state’s cash balance decline when the budget situation did?
General Fund Revenues and Cash Balance Can Be Related… While the state’s cash position (the day‑to‑day cash the state uses to manage outlays) and General Fund budget are directly related, the relationship between the cash balance and the General Fund budget is less direct. The state’s cash balance does not fluctuate day‑to‑day but might be needed during a budget shortfall when the General Fund is less likely to be able to pay its bills on time. And the cash balance might grow during surplus years when the state is making reserve deposits or transfers and loans to special funds.
…But Are Not Directly Linked. But the General Fund budget situation (especially revenues) and the state’s cash balance are not directly linked. Most of the cash sitting in special funds comes from dedicated revenue sources—gas taxes, cap‑and‑invest auction proceeds, and fees—that are largely insulated from the income and capital gains volatility that drives General Fund swings. Further, the infrastructure disbursement backlog that is one driver of the high cash balance is a long‑running structural phenomenon. It was partly set in motion by federal and surplus‑era spending decisions (along with pandemic impacts on the supply chain), but it will unwind on project time lines—over years, not quarters—and is largely unaffected by whether the General Fund is running a surplus or a deficit in any given year.
Cash Balance Reached Astonishing $100 Billion
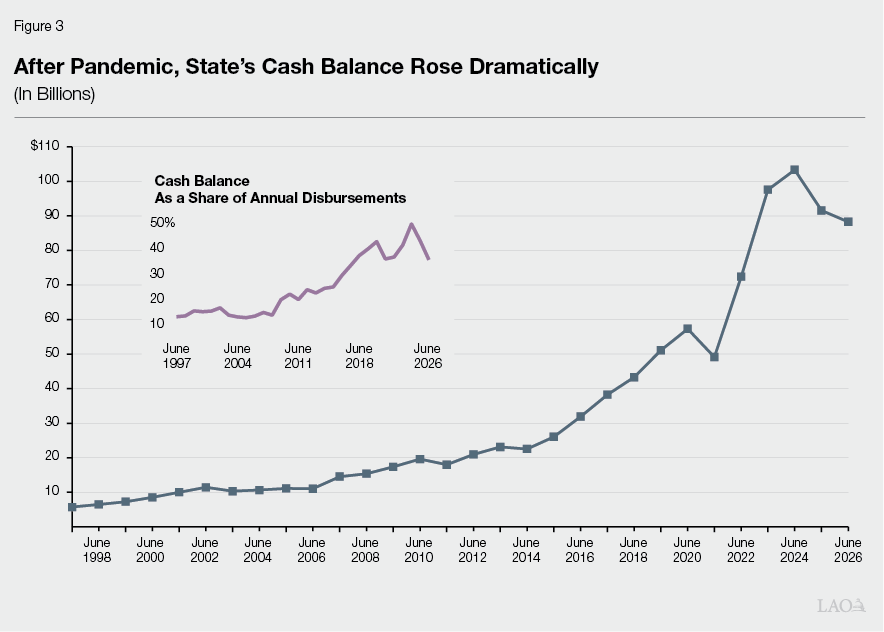
On May 31, 2024, the state’s cash balance reached $107 billion—representing about half of annual General Fund disbursements and the biggest cash peak in history. Figure 3 shows the state’s cash balance over time. As the figure shows, the balance rose appreciably after the Great Recession, and dramatically after the pandemic in 2020. As the inset in Figure 3 shows, over the same period, the cash balance also increased as a share of annual General Fund disbursements, from around 10 percent to 15 percent before the Great Recession to nearly 50 percent in the years following the pandemic. As of June 30, 2026, the cash balance has declined slightly from the peak of $107 billion to around $86 billion. That said, this figure understates the degree to which the state’s liquidity has improved since those years. Particularly in 2002 and 2003, as well as in 2009 and 2010, there were midyear months when the state’s cash ran dangerously low. In the more recent years when the state’s cash balances have ballooned, no such intra‑year shortages have occurred.
Why Did the Cash Balance Grow Dramatically?
In this section we describe why the state’s cash balance increased so dramatically after 2020. Broadly, there were three major drivers:
- Unplanned Cash. The largest driver was unplanned cash—money that accumulated in special funds as appropriations were disbursed more slowly than budgeted.
- Reserves. Reserves were built up during the surplus years and have since been drawn down to address General Fund deficits.
- New Funds and Services. New funds have been created and some existing state services expanded since 2020.
The remainder of this section walks through each of these explanations in turn. In addition, the nearby box addresses two explanations that would seem reasonable but that the data do not support.
What Did Not Drive This Growth
Before explaining what caused the increase in the state’s cash balance, it is worth setting aside wo reasonable explanations for the increase that the data do not support.
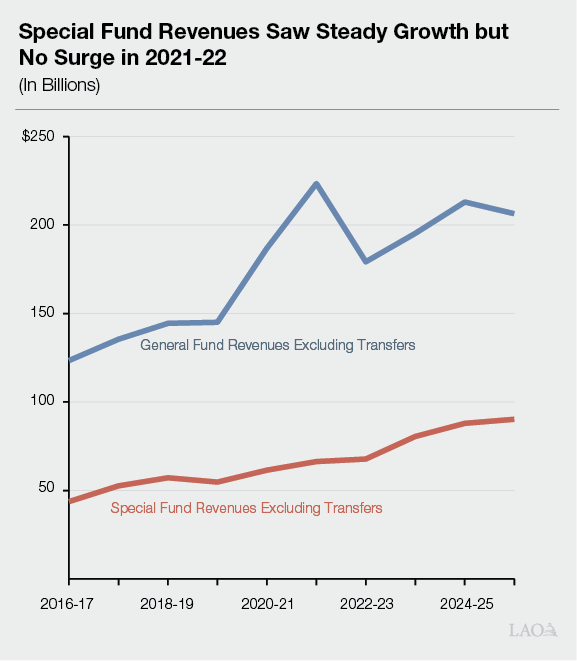
Special Fund Revenues Grew Over the Period, but Did Not Surge in 2021‑22. Because General Fund revenues surged between 2020 and 2022, it might be reasonable to expect that special fund revenues also grew at above average rates over these years. However, unlike the personal income tax—which drove the General Fund’s extraordinary surpluses in 2021‑22 and 2022‑23—most special fund revenue sources (gas taxes, registration fees, and cap‑and‑invest auction proceeds) grew in line with historical trends over the whole period (see the figure below). (One exception to this is the Behavioral Health Services Fund, which is an account whose revenues are derived from high income earners.) In other words, the rapid increase in the state’s cash balance in 2021 specifically is not primarily a special fund revenue story, although growth in special fund revenues almost certainly have contributed to rising cash balances over the last decade.
Planned Reserve Balances Did Not Increase Appreciably. A second reasonable explanation for the increase in balances would be more cautious budgeting overall—that fund administrators and the Department of Finance have increasingly planned on higher reserve balances for some funds. However, the budgeted ending balances of most special funds—what the administration and Legislature intend those funds to hold at year‑end—also remained stable over this period.
The Rise of Unplanned Cash in Special Funds
As with the General Fund, the Legislature and administration adopt spending levels for each of the state’s special funds annually. The California budget also includes an administration‑produced plan for revenues, expenditures, and the resulting year‑end balance. When actual cash in a fund at year‑end exceeds the budgeted balance, we call the difference “unplanned cash.” Unplanned cash is, by definition, temporary—the underlying money has been appropriated and will eventually be disbursed. That said, it can persist for years when project delays and capacity constraints slow spending. In short, unplanned cash is money that has been committed on a budgetary basis but has not yet been disbursed.
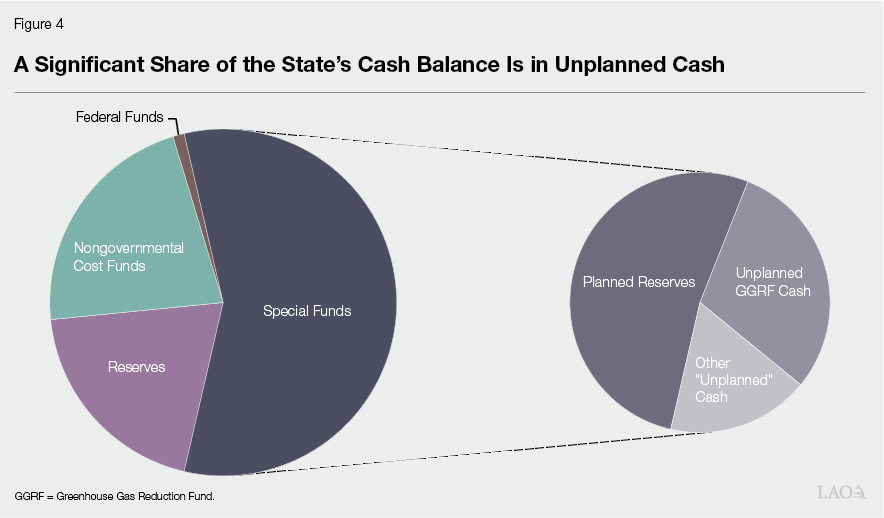
A Significant Share of the State’s Overall Cash Comes From Unplanned Cash. Figure 4 shows that, as of June 30, 2026, about half of the total cash in special funds—or $23 billion—is unplanned. Of this, nearly $15 billion is unplanned cash attributable to GGRF (the planned reserve for GGRF at end of 2025‑26 is $121 million, which is less than 1 percent of $15 billion). The remaining $9 billion in unplanned cash is associated with all other funds.
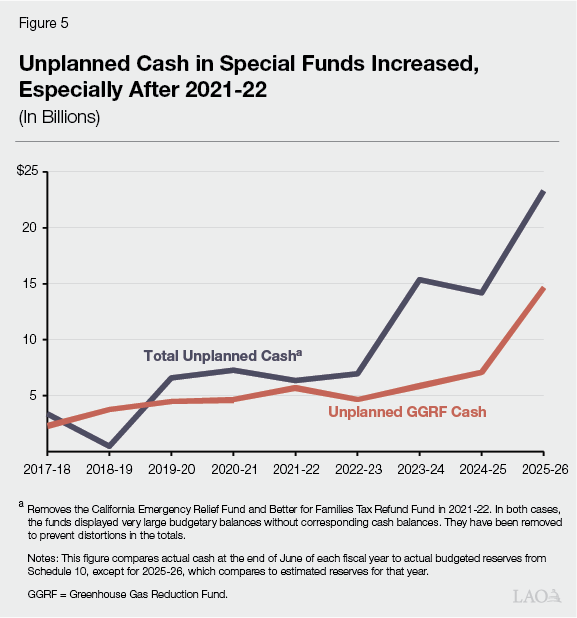
Prior to the Pandemic, the State Did Not Appear to Have Significant Unplanned Cash. We do not have complete data on cash balances held in funds prior to 2017‑18. From the data we have, unplanned cash in special funds appears to be a relatively new phenomenon. Figure 5 shows total unplanned cash across all funds, including GGRF but excluding reserves, for the end of 2017‑18 (the first year for which we have data) to the end of 2025‑26. (Data for each year reflects Controller’s cash data as of June 30 compared to Department of Finance data on reserves for the end of that fiscal year.) As the figure shows, prior to 2022‑23, special funds unplanned cash balances were consistently below $7 billion or so. After 2022‑23, however, unplanned cash increased significantly. (We think it is reasonable to infer that unplanned cash is at an all‑time high given the acceleration of the balances shown in Figure 5.) About half of this increase was driven by GGRF, shown by the red line, with the remaining increase attributable to a collective of all other hundreds of special funds.
Given the diffuse nature of this cash, we do not have good ways of isolating causes across all funds. However, in the remainder of this section, we try to explain why this rise of unplanned cash has occurred using a case study approach.
What Has Contributed to Unplanned Cash?
To conduct this analysis, we identified the largest special funds with unplanned cash and conducted case studies of each, including discussions with fund administrators. Across funds, three themes recur with enough consistency that we believe they explain a substantial share of the rise in unplanned cash. First, increased state and federal funding for infrastructure projects coincided with slowing project time lines, leaving large balances especially in transportation and climate‑related funds. Second, the General Fund revenue surge that followed the pandemic spilled into special funds through transfers and loans. Third, departments rationally chose to draw down time‑limited federal funds before state special fund balances, accumulating the latter in the process. The remainder of this section walks through each of these explanations in turn.
Infrastructure Project Disbursements Slowed While Funding Increased
Disbursement of Infrastructure Money Often Takes Years but Has Slowed Further. Disbursing funds for infrastructure and construction has always been relatively slow compared to other types of appropriations. Construction projects usually require planning, environmental review, design, and procurement before money is actually spent. Since the COVID‑19 pandemic, these time lines have lengthened further. Labor shortages, supply chain disruptions, and cost escalation have all contributed to reported delays. At the same time, both the state and federal governments dramatically increased spending on infrastructure shortly after the pandemic. For example, in 2022‑23, following a $55 billion General Fund surplus and $32 billion surplus within the school and community college budget, the state spent more than $20 billion on capital outlay projects, including for housing, broadband, energy projects, and school facilities. On the federal side, the Infrastructure Investment and Jobs Act (IIJA) passed in 2021, including billions of dollars more in federal resources to California for roads and bridges, public transit, water and wastewater, broadband, and power grid modernization.
Transportation Funds Exemplify This Dynamic. One area where these trends are most visible is transportation. For example:
- Trade Corridor Enhancement Account (TCEA). TCEA funds the Trade Corridor Enhancement Program, an ongoing competitive program enacted under Chapter 5 of 2017 (SB 1, Beall) that supports state and local freight corridor improvement projects. TCEA expenditures have continued to come in below expectations, which has added to the account’s cash balance over time. This is partially attributable to the nature of large transportation projects—such as those funded through the Trade Corridor Enhancement Program—which typically take six to eight years from design through construction to final payment. As a result, even well‑managed transportation programs will carry large unspent balances as projects work through the pipeline. These timing effects are further compounded by construction delays and the fact that many projects funded through the Trade Corridor Enhancement Program are locally led, which means the state has less direct control over their pace.
- Road Maintenance and Rehabilitation Account (RMRA). RMRA funds state highway maintenance and rehabilitation projects managed by the California Department of Transportation and supports several competitive programs that fund state and local projects. Similar to TCEA, RMRA’s cash balances are partially attributable to the long delivery time lines of transportation projects and the state’s more limited control over the pace of locally led projects. In addition, RMRA spending is affected by other state accounts and federal funds. In particular, the department has prioritized spending additional federal dollars from IIJA before drawing on state sources. The department has also continued to rely more heavily on the State Highway Account, its historic funding source for many of the same activities supported by RMRA. Taken together, these factors have slowed RMRA expenditures and contributed to the account’s cash balance.
GGRF Also Exemplifies This Theme. GGRF provides perhaps the most detailed illustration of this theme. The GGRF‑funded Affordable Housing and Sustainable Communities program usually involves a two‑to‑five‑year gap between when funding is awarded and when construction is complete and funds are actually disbursed. In recent years this gap has expanded as a result of transportation components of funded projects, workforce challenges from the pandemic years, changes in project review, and rising construction costs. Other GGRF programs likely face similar challenges, although we have less information on them. The box below provides more detail on what we know about the cash balance of GGRF.
Greenhouse Gas Reduction Fund (GGRF) Currently Has $15 Billion in Cash
In cash terms, GGRF is the single largest fund in the state’s cash balance. As of June 30, 2026, it has nearly $15 billion in cash, which represents 17 percent of the state’s total cash balance. The planned balance in the fund for that date is around $100 million—less than 1 percent of this cash. We do not have good information why—that is, which projects and programs have delayed disbursements that have resulted in this accumulation of cash. This box explains what we do know about GGRF cash.
GGRF Allocates Cap‑and‑Invest Funds to Wide Variety of Purposes. GGRF receives proceeds from the state’s cap‑and‑invest program. Under the program, the California Air Resources Board (CARB) sets a declining, aggregate cap on the amount of greenhouse gases allowed to be emitted under the program. Then, CARB issues a set number of allowances each year equal to the annual cap. (An allowance is essentially a permit to emit one metric ton of carbon dioxide equivalent.) Historically, under CARB’s regulations, a portion of these allowances have been sold at quarterly auctions, with proceeds deposited into GGRF. GGRF funds a broad range of different programs and activities with this money, including related to low‑carbon transportation, transit, housing, wildfire resilience, drinking water, energy, and environmental protection.
Themes Are Similar. In conducting this analysis, we had several conversations with fund administrators at CARB and departments administering GGRF‑funded programs to understand what makes up the GGRF cash balance. Thematically, we believe the story is consistent with the broader findings in this report. A significant share of GGRF spending goes toward programs that involve infrastructure and capital programs where the gap between award and disbursement can span several years. In addition, for programs where other funding sources—such as the General Fund, federal funds, or Proposition 1A (2008) bond funds (in the case of the high‑speed rail project)—were appropriated for programmatically similar purposes, fund administrators often chose to spend non‑special fund monies first.
Limited Data on Cash Balance. That said, in our conversations, it was clear that there is very little specific and aggregated information on the reasons for the substantial cash balance in GGRF. CARB publishes data on the amount of GGRF awarded (generally when an administering agency has committed funding to a project, such as through a grant agreement) and implemented (generally when a recipient has received funds and has estimated benefits—such as greenhouse gas reduction—that can be attributed to it). However, this reporting is not directly related to cash. For example, in the case of the Affordable Housing and Sustainable Communities Program (AHSC), CARB generally considers projects to be “awarded and implemented” when a project’s housing component has secured full funding from all sources (not just from AHSC) and the project signs what is known as a “Standard Agreement.” However, in some cases, projects can receive cash on a reimbursement basis both before and after a Standard Agreement is signed, making CARB’s reported amounts a poor measure of GGRF cash flow.
General Fund Revenue Surge Spilled Into Special Funds
Although special funds did not experience a direct revenue surge in 2021 (as discussed in the box previously, they benefited indirectly from the General Fund’s post‑pandemic windfall. This occurred in some cases because the Legislature used General Fund resources to address structural deficits in accounts. In other cases, the Legislature transferred or loaned money to these funds to fund new or existing services. Further, related to the previous discussion, some of these funds have been slow to be disbursed due to challenges in spending down infrastructure money. Two examples include:
- Toxic Substances Control Account. The Toxic Substances Control Account balance rose from $37 million in 2020‑21 to $192 million in 2021‑22, primarily because of General Fund loans the state provided to fund cleanup at the former Exide lead‑acid battery recycling facility in Vernon and in the surrounding residential communities. That cleanup work has proceeded slowly—particularly residential cleanup, which is conducted parcel by parcel, pending resident approval. The account still holds roughly $106 million in cash against $43 million in planned reserves.
- Kindergarten Facilities Account. The Kindergarten Facilities Account received a $490 million General Fund appropriation in 2021‑22. Grant funds have been fully committed on a budgetary basis—the planned reserve is now $33 million—but $68 million in cash remains in the account. The discrepancy reflects the mechanics of capital grant programs: the Office of Public School Construction approves projects and holds funds on behalf of school districts, which then have up to three years to spend them. Before the state releases funding, districts must meet several requirements, such as obtaining design approval from the Division of the State Architect and exhausting their local match.
Departments Prioritized Time‑Limited Funds
With the arrival of significant new federal funding, especially through the IIJA, state departments drew down federal funds first, because those funds carried expiration dates, and preserved state special fund balances for later. This was sensible program management but contributed to the accumulation of state special fund cash during the peak years. The effect was especially pronounced in transportation, where IIJA dollars supplemented existing SB 1 fund revenues and departments managed their drawdown accordingly. As federal funds have been exhausted, this dynamic has largely run its course—but it contributed meaningfully to the run‑up in cash from 2021‑22 through 2023‑24.
Reserves Increased After 2020‑21, but Have Since Declined
The second explanation for an increase in the state’s cash balance is reserves. Figure 6 shows the balance of the state’s reserves—including the BSA, PSSSA, SFEU, and Safety Net Reserve—from June 30, 2016 to June 30, 2026.
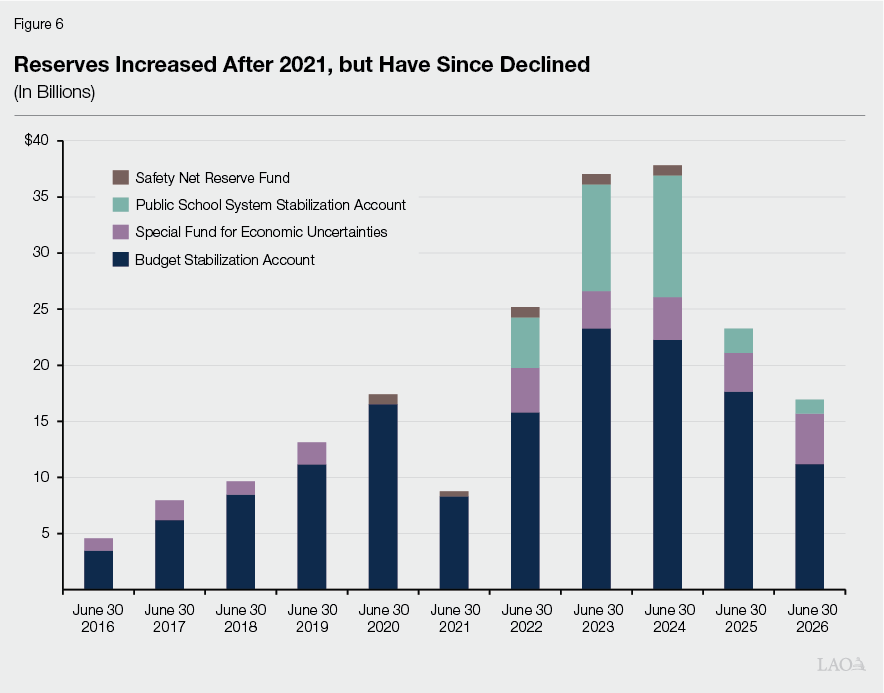
Reserves Rose Steadily After 2014. After the 1980s, but prior to 2014, the SFEU was nearly exclusively used as the state’s budget reserve. Throughout this period, the SFEU balance was generally enacted around 1 percent to 3 percent of revenues—very small compared to the state’s overall budget and potential deficits. In response to the state’s significant budget problems during the Great Recession, voters passed Proposition 2 in 2014, making significant changes to the state’s reserve policy. Among other changes, Proposition 2 created the PSSSA and established new constitutional requirements to deposit a share of capital gains‑driven revenues into both the BSA and PSSSA.
Reserves Declined in Response to Revenue Shortfalls. In 2020‑21, the state withdrew roughly half of its reserves to address a projected budget problem—a withdrawal that proved unnecessary as revenues surged. In the two following years, reserves were rebuilt through large mandatory deposits driven by the historic revenue surge. Since 2024‑25, the state has drawn down a substantial share of its reserves to address ongoing General Fund deficits. As of June 30, 2026, the BSA held about $11 billion and the PSSSA held approximately $1 billion. The state budget includes a plan to deposit over $3 billion into the BSA later in 2026‑27 and about $8 billion into the PSSSA.
State Created Some New Funds and Services
The third explanation for the increase in the state’s cash balance is the expansion of existing state services and the creation of new funds and services since 2020. As far as we can tell, this explanation is smaller in scale than the previous two but is still a discernible trend worth noting. Understanding it requires distinguishing between two different dynamics: existing programs that were scaled up and generated more cash than could be quickly disbursed, and the creation of entirely new funds whose initial capitalizations left them carrying balances. We describe each of these below.
Expansions of Existing State Services. Some of the growth in special fund cash reflects expansions of programs that already existed in 2020. The transportation funding picture following SB 1 provides an example. Senate Bill 1 significantly increased transportation revenues by increasing fuel taxes and vehicle fees. It also established new funding allocations into existing and newly created accounts, including the RMRA and TCEA. These accounts now receive a large and predictable annual revenue stream, regardless of how quickly projects can be designed, approved, and built. Because transportation projects typically require six to eight years from design through construction and closeout—and because projects have gotten larger and more complex—SB 1 has contributed to these accounts carrying higher balances over time.
Creation of New Funds and Services. Several new funds were created to implement new state services, and a number carry large cash balances as a result. They include:
- Medi‑Cal County Behavioral Health Fund. This fund was created to support California Advancing and Innovating Medi‑Cal’s behavioral health payment reform, which replaced the certified public expenditures approach with an intergovernmental transfer process beginning in 2023. Under the new structure, counties deposit their share of Medi‑Cal behavioral health costs into the fund; the state forwards that amount to the federal government; and federal reimbursement flows back to counties. Counties are encouraged to maintain three months of projected expenditures in the fund as a standing reserve, and the state provided initial capitalization when the fund was launched. The result is a fund that will carry a perpetual minimum balance—one that grows automatically as program utilization increases.
- Health Care Affordability Reserve Fund. This fund was created in 2021‑22 to support affordability efforts for Covered California enrollees. It was capitalized with $333 million tied to individual mandate penalty revenues, which the state began collecting in 2020‑21. Enhanced federal premium subsidies temporarily reduced the need for state premium subsidies, so the fund initially operated as a reserve. Beginning in 2023‑24, the fund supported cost‑sharing reductions for certain Covered California enrollees. With enhanced federal subsidies expiring at the end of 2025, fund spending has shifted toward premium subsidies for lower‑income enrollees, though the fund balance is expected to remain elevated in the near term as prior loans to the General Fund are repaid.
- 988 State Suicide and Behavioral Health Crisis Services Fund. This fund was created in 2022 to support the state’s 988 Suicide and Crisis Lifeline. Its primary revenue source is a telephone surcharge—initially set at 8 cents per line—that the state began collecting on January 1, 2023. Because the fund did not exist prior to 2022, its cash balance grew entirely from zero after 2020, making it a straightforward example of a new policy creating new cash.
- Safe and Affordable Drinking Water Fund. This fund provides funding to help small and disadvantaged communities access safe drinking water. The fund had no balance in 2020 soon after it was first established and has since grown to a meaningful size as the program was stood up and capitalized. As with several other funds in this section, the balance reflects the gap between when funds were appropriated and when the underlying program activities—which involve grants and infrastructure work in communities across the state—can be fully executed.
- Diablo Canyon Extension Fund. This fund was created to hold proceeds from a state loan to the Pacific Gas and Electric Company to support the five‑year extension of the Diablo Canyon Nuclear Power Plant. It had no balance in 2020 and grew to a significant cash balance after the loan was made.
In What New Ways Has the State Used This Cash?
Over the past decade or so, the state has used its large cash balance in two new ways, including to: (1) advance certain policy goals, and (2) balance the budget. In this section, we describe each of these uses of the state’s cash, which differ in their visibility, policy implications, and risks.
Advance Policy Goals
Beyond routine cash flow management, the state has used its significant cash balance to make direct loans in order to advance specific policy goals. Because they are structured as loans, they include repayment schedules, either via the General Fund or other sources. These loans have also been outlined in law, sometimes included as part of the budget process, and appear in the Controller’s monthly cash statements. They include:
- California Public Employees’ Retirement System (CalPERS) (SB 84). As part of the 2017‑18 budget package, Chapter 50 of 2017 (SB 84, Committee on Budget and Fiscal Review) approved a proposal to borrow $6 billion from the state’s cash balance to make a one‑time supplemental payment to CalPERS. The General Fund and special funds repay this borrowing over time but also pay in annual pension contributions as a result, resulting in net savings over time.
- Utilities Liabilities (AB 1054). Chapter 79 of 2019 (AB 1054, Holden) created a fund to help cover the costs of investor‑owned utilities’ liabilities for wildfire claims when those utilities are legally liable and financed the fund with a loan from the state’s cash balance. This loan was paid back by the utilities with funds from other sources, including shareholder contributions and revenue bonds backed by charges on ratepayers.
Balance the Budget
The second new use of the state’s cash balance is the least visible: using indirect borrowing to balance the General Fund budget (which we term “maneuvers”). These cash maneuvers follow a basic structure: cash leaves the treasury, but the budgetary expenditure is deferred, generating budgetary paper savings today at the cost of an obligation in future years. In effect, these borrowings constitute interest‑free internal loans backed by the state’s cash balance. They are not visible in either the Controller’s monthly cash statements or standard budget documents as produced. The two most notable examples of these are:
- Proposition 98 Maneuver. The 2024‑25 budget used a Proposition 98 maneuver to address $6.2 billion in General Fund payments to school districts that had already been distributed on a cash basis but exceeded the revised Proposition 98 minimum funding requirement. The excess arose from an unusual sequence of events: throughout 2022‑23, the Controller distributed funds to schools based on expenditure levels approved in June 2022 and 2023. However, a severe and unprecedented late‑arriving decline in income tax revenues occurred at the same time, with collections down 25 percent. Unfortunately, due to a federal and corresponding state change in tax filing deadlines, the state only gained a complete picture of 2022‑23 tax collections late in 2023, well after the fiscal year had ended. This retroactively reduced the Proposition 98 minimum requirement. Rather than recouping $6.2 billion from schools or recognizing the expenditure immediately, the budget generated short‑term savings by not recognizing the payments on a budgetary basis. This allows schools to keep the cash while deferring the state budget impact over multiple years. Under current law, these repayments will begin in 2028‑29 and the maneuver will be fully repaid by 2040‑41.
- Medi‑Cal Maneuver. Under state law, the administration can transfer funds to the Medi‑Cal Provider Interim Payment (MPIP) fund to help cover an appropriation deficiency in Medi‑Cal. On March 12, 2025, the administration notified the Joint Legislative Budget Committee that it had transferred $3.4 billion in General Fund resources—near the maximum allowed—to the MPIP fund to cover unanticipated cost increases in Medi‑Cal. The payment was made on a cash basis, but the state did not recognize this in the budget. Instead, recognition will be spread over multiple years and fully reflected by 2034, creating a future repayment obligation as the state gradually acknowledges cash that has already gone out the door.
While the state has used other forms of cost‑shifting before—payroll deferrals, special fund loans, budgetary deferrals—these maneuvers are otherwise unprecedented. The state’s large cash balance is what makes them possible: as long as there is sufficient cash in the treasury, the state can defer recognition of almost any amount of budgetary expenditure. However, as we explain below, these budget balancing techniques are not without risk.
What Are the Trade‑Offs?
This section assesses what the state’s large cash balance means for fiscal policy, including both advantages and risks. Our overall assessment is that the state has used its cash balance well in most respects, but that the new budget‑balancing mechanisms described in the previous section create real and underappreciated obligations that deserve legislative attention.
Large Cash Balances Have Advantages… A large cash balance confers genuine benefits. The state’s ability to manage daily cash flow without external borrowing saves interest costs and reduces bond market dependence—the risks of which were once made clear by the Great Recession‑era cash crisis. The absence of a cash crisis during the revenue declines of 2022‑23—in contrast to the IOUs and near‑defaults of the Great Recession era—reflects real resilience. And a portion of the state’s cash, particularly its reserve balances, represents deliberate fiscal prudence.
…But Are Not Necessarily a Broad Sign of State’s Fiscal Strength. The cash balance should not, however, be interpreted as a broad indicator of the state’s fiscal health. Most of the increase in the cash balance that has occurred since the pandemic is attributable to unplanned accumulations in special funds—money that has been appropriated and will eventually need to be disbursed. The General Fund itself has run deficits throughout this period. A large cash balance and a strained General Fund can coexist, and they have.
In Fact, Much of the State’s Cash Balance Represents Service Delivery Delays. A sizeable share of the state’s cash (and growth in that cash) comes from delays between when spending is allocated and when it is actually disbursed. As a result, when the Legislature comes into receipt of significant amounts of unexpected funds, especially for infrastructure, ensuring there is sufficient capacity to deliver those funds in a timely fashion is critical. That said, some balances in some funds are justified, particularly cash balances related to infrastructure projects, and largely unavoidable.
Cash Balances Create a “Reverse” Reserve… A reserve works by setting aside resources today so that future policymakers have a cushion when revenues decline. The short‑term cost (reduced spending today) is borne by current policymakers and taxpayers; the benefit (increased spending later) accrues to future ones. Cash borrowing can also function like a reserve—helping the state move money between periods when revenues fall short to years when revenues surge. But it reverses the dynamic: current policymakers and taxpayers receive the benefit (avoiding cuts or tax increases today), while future policymakers and taxpayers bear the cost (repaying the loans when the budget improves).
…But Carry Some Invisible Risks. Neither approach is inherently wrong—it is valid for policymakers to use reserves or borrowing to balance the budget. But cash borrowing carries two specific risks that reserves do not. First, the intertemporal mismatch is asymmetric. The policymakers and taxpayers who benefit from cash borrowing will not always be the same ones who will need to repay it. This creates an incentive to borrow and a disincentive to repay. Second, cash borrowing should be accompanied with prompt repayment. When the state’s budget position improves, these loans must be repaid so that the cash can be allocated to its intended purpose, or so that more loans can be made in the future. If repayment is repetitively deferred, the loans accumulate and the cash balance deteriorates. Creating very long repayment schedules—for example, ones that extend for many years and into subsequent decades—also presents similar risks, even if the state adheres to the schedule. In other words, unlike a reserve—which is replenished over time through mandatory deposits—cash borrowing must be proactively repaid or the tool disappears.
Maintaining Cash Vigilance Is Critical. While the state maintains a notable cash balance, we recommend the Legislature view relying on this capacity either for policy or budget benefits as an option of last resort. Given the trade‑offs associated with relying on cash options, we view building traditional reserves as the state’s best option toward building budget resilience. Moreover, we recommend the Legislature maintain its planned approach for repaying the outstanding cash maneuvers—or possibly accelerate the schedules if the budget allows in the future—and advise strongly against delaying those repayments further.
Will High Balances Persist?
We turn to the question of where cash balances are ikely to go from here.
Cash Balances Likely to Continue to Decline. The state’s cash balance has already declined somewhat from the high in May 2024. Over the coming years, we expect the balance to continue declining. We say this for three main reasons:
- Infrastructure Disbursement Acceleration. The backlog of appropriated but unspent infrastructure funds will eventually work through the system. The pace of this drawdown is uncertain—it depends on project time lines, federal fund availability, and departmental capacity—but the direction is clear.
- Federal Funding Exhaustion. Pandemic‑era federal programs and surpluses that prompted state departments to defer special fund spending have largely run their course. As federal and General Fund dollars have been exhausted, departments are already shifting back to state sources, drawing down special fund balances.
- Reserve Drawdowns. In recent years, the Legislature authorized withdrawals from both the BSA and PSSSA to address ongoing General Fund deficits. Structural deficits are also expected to persist in future years. To the extent the state continues to use reserves to balance budgets, the state’s cash balance will also decline.
Declines in Cash Balances Are Not the Same as Fiscal Deterioration. Just as a large cash balance should not be taken as an inherent signal of the state’s fiscal health, a declining cash balance is not inherently a sign of fiscal weakness. Rather, the likely coming decline will reflect the unwinding of the various dynamics discussed in this report.
Conclusion
What should concern policymakers is not the level of cash per se, but a specific risk: the cash balance declines to a level that threatens the state’s ability to manage routine cash flow. This would be particularly problematic if accompanied by broader weakness in the nation’s financial markets—as occurred during the Great Recession. Prior to that, the state managed its cash position with a cash balance in the range of $10 billion to $15 billion, representing around 15 percent to 20 percent of annual General Fund disbursements. After the Great Recession, and before the pandemic, the cash balance was closer to 25 percent to 30 percent of annual disbursements. Currently, the cash balance sits around 35 percent of disbursements. A continued decline toward the post‑pandemic range, would signal a return to normal rather than a fiscal crisis. A decline below the pre‑Great Recession range could be a genuine cause for concern and should prompt the Legislature to consider whether the pace of repayment for indirect cash loans needs to be accelerated.