Caitlin O'Neil

June 30, 2026
The 2011 Realignment of Adult Felony Populations:
Results and Key Takeaways
- Introduction
- What Is “Realignment”?
- What Was the 2011 Realignment of Adult Felony Populations?
- How Has Realignment Been Implemented?
- How Have Criminal Justice Populations Changed Over Time?
- Did Realignment Impact Crime and Recidivism?
- Key Takeaways
- Conclusion
- Appendix 1: Chapter 96 of 2023 (AB 1080, Ta)
- Appendix 2: Realigned Revenues by County and Fiscal Year
- Appendix 3: Jail Construction Financing
- Selected References
Executive Summary
In 2011, California shifted responsibility for incarcerating and supervising certain adult felony populations from the state to counties. The state also shifted a portion of tax revenues to counties to cover the additional costs. These changes were part of a larger shift of responsibilities known as the 2011 realignment. Pursuant to Chapter 96 of 2023 (AB 1080, Ta), this report provides information on how various aspects of the realignment of adult felony populations have been implemented and evaluates the results.
Looking Back at 2011 Realignment Implementation and Outcomes
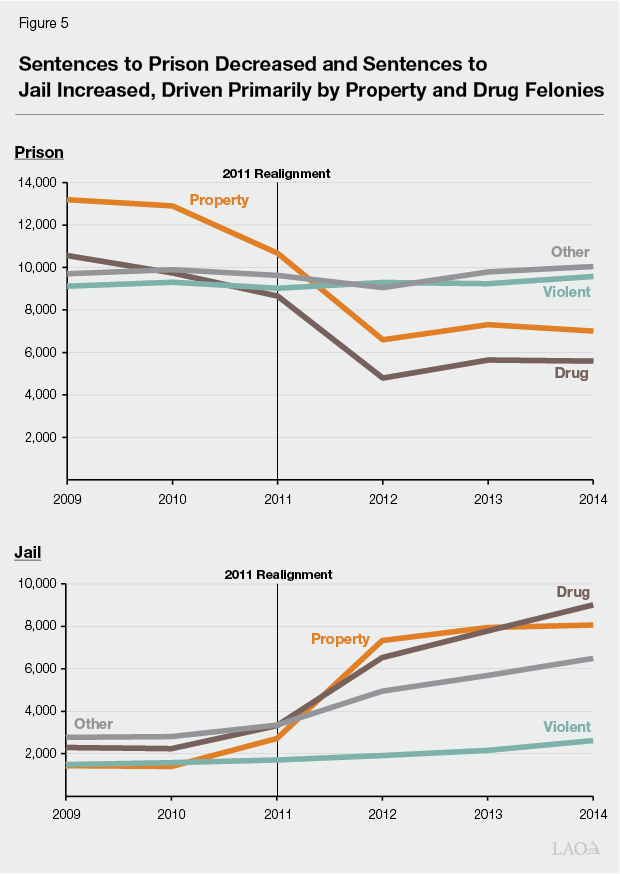
Prison Sentences Decreased and Jail Sentences Increased, Driven Primarily by Property and Drug Felonies. After the 2011 realignment, there was a distinct shift of sentences for property and drug crimes from state prison to county jail. Sentences for violent crimes were largely unaffected.
Increase in the Jail Population Was Smaller Than the Decrease in the Prison Population. Within one year of realignment taking effect, the jail population increased by about 8,500 people. However, the decrease in the prison population was about three times larger. The combined state and county criminal justice population—including those under community supervision—decreased by about 36,900 people (6 percent) between 2010 and 2012 and has generally continued to decline over the last decade primarily due to subsequent policy changes.
One Study Suggests Realignment Caused a Modest Increase in Property Crime. The most rigorous study available on the effects of realignment on crime found no evidence that realignment increased violent crime. However, it did find evidence that realignment increased California’s property crime rate, primarily by increasing the auto theft rate by 17 percent.
Key Takeaways From Review of 2011 Realignment
Improved Alignment of Incentives Within the Criminal Justice System. Prior to the 2011 realignment, counties made key sentencing decisions, but the state incurred most of the cost of incarceration for felony sentences. This structure gave counties a broad fiscal incentive to pursue felony sentences, even though they are generally the most costly option. After realignment, counties now bear a greater share of the costs of felony sentences. As a result, county decisions about sentencing now incorporate the costs of incarceration for many felony sentences—thereby better aligning counties’ costs with their decision‑making authority.
Led to a Large Decrease in Caseload but a Comparatively Small Increase in Crime, Suggesting a Potential Improvement in Overall Cost‑Effectiveness. Realignment resulted in a net decrease—by tens of thousands of people—in the total state and county criminal justice population. Yet research suggests that it only contributed to a modest increase in property crime and had no effect on violent crime.
Helped Address Significant Problems Facing the State. For example, realignment helped the state to reduce severe prison overcrowding. Without it, the state would have had to pay for significantly more prison capacity and/or allow the federal courts to release tens of thousands of people from prison.
Increased Population Pressure on Jails, Particularly Initially. Jails responded to increased population pressure primarily by increasing the number of people who were released earlier than otherwise. However, Proposition 47 (2014)—which converted some lower‑level felonies to misdemeanors—largely relieved this pressure. In addition, jail construction projects have led to the addition of over 8,000 beds statewide and modernization of some existing capacity.
Led to Higher Risk and Need Populations at the County Level. The populations shifted to county jurisdiction appear to have relatively high risks of reoffending and/or higher service and treatment needs. Moreover, jails are likely exposed to higher cost pressures and other challenges associated with the new populations.
Was Affected by Subsequent Changes, Which Influenced How Its Impacts Evolved Over Time. For example, while realignment initially created population pressures on jails and led to early releases, Proposition 47 significantly mitigated the population pressures created by realignment. Accordingly, in considering realignment today, it is necessary to consider how subsequent changes to the criminal justice system have interacted with it.
Is Difficult to Fully Evaluate Due to the Limited Information on County Activities and Outcomes. There was an expectation that counties could achieve better outcomes than the state due to their greater flexibility to adapt programs and services. However, it is difficult to assess whether this has occurred due to limited data on county activities and outcomes as well as the inherent difficulty of knowing what outcomes would have been absent the 2011 realignment.
Introduction
Chapter 96 of 2023 (AB 1080, Ta) directs our office to submit a report evaluating the results of realigning certain adult felony populations from the state to counties in 2011. Specifically, the law directs our office to report various pieces of information, including the amount of funding received per county, information on sentencing practices, impacts on county jail populations, and recidivism outcomes. This report responds to the reporting requirement in Chapter 96. (For the full text of Chapter 96, please see Appendix 1.) In this report, we (1) provide an overview of the 2011 realignment, (2) discuss certain aspects of how it was implemented, (3) discuss how criminal justice populations changed immediately following realignment and over the subsequent several years, (4) review research on the impact of the 2011 realignment on crime and recidivism (the rate at which people reoffend), and (5) present key takeaways on this major policy change. In preparing this report, we analyzed available criminal justice system data and reviewed research on the 2011 realignment. This report was also informed by discussions with a sample of county and state criminal justice system leaders.
What Is “Realignment”?
Realignment Refers to Changes in Program Responsibility Between the State and Counties. California’s counties play a dual role in providing services to residents—acting as both a local government entity and as an agent of the state. As a local government entity, counties are responsible for providing municipal services (such as policing and waste management) to the unincorporated areas within the county. As agents of the state, counties are responsible for administering many of the state’s health, welfare, and criminal justice programs (such as probation). Several times over the last few decades, the state has sought to achieve policy improvements by reviewing state and county government programs and realigning responsibilities to a level of government more able to tailor programs to local needs. These realignments change the administrative, programmatic, and/or fiscal responsibility for these programs between the state and counties.
Realignments That Shift Responsibility to Counties Typically Provide Them Additional Revenues. In cases where the state shifts significant responsibilities to counties, rather than reimburse counties based on their actual costs, the state typically provides counties specific revenue sources—such as a portion of state sales tax revenue—to pay for their increased fiscal responsibilities under a realignment. In some years, revenues may exceed counties’ costs. In other years, the revenues provided may not be sufficient to cover counties’ costs. Over time, however, the revenue provided through realignment is intended to roughly cover counties’ costs for required realigned programs. For more on the fiscal mechanisms of realignments, see the box below.
Understanding the Fiscal Architecture of the Past Two Major Realignments
California Has Enacted Two Major Realignments. Over the past several decades, the state has implemented several realignments. The most significant realignments from the state to counties occurred in 1991 and 2011. These realignments affected multiple programs and resulted in significant revenue and cost shifts from the state to counties.
Both Realignments Were Designed to Help the State’s Budget Condition. Both 1991 and 2011 realignment were enacted in the midst of challenging state budget conditions and helped the state address its budget shortfalls. Both realignments primarily shifted program costs from the state to counties and provided counties with dedicated revenue streams to pay for these increased costs. (For some select programs, the realignments shifted costs from the counties to the state.) This resulted in savings that helped the state address its budget problems. The state took a somewhat different approach in how it funded the two realignments. Ultimately, though, both realignments relied on tax and fee increases to fund realignment costs, as explained below.
In 1991, the State Provided Counties With New Tax Revenues for Realignment Costs. To pay for counties’ increased costs for carrying out program responsibilities, the state dedicated two revenue sources to 1991 realignment: (1) a new half‑cent sales tax and (2) a portion of the vehicle license fee (VLF). The half‑cent sales tax was new revenue, approved by the voters for the purposes of realignment. The VLF was increased by changing the calculation of a car’s value for the purposes of the tax.
2011 Realignment Redirected Existing State Revenues to Counties to Help Fund Realignment… To help pay for counties’ increased costs for realigned programs as part of the 2011 realignment, the state reallocated a portion of the existing state sales tax to a special fund designated for county realignment purposes. This action reduced state General Fund revenues by about $5 billion in 2011‑12. By depositing the sales tax revenue into a special fund for use by local governments for realignment, the funds were not counted as state revenue for purposes of calculating the Proposition 98 minimum education funding guarantee. This action had the effect of reducing state General Fund obligations for K‑12 schools and community colleges by about $2 billion. Budget trailer bill language specified, however, that the exclusion of these revenues was contingent upon voter approval of a ballot measure providing additional funding for education. This funding backfill was approved in 2012 as part of Proposition 30, which, among other things, increased personal income taxes on high‑income taxpayers.
…As Well as Redirected VLF Revenues. As part of 2011 realignment, the 2011‑12 budget also redirected $453 million from the base 0.65 percent VLF rate to pay for counties’ increased costs associated with the realigned programs. Under prior law, these VLF revenues were allocated to the Department of Motor Vehicles (DMV) ($300 million) for administrative purposes and to cities and Orange County ($153 million) for general purposes. The budget increased the motor vehicle registration fee by $12 per automobile to offset the lost revenue to DMV.
What Was the 2011 Realignment of Adult Felony Populations?
In 2011, the state shifted some responsibilities and funding for several programmatic areas to counties. This shift included responsibility for incarcerating and supervising certain adult felony populations, child welfare programs, adult protective services, trial court security, and various public safety grant programs. This report focuses on the adult felony population component, which was the most significant policy change made by the 2011 realignment. In this section, we provide background on key challenges the state was facing at the time, specific felony populations that were realigned, revenues intended to pay for them, and additional changes that were made to assist counties in managing these new populations.
Major Restructure of Criminal Justice System That Responded to Key State Challenges
State Faced Fiscal Pressures Due to Great Recession. When California entered the Great Recession at the end of 2007, it faced a deteriorating revenue picture, structural shortfalls, and effectively no reserves. Between 2008‑09 and 2012‑13, California faced annual budget shortfalls in the tens of billions of dollars. The state took various actions, including the 2011 realignment, to close these shortfalls. As discussed in the box above, realignments are a tool the state has used to navigate fiscal challenges.
State Prisons Were Overcrowded… California’s prison population experienced a period of significant growth between the late 1970s and early 2000s. Specifically, the population increased from 21,100 in 1976 to a peak of 173,600 in 2006. Over this period, the state constructed 22 new prisons, as well as additional housing at some of its 12 pre‑existing prisons—more than doubling the design capacity of the prison system. (Design capacity generally refers to the number of beds the state prison system would operate if it housed only one person per cell and did not use temporary beds, such as housing people in gyms.) However, this expansion in systemwide design capacity was insufficient to accommodate population growth. Accordingly, the state converted areas of prisons not intended to be used for housing—such as gymnasiums—into dormitories and replaced some double bunk beds with triple bunk beds. In 2006, at the height of overcrowding, the state was operating its prisons at more than 200 percent of their design capacity.
…Which Led to Various Operational Challenges… Prison overcrowding created various challenges to prison management. For example, overcrowding put extra strain on physical infrastructure, complicated delivery of services inside prison (such as health care), and likely created a higher tension environment for people living and working in prison. Moreover, when areas not designed for housing—such as gymnasiums—were converted to dormitories, it prevented these spaces from being used as intended, such as to provide exercise and recreation to the prison population.
…And Litigation. In November 2006, plaintiffs in two ongoing class action lawsuits—currently referred to as Plata v. Newsom (involving medical care for incarcerated people) and Coleman v. Newsom (involving mental health care for incarcerated people)—filed motions for the courts to convene a three‑judge panel pursuant to the U.S. Prison Litigation Reform Act. The plaintiffs argued that persistent overcrowding in the state’s prison system was preventing the California Department of Corrections and Rehabilitation (CDCR) from delivering constitutionally adequate health care. In August 2009, the three‑judge panel declared that overcrowding in the state’s prison system was the primary reason that CDCR was unable to provide constitutionally adequate health care. Specifically, the court ruled that for CDCR to provide such care, overcrowding would have to be reduced to no more than 137.5 percent of design capacity within two years. If the state failed to comply, the court would release the number of people necessary to achieve compliance. On May 23, 2011, this ruling was upheld by the U.S. Supreme Court. Around that time, state prisons were operating at roughly 180 percent of design capacity—or about 34,000 people over the court‑ordered limit. The state made several changes that helped reduce prison overcrowding. This included temporarily paying for bed space in contractor‑operated prisons, constructing new state‑operated prison capacity, and reducing the prison population through changes to sentencing law, such as the 2011 realignment.
Criminal Justice System Had Misaligned Incentives… In addition to some of the challenges then facing the state, there were other long‑standing concerns about misaligned fiscal incentives in the criminal justice system. Because responsibility for California’s criminal justice system is divided among different state and local agencies, choices made by one level of government can affect the costs for a different level of government thereby creating counter‑productive fiscal incentives. For example, county prosecutors must make decisions about what type of criminal charges and punishments to pursue, such as whether to pursue a state prison sentence, county jail sentence, or county probation. However, incarcerating people in state prison largely creates costs for the state, whereas incarcerating them in county jail or placing them on county probation largely creates costs for the county. As we discuss further in the next section, before realignment, any felony conviction could lead to a prison sentence. Accordingly, county prosecutors had a broad fiscal incentive to pursue prison sentences over lesser punishments.
…And There Were Concerns That Its Structure Adversely Affected Outcomes. In addition, policymakers at the time were concerned that the state was limited in its ability to improve criminal justice system outcomes (such as reducing recidivism—the rate at which people reoffend after leaving the criminal justice system) because it is less able to adapt to local needs. Specifically, when it adopted the 2011 realignment, the Legislature expressed an expectation that counties could achieve better outcomes than the state due to their greater flexibility to adapt programs and services—such as mental health, which was already largely a county responsibility—to fit the local needs of the realigned felony populations.
Three Felony Populations Realigned From the State to Counties
In an effort to address the above problems, the 2011 realignment shifted three distinct felony populations from state to county responsibility: (1) certain people sentenced to state prison, (2) certain people under state parole supervision, and (3) people who violate the terms of their supervision after release from prison. These shifts were done on a prospective basis effective October 1, 2011, meaning that no people who were a state responsibility prior to that date were transferred to the counties. The shifted populations are discussed in detail below and summarized in Figure 1.
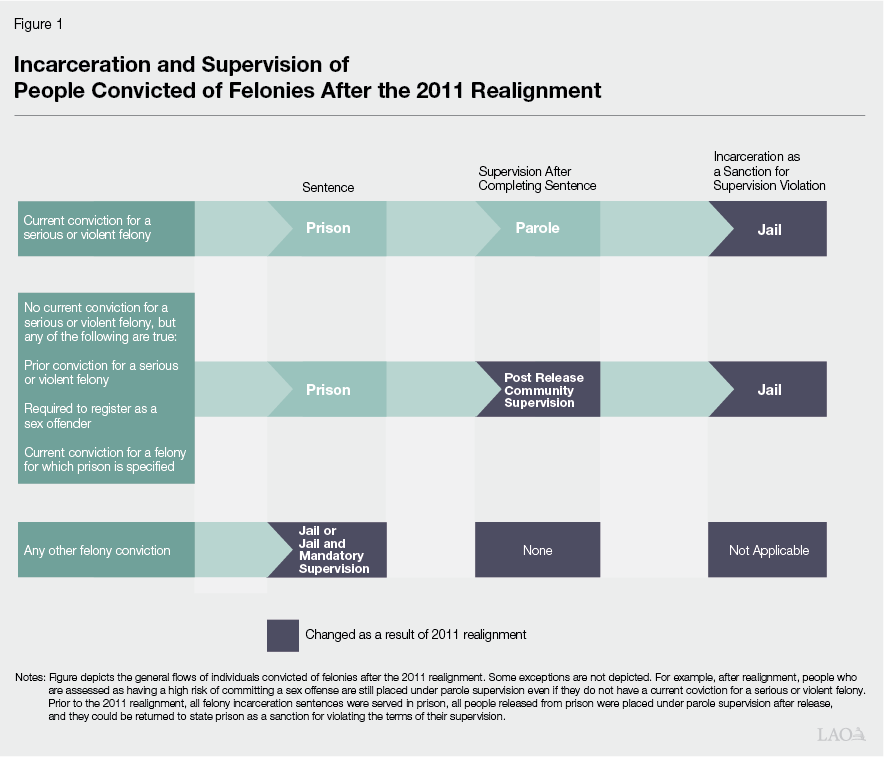
Certain People Sentenced to State Prison
Before Realignment, Any Felony Conviction Could Result in a Prison Sentence. Before the 2011 realignment, any adult convicted of a felony could be sentenced to state prison. However, depending on their criminal history and the discretion of a judge, people convicted of felonies could receive felony probation in lieu of a state prison term. People placed on felony probation are typically assigned to a county probation officer who supervises them in the community. They can also be required to spend time in county jail as a condition of their probation.
After Realignment, People Convicted of Nonserious, Nonviolent, Non‑Sex Offenses Generally Managed by Counties. The 2011 realignment limited who could be sent to state prison, thereby requiring that more people be managed by counties. Specifically, sentences to state prison are now limited to people who are required to register as sex offenders, people with current or prior convictions for felonies classified as “violent” and/or “serious” (such as murder, robbery, and burglary of an occupied residence), and people who commit certain other specified felonies (such as exhibiting a deadly weapon with the intent of resisting arrest). Thus, counties are now responsible for housing and supervising all people convicted of felonies who do not meet these criteria. These people can receive one of the following county‑level sentences:
- Straight Sentence. People who receive a county‑level sentence of incarceration for a felony conviction can be required to serve their entire sentence in county jail. In other words, for these people, realignment simply changed the location of their incarceration from state prison to county jail. This is often referred to as a “straight sentence.”
- Split Sentence. The realignment legislation created a new sentencing option—called “split sentences”—to give counties more flexibility in managing the new population. Specifically, it allowed judges to split a realigned felony sentence between jail and supervision in the community. In other words, rather than requiring the entire sentence to be served in jail, a judge can specify that a portion shall be served in the community under the supervision of a county probation officer. The period of time these people are being supervised in the community is called “mandatory supervision.” This time is considered part of their sentence (as opposed to a period of supervision following completion of a sentence). In practical terms, receiving a split sentence is similar to receiving jail as a condition of felony probation because both involve a period in jail followed by community supervision. However, there are some notable differences. For example, felony probation is limited to two years, while a split sentence can be longer for some crimes.
Unlike people who are sentenced to state prison—both before and after realignment—people who receive county‑level sentences are not supervised in the community following completion of their sentences. In addition, the 2011 realignment did not affect the rules around felony probation. Accordingly, people can still receive felony probation, including in lieu of serving a county‑level straight or split sentence.
Certain People Under State Parole Supervision
Before Realignment, All People Released From Prison Were Supervised by State Parole Agents. Before realignment, all people released from state prison were supervised in the community for a period of time by state parole agents. Parole agents ensure the people they supervise abide by the terms of their supervision, such as avoiding specific places or abstaining from alcohol. They apprehend and sanction those who violate the terms of their supervision or otherwise break the law. They also refer people to rehabilitation programs or other services.
After Realignment, People Whose Current Offense is Nonserious and Nonviolent are Supervised by Counties. After realignment, state parole agents only supervise people released from prison whose current offense is classified as serious or violent as well as certain others, such as people who are assessed as having a high risk of committing a sex offense. The remaining people—including those with prior convictions for serious or violent felonies—are released from prison to community supervision under county jurisdiction. County supervision of people released from state prison is referred to as Post Release Community Supervision (PRCS) and is conducted by county probation departments. Probation officers have similar duties to those of parole agents, such as enforcing terms of supervision, apprehending violators, and referring people to services.
People Who Violate the Terms of Their Supervision
Before Realignment, Parole Violators Could Be Returned to State Prison. Prior to realignment, people under state parole supervision who violated the terms of their supervision could be placed in state prison, typically for around four months. This contributed to a large volume of people coming through state prison for relatively short periods of time. (In 2007, about 70,000 people on parole were returned to state prison for technical parole violations—in other words, without having been convicted of a new crime. At any given time, about 20,000 people in prison were there for a parole violation.) The decision of whether to incarcerate people for violating the terms of their supervision—or to impose a different sanction, such a drug testing—is made at a revocation hearing. Before realignment, these hearings were conducted by the state Board of Parole Hearings, which paid for attorneys to represent people in these hearings.
After Realignment, Parole Violators Are Generally Placed in County Jail. Following realignment, people released from prison—whether to state parole or county PRCS—are generally placed in county jail, rather than state prison, for violations resulting in incarceration. In addition, state trial courts assumed responsibility for revocation hearings for people on state parole or county PRCS. Such hearings involve county prosecutors and county indigent defense attorneys. However, if a person commits a new prison‑eligible crime and is convicted, they can still be sent to state prison.
State Revenues Realigned to Counties
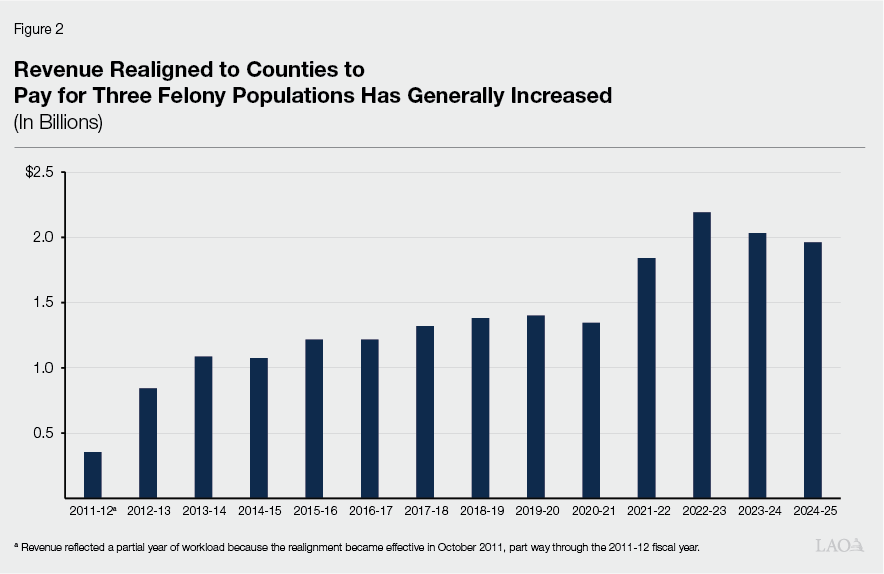
Portion of State Sales Tax Revenue Shifted to Counties to Pay for Three Felony Populations. As a part of the 2011 realignment legislation, the state shifted a portion of sales tax revenue to counties to pay for their increased costs associated with managing the three felony populations. As shown in Figure 2, that amount is currently around $2 billion annually—more than doubling since 2012‑13, the first full year of implementation. These revenues are equivalent to roughly one‑quarter of total county spending on adult corrections. In addition, they have typically represented less than 2 percent of overall county revenue, which has also generally grown over time. (The total amount of revenue that was shifted to local governments to pay for all of the responsibilities that were realigned in 2011—including the three felony populations—is currently around $11 billion annually and is composed of sales tax and vehicle license fee revenues.)
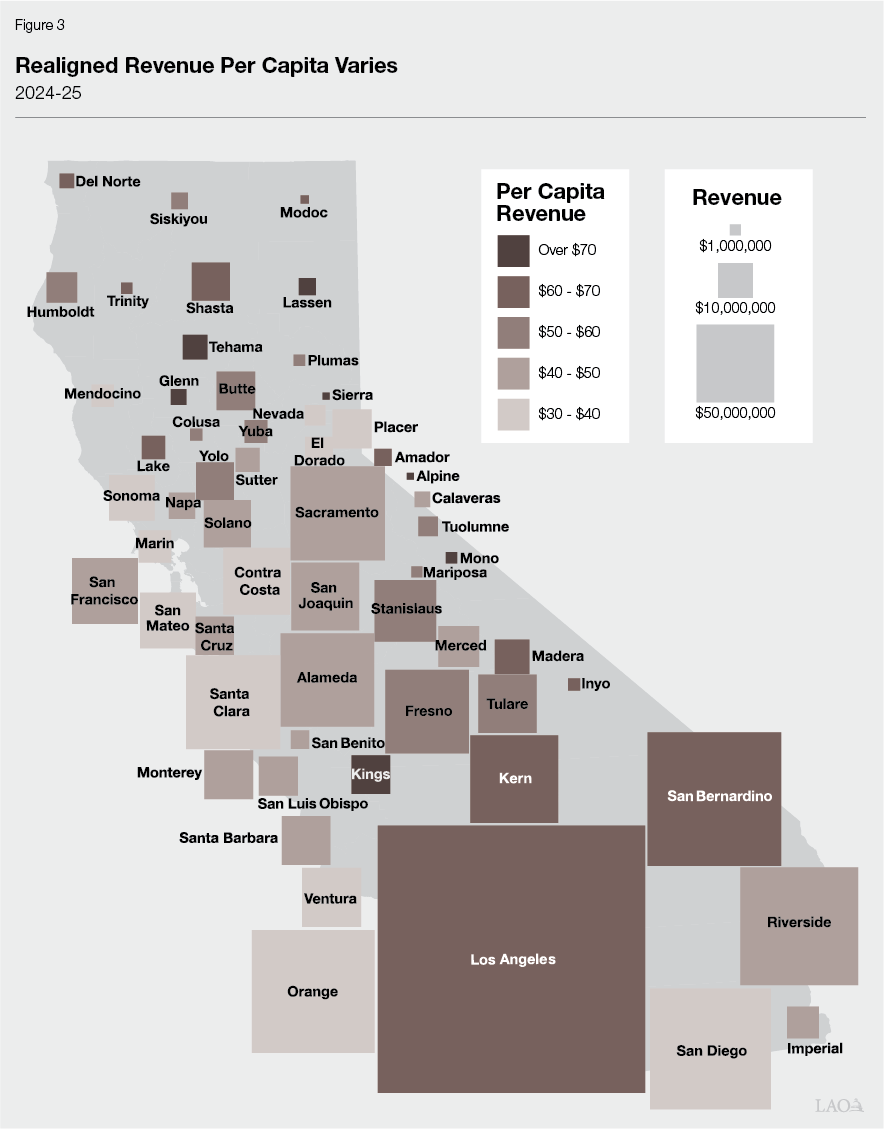
Revenue Allocated to Counties on a Formula Basis. The revenues are allocated to counties based on a formula developed by the Department of Finance in consultation with the California State Association of Counties (CSAC). The formula allocates funding based on (1) factors related to county size and conditions, such as overall adult population and crime rate, and (2) factors that reflect county performance, including sending fewer new commitments to prison from one year to the next. Figure 3 shows how funding was allocated in 2024‑25. (For more information about the allocation formula and amounts, see Appendix 2.)
Additional Changes to Assist Counties to Manage Realigned Populations
New Tools to Manage Realigned Populations. As discussed above, expanding counties’ share of responsibility for the criminal justice system while allowing them flexibility in how to manage the new workload was expected to improve outcomes. To facilitate that, the realignment legislation provided counties with some additional options for how to manage the new populations. This includes the previously mentioned split sentences, which allow a judge to sentence someone convicted of a felony to a combination of jail and community supervision. In addition, the legislation allowed county probation officers to place people who violate the terms of their community supervision in jail for up to ten days without a court hearing, which is commonly referred to as “flash incarceration.” The rationale for using flash incarceration is that short terms of incarceration, when applied soon after offenses are identified, have been found in other states to be more effective at deterring subsequent violations than the threat of longer terms following lengthy criminal proceedings.
Board of State and Community Corrections (BSCC). The realignment legislation also created a new state department, BSCC, to centralize state‑level oversight, grant‑making, and technical assistance for the local correctional system. In particular, responsibility for setting minimum standards for local detention facilities was shifted to BSCC from CDCR. BSCC was also given responsibility for administering some local criminal justice grants that previously resided with the California Emergency Management Agency, now known as the Office of Emergency Services. The BSCC board is currently made up of 15 members, including representatives of local governments and agencies as well as other aspects of the state and local criminal justice system.
Jail Construction Financing. Since 2007, the state has authorized about $2.5 billion in General Fund‑backed lease revenue bonds to fund the construction and modernization of county jails, with the majority of it being authorized after the 2011 realignment to help counties manage its impacts. (As discussed in the “Jail Population Management” section of this report, the jail population increased by about 8,500 [12 percent] one year after realignment.) Specifically, the state has provided:
- $1.2 billion authorized by Chapter 7 of 2007 (AB 900, Solorio) to increase housing capacity of county jails. Originally intended to incentivize counties to allow the state to site new prison facilities within them, most of these funds were repurposed shortly after the passage of the 2011 realignment to allow counties to use the funds to help manage their new responsibilities.
- $500 million authorized by Chapter 42 of 2012 (SB 1022, Committee on Budget and Fiscal Review) primarily to increase program and health care space in jails, though funds could also be used to add housing capacity.
- $500 million authorized by Chapter 37 of 2014 (SB 863, Committee on Budget and Fiscal Review) for the same purpose as Chapter 42.
- $270 million authorized by Chapter 34 of 2016 (SB 844, Committee on Budget and Fiscal Review) with $250 million for the same purpose as Chapters 42 and 37 and $20 million for Napa County to repair damages its jail sustained in a 2014 earthquake.
These funds have been awarded to counties through a competitive program administered by BSCC. As of September 8, 2025, projects associated with 36 awards were completed, yielding a net capacity gain of 8,266 beds. Projects associated with the remaining 17 awards were not yet completed and are expected to yield a net capacity increase of 151 beds. For more information, see Appendix 3.
Community Corrections Partnership Plans. Since 2009, each county in California has been required to maintain a Community Corrections Partnership (CCP), which is a group that consists of several key actors in each county’s criminal justice system. This includes the presiding judge, chief probation officer, sheriff, district attorney, public defender, and the heads of various county human services departments. The realignment legislation requires each county’s CCP to annually prepare and submit recommended plans for managing the realigned populations to their county’s board of supervisors. In addition, between 2011‑12 and 2023‑24, the state provided BSCC $8 million General Fund per year to distribute to counties that submitted their CCP’s plan to BSCC and completed an annual survey about realignment implementation, such as how counties allocated realignment revenues for the three felony populations. (This funding was eliminated in 2024‑25 and ongoing in response to the state’s budget shortfall. In light of the funding elimination, BSCC stopped collecting the CCP plans and surveys.)
Funding for Statewide Training to Support Implementation. The 2011‑12 Budget Act provided $1 million one‑time General Fund for CSAC, the California State Sheriffs’ Association, and the Chief Probation Officers of California to conduct statewide training efforts related to the implementation of realignment.
How Has Realignment Been Implemented?
In this section, we discuss how the 2011 realignment affected felony sentencing practices, PRCS caseloads and supervision practices, and jail population management. We also describe the limited available information about how counties use the realigned tax revenue. In many cases, we describe how these practices have changed since realignment was implemented. However, other significant criminal justice policy changes over this period have affected many of these same practices, making it difficult to isolate the effects of realignment alone. Notably, Proposition 47 (2014)—which converted some nonserious, nonviolent, non‑sex crimes from felonies to misdemeanors—and various changes that occurred during the COVID‑19 pandemic significantly reduced both arrests and criminal justice populations at both the state and county level. (For more information about these changes, please see the nearby box.) As a result, in some cases, we analyze data during the window of time immediately before and after realignment is implemented. This type of analysis provides a better understanding of the effects of realignment before these other policy changes took effect.
State Implemented Other Major Criminal Justice Policy Changes After Realignment
Proposition 47 (2014). Proposition 47, which was approved by the voters in November 2014, reduced certain nonserious and nonviolent drug possession and property crimes from wobblers or felonies to misdemeanors. (Wobblers are crimes that can be charged as either a felony or a misdemeanor.) For example, prior to Proposition 47, possession for personal use of most illegal drugs (such as cocaine or heroin) was a misdemeanor, a wobbler, or a felony—depending on the amount and type of drug. Proposition 47 specified that such crimes would always be misdemeanors. In addition, Proposition 47 specified that all thefts of property worth $950 or less are misdemeanors. Previously, some of these crimes could be punished as felonies depending on the type of property taken or if the defendant had certain previous theft‑related convictions. The measure limited these reduced penalties to people who have not committed certain severe crimes, such as murder, and are not required to register as sex offenders. Proposition 36, which was approved by the voters in 2024, reversed some of the punishment reductions that were made by Proposition 47. For example, under Proposition 36, thefts of property worth $950 or less can now be punished as felonies if the defendant has two or more past convictions for certain theft crimes (such as shoplifting, burglary, or carjacking).
Pandemic‑Era Changes. Many changes in California’s criminal justice system occurred during the COVID‑19 pandemic. Some were directly tied to public health responses, while others just happened to coincide with the timing of the pandemic. We describe some of the notable changes below.
- Temporary Public Health Responses. Numerous actions to prevent the spread of COVID‑19 in the community, courtrooms, correctional facilities, and other workplaces affected the criminal justice system in various ways. For example, local law enforcement agencies implemented various temporary policies—such as delaying planned arrests unless doing so would jeopardize public safety—to reduce interactions with community members in order to mitigate the spread of the virus. In addition, in April 2020, Judicial Council (the policymaking and governing body of the judicial branch) adopted a statewide emergency bail schedule that set bail for arrestees at $0 for most misdemeanors and low‑level felonies. Local bail schedules applied otherwise. However, judges retained the ability to deviate from the bail schedules. This change substantially increased the number of people who were immediately released from jail after being arrested.
- Other Changes That Coincided With the Pandemic Era. There were various policy changes that occurred around the same time as the pandemic, but were not direct responses to the public health emergency. For example, the 2021‑22 budget package provided the judicial branch with $140 million—a portion of which was ongoing—to support programs and activities aimed at reducing pretrial detention of people in jail, including funding for pretrial monitoring services. This made a two‑year pilot program initially funded as part of the 2019‑20 budget package permanent and expanded it statewide. Such changes may have reduced the number of people detained in jail pretrial. In addition, Chapter 328 of 2020 (AB 1950, Kamlager) reduced maximum probation terms to one year for misdemeanors and two years for felonies. Previously, misdemeanor probation terms could last up to three years and felony probation terms could last up to the greater of five years or the maximum sentence for the crime the person was on probation for.
Felony Sentencing Practices
In this section, we present data reported by courts to the California Department of Justice (DOJ) on the numbers of adult felony arrests that resulted in a conviction and sentence to prison, jail, or probation. First, we show the outcomes of adult felony arrests for the full period from pre‑realignment to the present, in which Proposition 47 and the pandemic‑era changes are notable factors that contribute to the overall trends. Next, we narrow the focus on the three years before and the three years after the 2011 realignment—a period where realignment is likely one of the primary factors affecting these outcomes—and explore how sentencing outcomes changed for property, drug, violent, and other crimes. Finally, we present data on the use of split versus straight jail sentences ranging from 2013 (when Judicial Council began collecting it) to the present.
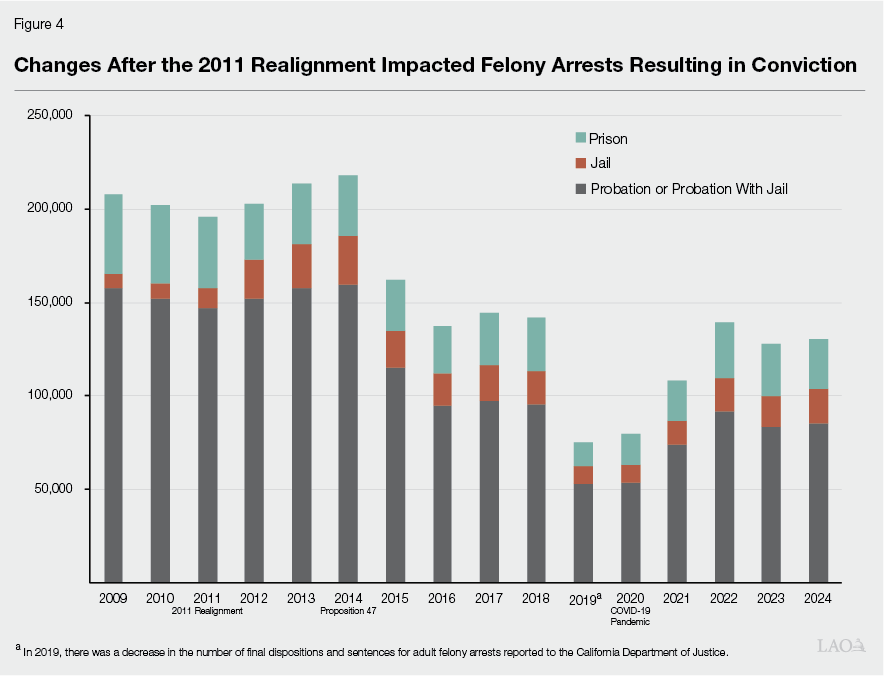
Total Felony Arrests Resulting in Convictions Have Generally Declined. Figure 4 shows total felony arrests that resulted in a conviction and sentence to prison, jail, or probation. People arrested for felonies are sometimes ultimately convicted of misdemeanors. Accordingly, sentences to jail prior to the 2011 realignment are likely misdemeanor convictions. As shown in Figure 4, there was a modest increase in total felony arrests resulting in conviction following realignment. It is not clear why this increase occurred and may not have been tied to realignment. More notably, there was a clear drop after 2014, which is very likely associated with Proposition 47 converting some lower‑level felony crimes to misdemeanors. We then see another drop in 2019, which DOJ reports is associated with a one‑year drop in reporting. However, the decline remains in 2020 and 2021—likely driven by pandemic‑era changes—before returning to pre‑pandemic levels in 2022. We also see in Figure 4 that sentences to jail more than doubled between 2010 and 2012, while sentences to prison decreased. This was likely primarily caused by realignment, which we explore in more detail in the next figures.
With Realignment, Sentences to Prison Decreased and Sentences to Jail Increased, Driven Primarily by Property and Drug Felonies. As shown in Figure 5 , the number of adult felony arrests that resulted in a conviction and sentence to prison decreased notably after 2011 for both property and drug crimes. In contrast, sentences to jail for property and drug crimes increased notably. This shows a distinct shift of sentences for property and drug crimes from prison to jail, as expected given the changes made by the 2011 realignment. In addition, we see that sentences for violent crimes were largely unaffected. Sentences to prison for crimes classified as “other” were largely unaffected, while sentences to jail for other crimes increased somewhat. This slightly inconsistent result may be due to unknown factors impacting one or more of the wide variety of crimes classified as other—including various sex offenses, gambling, extortion, driving under the influence, perjury, and manslaughter.
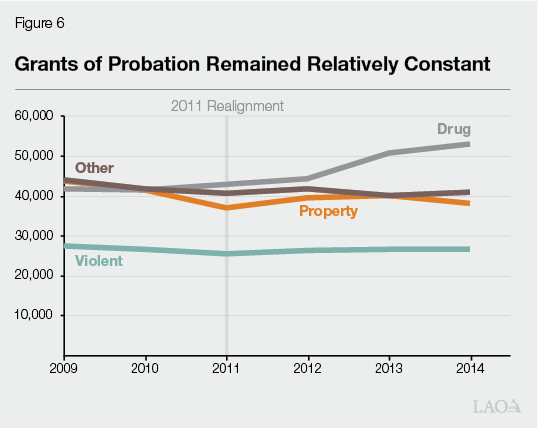
With Realignment, Grants of Probation Remained Relatively Constant. In Figure 6, we see that realignment did not appear to have a major effect on the number of felony arrests that resulted in probation. (It is unclear whether courts reported split sentences—which are legally distinct but similar in practical terms to probation with some jail time—as part of this data, but as discussed below, split sentences represent a relatively small portion of overall sentences.) The decision to grant probation in lieu of requiring a defendant to serve a prison or jail sentence is primarily based on their underlying criminal risk factors and other individual circumstances, not whether the incarceration sentence would be served in state prison or county jail. Accordingly, it makes sense that shifting the location of incarceration for certain felony sentences from prison to jail under realignment would not have a major impact on grants of probation.
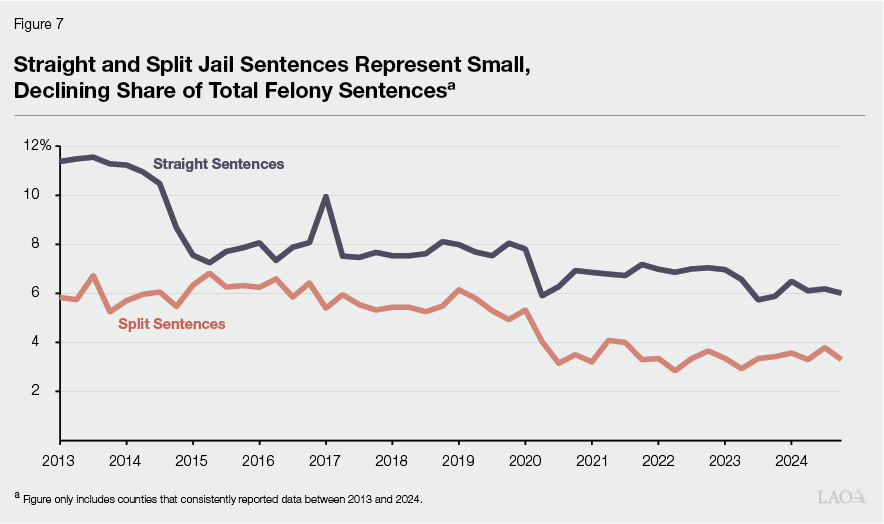
Straight and Split Jail Sentences Represent Small, Declining Share of Total Felony Sentences. As discussed earlier, the only way a person convicted of a felony could remain in county jail prior to the 2011 realignment was if they were placed there as condition of felony probation. Accordingly, straight and split jail sentences did not exist prior to realignment. However, we can look at how they have been used since Judicial Council began collecting data on them in 2013. As Figure 7 shows, straight and split jail sentences generally declined as a share of total felony sentences for counties that consistently reported data between 2013 and 2024. In total, these sentences declined from 17 percent to 9 percent over this period. Declines can be seen in late 2014 and mid‑2020, suggesting that Proposition 47 and the pandemic era reduced not only the total number of felony sentences, but also the share of felony sentences that fall under county responsibility. In the case of Proposition 47, this reduction was likely tied to the fact that the measure converted many lower‑level felonies—which are often served at the county‑level—to misdemeanors. The pandemic‑era reduction could have various possible causes, including reduced enforcement of lower‑level felonies. Beginning January 1, 2015, Chapter 26 of 2014 (AB 1468, Committee on Budget) established a statutory presumption in favor of split sentences, over straight sentences, unless the court finds that a split sentence is not appropriate in a particular case. As shown in Figure 7, there was not a notable increase in split sentences after this law went into effect. It is possible that judges were already favoring split sentences in situations they felt were appropriate.
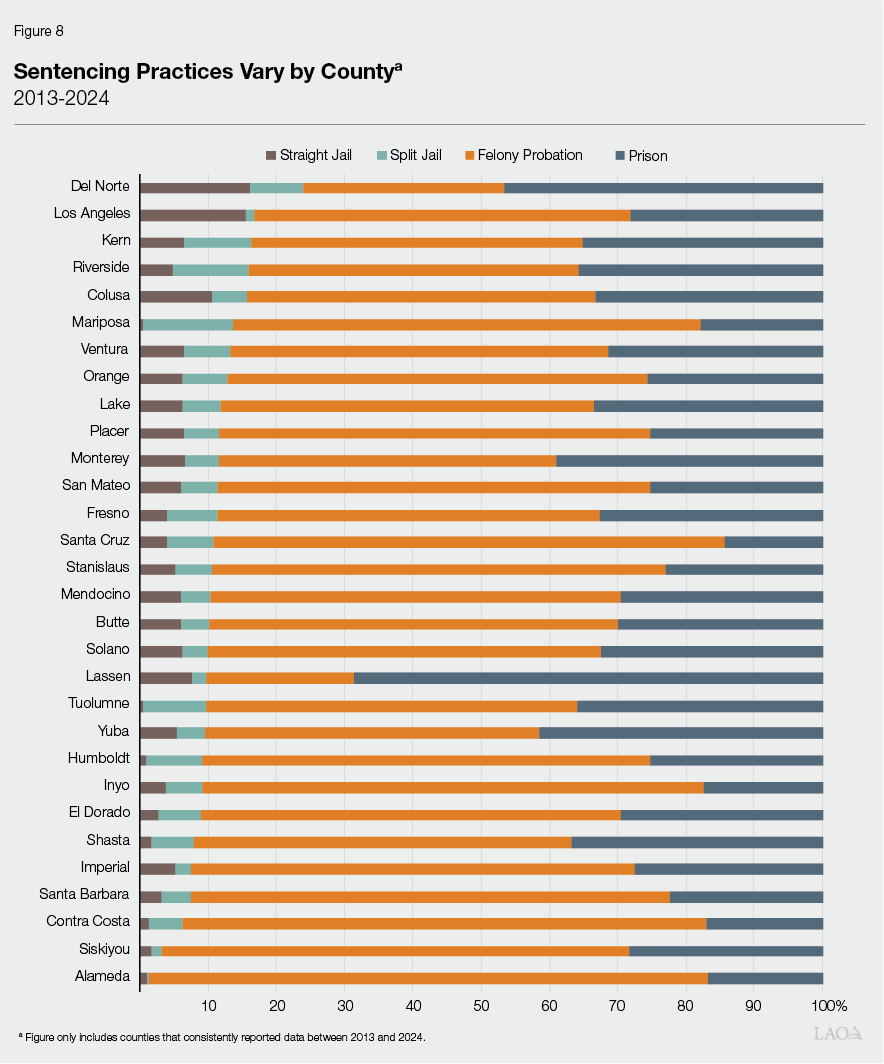
Prevalence of Straight and Split Jail Sentences Varies by County. Figure 8 shows the percentage breakdown of felony sentences by type for counties that consistently reported data over the period 2013 to 2024. As the figure shows, the prevalence of straight and split jail sentences varies by county. For example, combined straight and split jail sentences range from 1 percent of total sentences in Alameda County to 24 percent in Del Norte County. There could be various reasons for differences in the prevalence of these sentences by county. For example, differences could be associated with varying attitudes toward punishment (as split sentences may be seen as less severe than straight sentences), jail capacity (as split sentences require less capacity), or fiscal pressures (as split sentences are typically less costly).
PRCS Caseloads and Practices
As discussed above, under the 2011 realignment, people released from prison after serving terms for nonserious, nonviolent felonies are generally supervised on PRCS by county probation departments. Below, as required by Chapter 96, we provide information on PRCS caseloads and practices. Specifically, we discuss how the PRCS population is different from the population released to state parole supervision under realignment. We also provide details on the tools available to probation departments to encourage people on PRCS to comply with the terms of supervision.
PRCS Caseloads Tend to Be Higher Risk. CDCR staff generally determine criminal risk factors by using the California Static Risk Assessment (CSRA), which uses a person’s age, gender, and past criminal history to identify their risk of reoffending. Based on the risk score, CSRA classifies people into three categories—high, moderate, and low risk. When comparing people released to PRCS to those released to parole, more people released to PRCS had high CSRA risk scores (54 percent) than parole releases (31 percent), indicating a greater likelihood of reoffending. People released to PRCS also exhibited higher reconviction rates (45 percent reconvicted within three years) compared to those placed under parole supervision (33 percent reconvicted within three years). Accordingly, while they may have less serious commitment offenses than people released to parole, people released to PRCS tend to be higher risk. This could be due to people on PRCS having more property or drug crimes than those on parole. According to CDCR, convictions for these crimes have been associated with a greater likelihood of committing subsequent crimes.
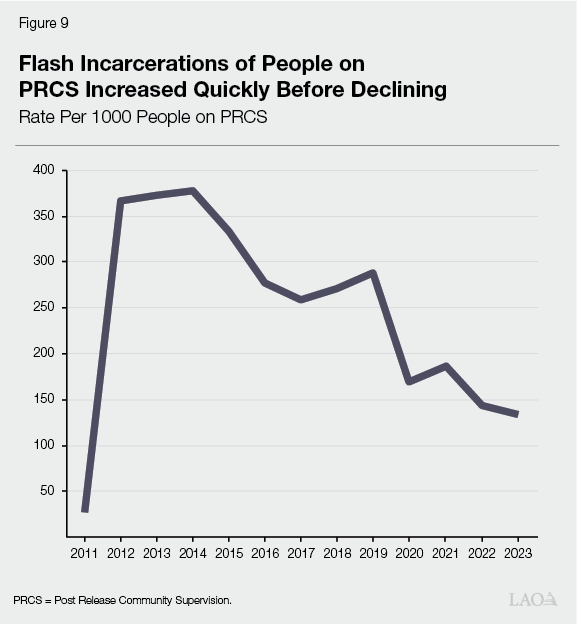
Probation Can Impose Intermediate Sanctions for Violations. When a person under community supervision violates the terms of their supervision, the assigned probation officer imposes a formal or informal sanction, depending on the seriousness of the behavior. Informal sanctions—also called intermediate sanctions—tend to be reserved for minor (and sometimes moderate) violations that do not require court involvement. Intermediate sanctions can include verbal warnings, behavior contracts, referrals to programs, increased check‑ins with probation officers, and various other activities to discourage the negative behavior. As discussed above, probation departments can also use flash incarcerations, which are short periods of detention—typically one to ten days—in a county jail for violating the terms of supervision. Figure 9 shows the statewide rate of flash incarcerations for people on PRCS ramped up in the initial years of realignment but has generally declined since then. Notable drops in the rate of flash incarcerations can be seen after 2014 and 2019. While these decreases could be related to Proposition 47 in 2014 and the COVID‑19 pandemic in 2020, it is unclear whether that is the case or what other factors may have led to those changes.
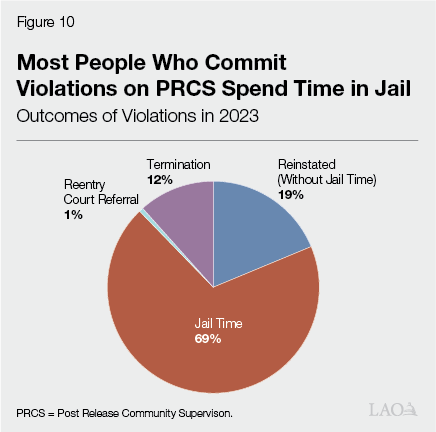
Jail Time Is a Common Outcome of Formal Sanctions. Formal sanctions tend to be reserved for serious or moderate violations, typically result in a change to the terms of supervision, and can involve courts. Petitions filed in a court—usually from probation departments—generally allege that the person on community supervision has had serious or frequent noncompliant behavior with the terms of the supervision. In 2023, petitions were filed for 650 out of every 1,000 people on PRCS. When a petition is filed, the court then determines whether a violation did happen and what the sanction should be (if any). Courts have various sanctions as options, including (1) reinstating supervision without jail time, (2) ordering jail time—with the person being reinstated to supervision after release, (3) referring the person to reentry court services—where they receive additional rehabilitation services, and (4) terminating supervision—which typically involves imposing jail time. Judicial Council tracks the usage of these violation sanctions. As shown in Figure 10, most people found to be in violation of their PRCS received jail time. As such, unsuccessful completions of supervision can have a significant impact on county jail populations. For example, in 2017, the Public Policy Institute of California (PPIC) found that roughly one in four people in jail were under some form of community supervision for a prior conviction at the time of arrest. In addition, they found that the average number of days people spent in jail while on PRCS (117.2 days) or mandatory supervision (150.3 days) was considerably larger than the average days spent in jail while on traditional felony (84.9 days) or misdemeanor (45 days) probation.
Probation Departments Report Increases in Rehabilitative Services Offered. To help people successfully complete the terms of their supervision, probation departments offer various rehabilitative services intended to address certain needs that—if left unmet—can increase the likelihood of further crime. In 2024, Judicial Council reported that every probation department in the state uses an assessment tool to identify the various rehabilitative needs of the supervised population. Judicial Council data also indicate that there has been a general increase in the number of counties offering rehabilitative services. It reports—based on five annual survey questions—that the portion of probation departments offering programming, treatment, and services consistent with best practices increased from 34 percent in 2011 to 66 percent in 2024. Common program offerings include cognitive behavioral therapy (which aims to change negative patterns of behavior), mental health treatment, sex offender treatment, education, employment readiness, or substance use disorder treatment. Part of this increase in services could be driven by the Community Corrections Incentive Program (also known as the SB 678 County Probation Grant Program) established in 2009. This program provides grants to support rehabilitation programs in counties that reduce the rate at which people on community supervision are sent to prison (such as for committing new offenses). (For more on this program, please see our report The 2025‑26 Budget: SB 678 County Probation Grant Program.) Probation departments have also reported that the nature of their work has changed to include more social work type tasks, which could be related to the increase in services available.
Jail Population Management
As discussed in previous sections, realignment shifted certain felony sentences and parole supervision violators from state prison to county jail. These new populations put pressure on jails. In this section, we review trends in population pressures faced by jails as well as how jails managed that pressure.
Jails Have Various Mechanisms to Relieve Population Pressure. Jails house adults who (1) have been arrested for a crime and are awaiting trial or court decisions, (2) are serving time for committing a crime, or (3) have been placed in jail as a sanction for violating the terms of their supervision in the community. As discussed above, there are mechanisms at the sentencing stage that can mitigate population pressure on jails—such as felony probation and split sentences. Jails also have various mechanisms to release people from custody after they have been sentenced. For example, state law allows jail administrators to apply to the presiding judge in their county to receive general authorization to manage overpopulation by accelerating the release of people serving sentences in jail. In addition, state law allows counties to establish programs in which people who are either awaiting trial or serving sentences in jail can be supervised in the community under electronic monitoring. In some counties, court orders arising from litigation require jail administrators to release people under particular conditions, such as when a certain population level is reached. A 2014 study by researchers at Stanford University found that 39 facilities—33 percent of the total 119 county jail facilities at the time—were operating under a court‑ordered population cap. Because these orders tend to impact larger counties, two‑thirds of the jail population was located in a county with one of these population caps. The researchers noted that most of these court‑orders had been in place for decades, well pre‑dating the 2011 realignment.
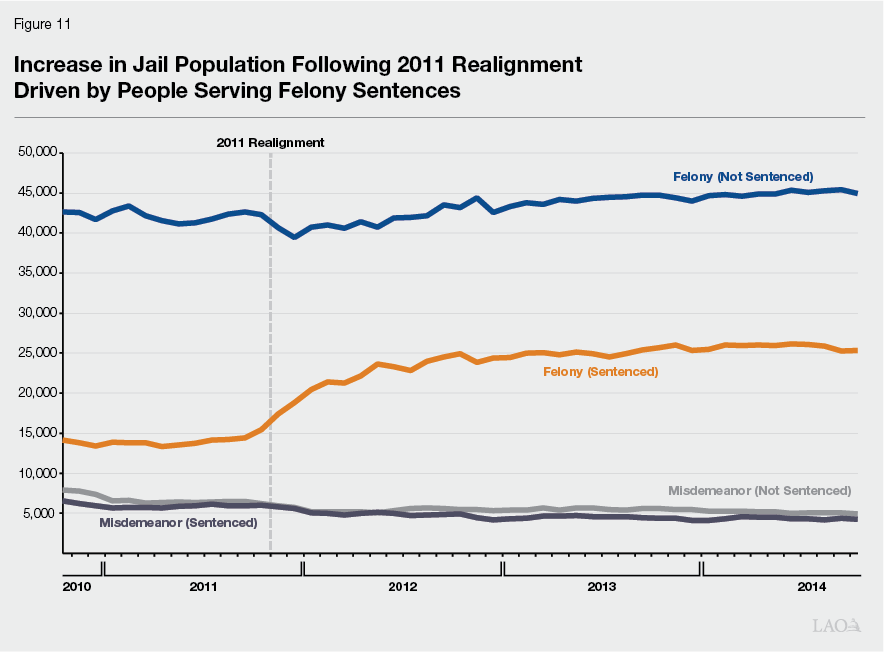
Realignment Impact on Jails Driven by Increase in People Serving Felony Sentences. Figure 11 shows changes in the jail population from October 2010 (one year before realignment went into effect) through October 2014 (the month before Proposition 47 was passed), including people who have been arrested (but not sentenced) and people who have been sentenced. Within one year of realignment taking effect, the jail population increased by about 8,500 people (12 percent). This increase was primarily driven by an increase in the number of people who had been sentenced for felonies. This includes the two populations that were shifted from state prison to county jails by realignment: (1) people serving felony terms in county jail and (2) people placed in jail for violating the terms of their parole or PRCS supervision.
Increase in the Jail Population Was Smaller Than the Decrease in the Prison Population. In a 2013 study, PPIC found that realignment increased the jail population by roughly one person for every three‑person decrease in the prison population. In other words, realignment did not result in a one‑to‑one population shift from prison to jail. This is because some people who would have served an entire sentence in state prison prior to realignment now serve a portion of their sentence under supervision in the community as a result of having received a split sentence. In addition, as discussed further below, the number of population‑related early releases from jails increased after realignment which dampened the increase in the jail population.
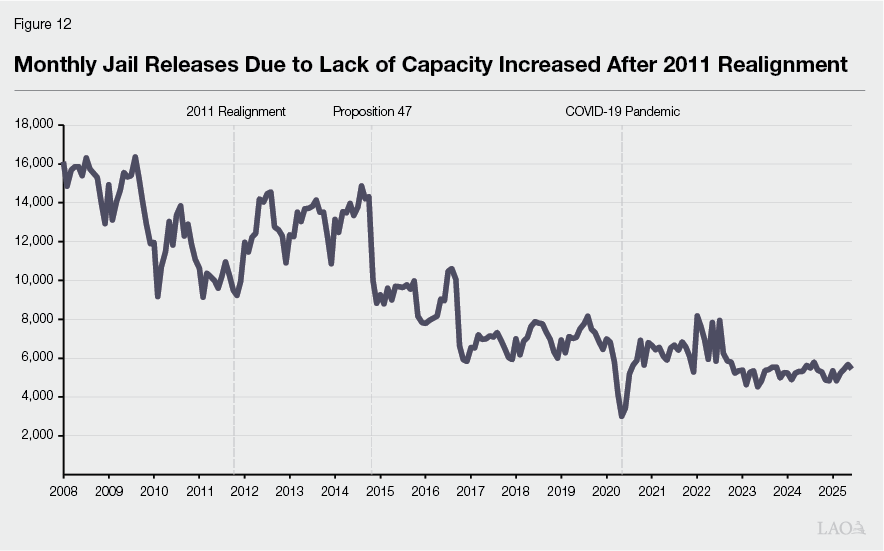
In the First Few Years, Early Releases Were Used to Manage Population Pressure on Jails. As shown in Figure 12, early releases from jails due to lack of housing capacity increased following the 2011 realignment, though they remained at or below levels seen in prior years. In a 2013 study, PPIC reported that between June 2011 and June 2012 the number of counties operating jail systems above their rated capacity increased from 11 to 16 and the number of counties reporting early releases from jail due to capacity constraints increased from 27 to 35. In addition, PPIC found evidence that the new population coming to jails as a result of realignment was displacing people with lower‑level charges or convictions, particularly in counties subject to court‑ordered population caps. At the time of the study, 18 counties had one or more jail facilities that were subject to a court‑ordered population cap. PPIC estimated that in counties with court‑ordered caps, one sentenced person per month was being released early for every four‑person increase in the jail population caused by realignment—compared to 1 for every 16 in counties without court‑ordered caps. In addition, they estimated that one unsentenced person was released per month for every six‑person increase in the jail population caused by realignment in counties with caps. However, they found no impact of realignment on releases of unsentenced people in counties without caps. The data did not allow the researchers to identify how early people were being released—only that they were being released early.
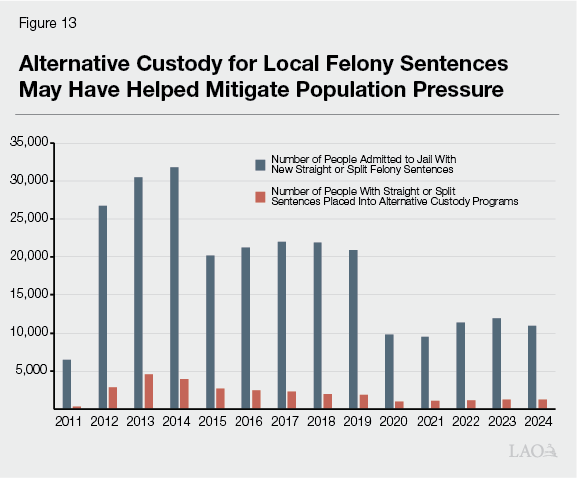
Modest Portion of New Felony Population Is Placed in Non‑Jail Setting. The realignment legislation specified that counties can place people sentenced to jail for felonies into alternative custody settings—such as at home under electronic monitoring—in lieu of confinement in a jail facility. (Similar programs already existed for various other populations in jail prior to realignment.) Figure 13 shows (1) the number of new—straight or split—felony sentences to jail and (2) the number of people with such sentences who were placed into alternative custody in lieu of confinement in county jail. Between 2012 and 2024, the number of people placed into alternative custody represented between 9 percent and 15 percent of the total number of felony jail sentences. This practice may have helped ease population pressure on jails. However, it is unclear whether the decision to place these people into alternative custody was motivated by jail capacity limitations or other factors (such as helping people to maintain employment and/or family connections.)
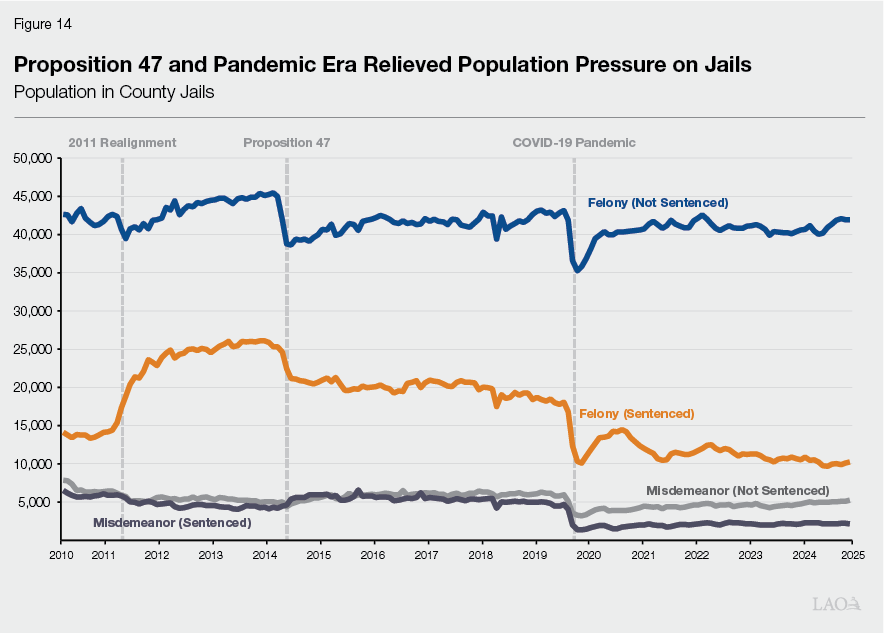
In the Longer Term, Proposition 47 and Pandemic‑Era Changes Significantly Reduced the Jail Population. As shown in Figure 14, Proposition 47 and various changes during the pandemic era led to notable decreases in the jail population. This has relieved population pressure on jails. In 2024, jails released about 5,300 people per month early compared to about 13,400 per month in the year before Proposition 47 was enacted (Figure 12). In addition, as discussed previously, over 8,000 new beds have been added statewide to the jail system as a result of the lease revenue bond authority authorized for counties to add and modernize jail capacity. Together, these changes reduced the need to release people early due to the lack of capacity.
Jails Likely Faced Various Other Challenges Beyond Population Pressure. In addition to increasing the overall size of the jail population, the 2011 realignment changed the composition of the jail population. As previously discussed, it increased the share of people with felony sentences in jail. This shift could have had a number of impacts. For example, the 2011 realignment expanded the circumstances under which people could face long‑term jail stays by allowing certain felony sentences to be served in jail. When people stay in jail longer, it may obligate jails to provide more or different types of health care or other services than would be necessary for a short‑term population. This, in turn, could have exposed jail systems to increased costs and/or litigation if they struggled to provide this care. In addition, anecdotally, some jail administrators reported an increased level of criminal sophistication and gang involvement among the new populations received as a result of realignment. Data limitations do not allow us to assess the magnitude of these trends. Moreover, we cannot determine whether some of these trends would have materialized regardless of the 2011 realignment.
County Use of Realigned Tax Revenues
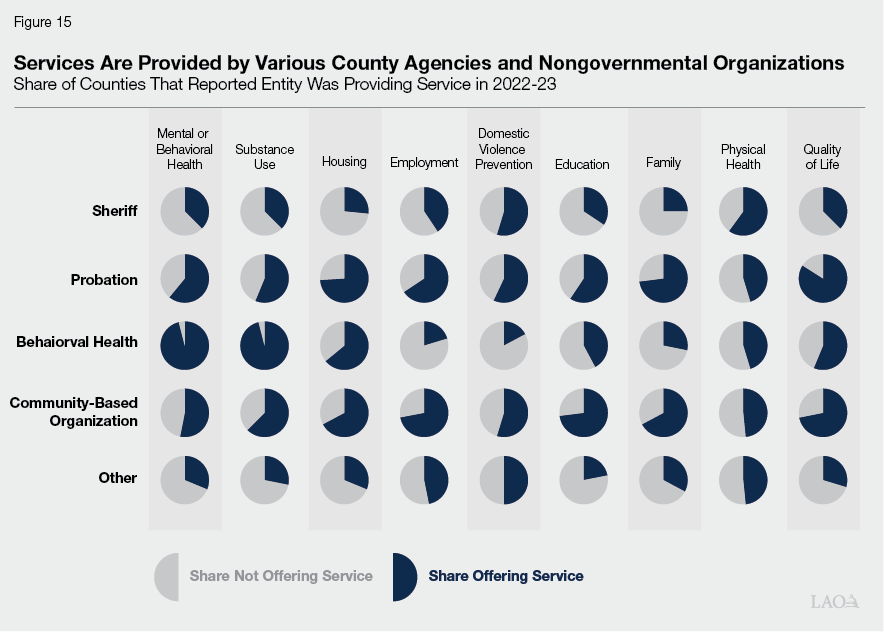
Services Are Provided by Various County Agencies and Nongovernmental Organizations. As mentioned previously, between 2011‑12 and 2023‑24, BSCC surveyed county CCPs about various aspects of realignment implementation, including how they allocated the tax revenues and the types of services they offered. According to the results of the most recent survey administered in November 2023, virtually all counties reported providing mental health (98 percent), substance use (98 percent), housing (98 percent), employment (100 percent), education (91 percent), family (95 percent), domestic violence prevention (95 percent), health (91 percent), and quality of life (97 percent) services. (Quality of life services include assistance with obtaining a driver’s license or opening a bank account.) The survey also asked CCPs to report on what entity in their county provides each type of service. The results are displayed in Figure 15. For example, not surprisingly, 96 percent of counties reported that their behavioral health department provides mental/behavioral health and substance use treatment—though many counties also reported that other agencies and nongovernmental organizations also provide such services.
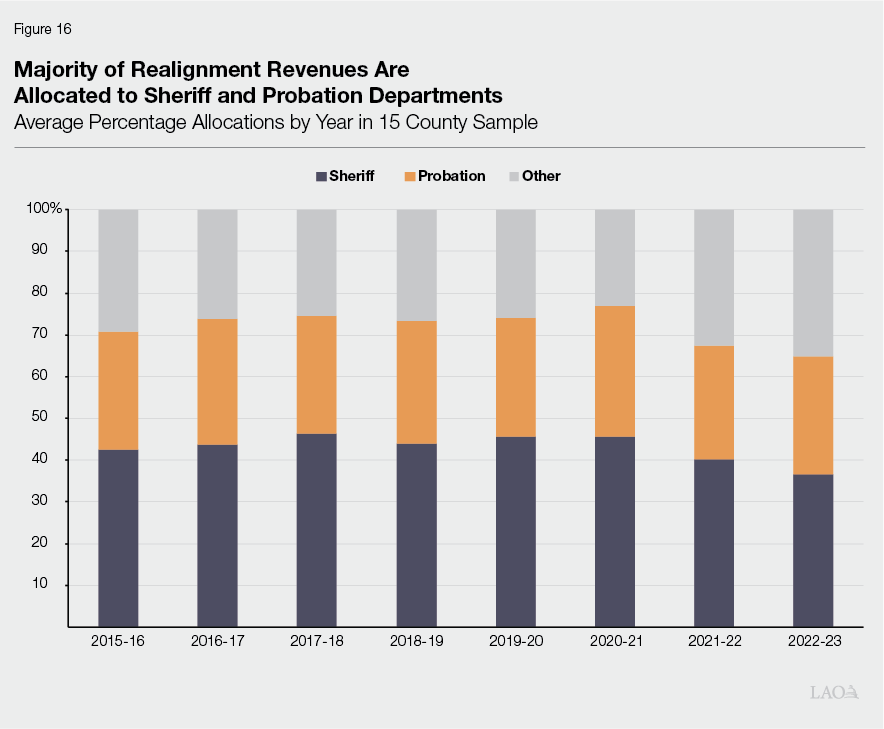
CCPs Report Allocating About Two‑Thirds of Realignment Revenue to Sheriff and Probation Departments. We compiled information supplied to BSCC via these annual surveys for a sample of 15 counties to determine how they allocated their realignment revenue between their sheriffs’ departments, probation departments, and other entities. The “other” category includes county agencies (such as behavioral health departments), other local government entities (such as city police departments), and nongovernmental organizations (including community‑based organizations and private entities, such as companies that are contracted to provide health care services inside jails), and deposits into reserve funds. As shown in Figure 16, on average, the counties typically allocate about two‑thirds of their realignment revenues to the sheriff and probation departments. In 2021‑22 and 2022‑23, the share of funds allocated to other was higher than in previous years. These two years coincided with substantial increases in revenue, suggesting that counties may have allocated excess revenues to reserves or different uses that would be captured in the other category.
CCP Survey Design Limits Usefulness of Data. It is important to note that limitations inherent to the CCP survey design make it very difficult to draw conclusions from this information. First, the survey only asked CCPs to report information on how they spend realigned revenues, which is just one source of funding for operation of county criminal justice systems. In other words, the figure may not present the full amount of resources counties have used to accommodate the realigned workload. Furthermore, the receipt of realignment revenues may have allowed counties to use funding that would have otherwise been spent on sheriffs and/or probation for different purposes. Additionally, the survey did not require CCPs to use standardized, defined categories in reporting how revenues were allocated. This made it very difficult to synthesize information across counties in a consistent way and ultimately prevents aggregation in any more granular categories than those used in Figure 16. Even with the extremely high‑level categories used in Figure 16, it is likely that some money reported as going to sheriffs or probation departments, for example, actually got passed through to other entities, such as community‑based organizations providing rehabilitative services. Conversely, it is likely that some of the money reported in the other category is actually tied to sheriff or probation operations, such as a contract with a behavioral health department to provide services inside the jail.
How Have Criminal Justice Populations Changed Over Time?
Previously in this report, we discussed various factors that influenced how realignment was implemented. These factors include state‑level choices, such as the authorization of lease revenue bond authority for counties to expand and modernize jail capacity. This also includes county‑level choices, such as decisions by jail administrators on how to respond to jail population pressure. In addition, choices by individual actors—such as prosecutors, judges, or probation officers—impact whether and how long people are incarcerated and/or supervised in the community. Collectively, these factors help determine the overall size of criminal justice system populations. In this section, we discuss how state and local criminal justice populations have changed since 2010, the year before the 2011 realignment was enacted. Again, it is important to note that these trends are affected not only by implementation of realignment but also the many changes to the criminal justice system that have occurred since 2011.
State Prison and Parole Populations Declined Following the 2011 Realignment… As shown in Figure 17, the prison population declined quickly after realignment—by about 27,000 people (17 percent) between 2011 and 2012. The parole population also declined substantially, albeit more gradually, following realignment—by about 46,300 people (51 percent) between 2011 and 2014.
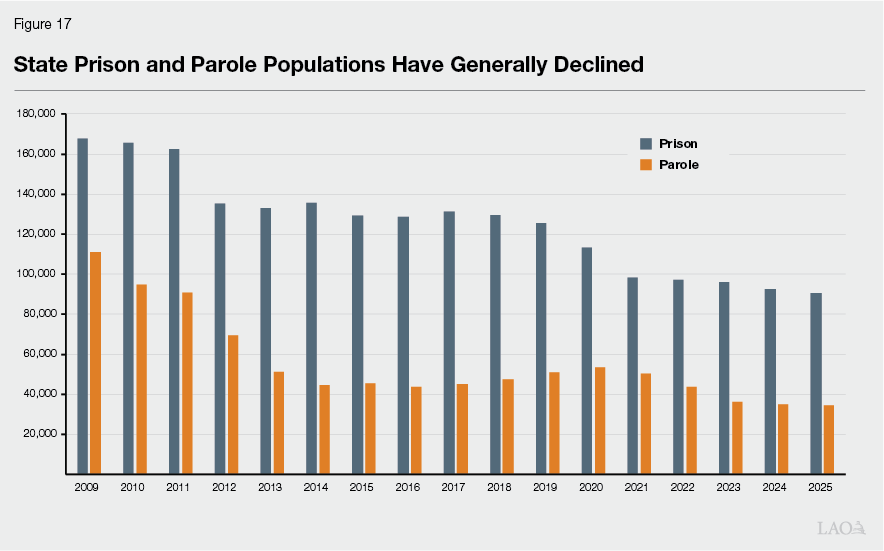
…And Declined Further Due to Subsequent Changes. Because Proposition 47 converted various felonies to misdemeanors it reduced the state prison population somewhat in addition to reducing the jail population as described above and in greater detail below. Pandemic era changes also impacted the prison population in ways that were again similar to the jail population. For example, to mitigate the spread of COVID‑19, state prisons temporarily halted admissions, driving a decline in the population. However, changes that both predated and coincided with the pandemic have kept the prison and parole populations declining. Notably, in 2016, voters approved Proposition 57, which, among other provisions, expanded CDCR’s authority to reduce people’s prison terms through credits. Beginning in 2017, CDCR took several steps to increase credits. For example, in May 2021, CDCR modified its regulations to allow people with convictions for violent crimes to earn up to 33.3 percent off their sentence (an increase from 20 percent) for maintaining good behavior. By reducing the amount of time that most people spend in prison, Proposition 57 is driving a long‑term downward trend in the prison population. In addition, Chapter 29 of 2020 (SB 118, Committee on Budget and Fiscal Review) reduced the parole population as it established an opportunity for people to earn early discharge from parole for good behavior after one year and maximum parole terms of two or three years for most people on parole. (Previously, parole terms were generally set at three or more years.)
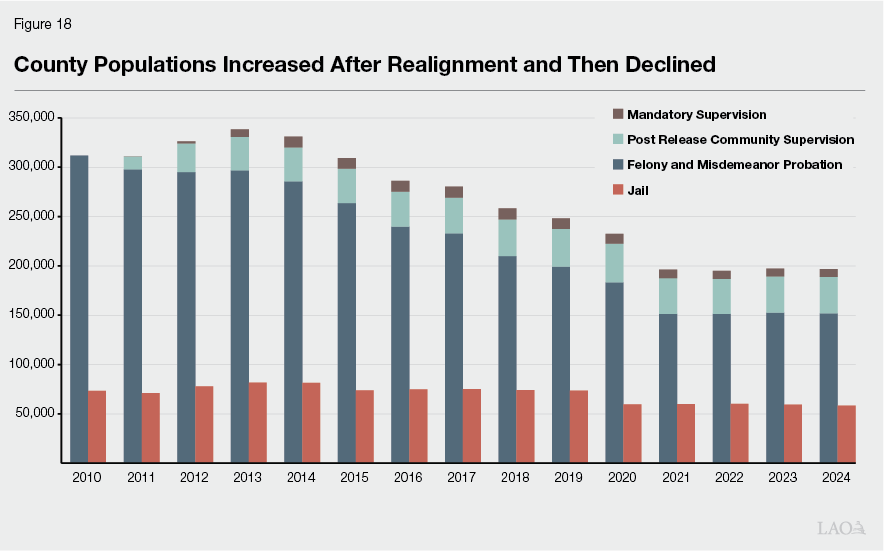
County Jail and Supervision Populations Increased After Realignment and Then Generally Declined. As shown in Figure 18, the jail population increased after realignment—by about 10,800 (15 percent) between 2011 and 2013. It then declined after Proposition 47 and again during the pandemic era. By 2024, the jail population was about 58,300 or about 15,100 (21 percent) lower than the pre‑realignment level in 2010. The total number of people under county community supervision increased between 2011 and 2013—by about 27,500 (9 percent)—primarily due to the creation of the PRCS and mandatory supervision populations. The supervision population subsequently generally declined primarily due to reductions in the number of people on felony probation. Notably, Chapter 328 of 2020 (AB 1950, Kamlager) reduced maximum probation terms to one year for misdemeanors and two years for felonies. Previously, misdemeanor probation terms could last up to three years and felony probation terms could last up to the greater of five years or the maximum sentence for the crime the person was on probation for. By 2024, the total number of people under county community supervision was about 196,700 or about 115,000 (37 percent) lower than the pre‑realignment level in 2010.
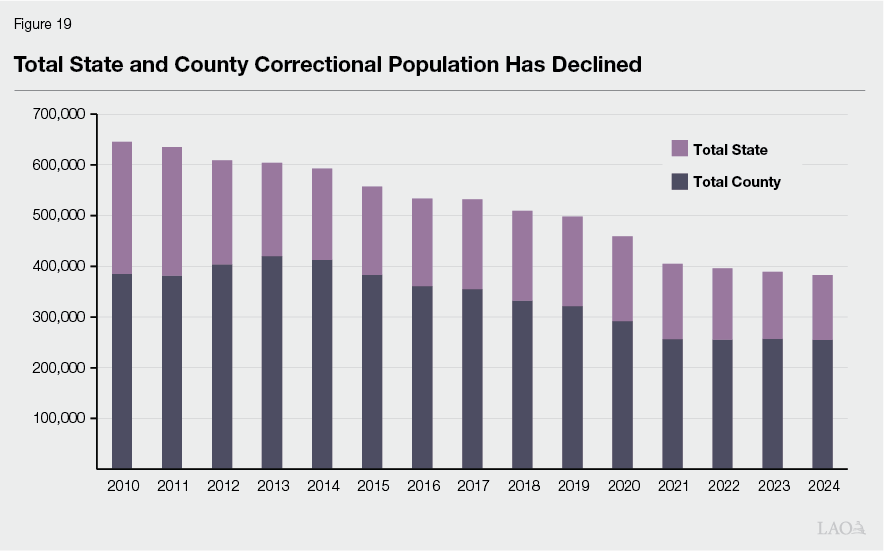
Total State and County Criminal Justice Population Has Declined. As discussed earlier in this report, the increase in the jail population caused by realignment was smaller than the corresponding decline in the prison population. The same is true for the community supervision population. This is because prior to the 2011 realignment, everyone released from state prison was supervised in the community for a period of time following release. However, under realignment, people who complete felony sentences at the local level are not supervised after serving their sentences. Accordingly, as shown in Figure 19, the total state and county criminal justice population decreased on net after realignment—by about 36,900 people (6 percent) between 2010 and 2012—and has generally trended downward, primarily due to various subsequent policy changes. Over the entire period from 2010 to 2024, the total criminal justice population declined by about 263,000 people (41 percent). The number of people under supervision declined by about 175,000 (43 percent) and the number of people incarcerated declined by about 88,000 (37 percent) over the period.
Did Realignment Impact Crime and Recidivism?
In this section, we review research on the impacts of the 2011 realignment on crime rates and recidivism. Recidivism is a measure of the rate at which people who enter the criminal justice system re‑offend after release. Because this research only covers the two‑year period following realignment, it is unclear whether the crime and recidivism impacts discussed below persist today. Given that there are so many other changes that have occurred in the criminal justice system since 2011, it would likely be difficult to disentangle the impacts of realignment today from other changes.
One Study Suggests Realignment Caused a Modest Increase in Property Crime. To assess whether realignment affected crime rates, a PPIC study identified a combination of other states that had similar crime trends to California prior to implementation of realignment. They then used these states to approximate what California’s crime rates would have been in 2012 and 2013 had it not implemented realignment. They found no evidence that realignment increased violent crime. However, they did find evidence that realignment increased California’s property crime rate, primarily by increasing the auto theft rate. Specifically, they estimated that realignment increased the auto theft rate by 17 percent. This translates to an additional roughly 70 auto thefts per 100,000 residents per year.
Another Study Suggests That People Released to PRCS Had Higher Recidivism Rates… Using data from 12 counties representative of the state, a 2017 PPIC study examined outcomes for two of the populations that were shifted from the state to counties under realignment: (1) people released to PRCS from prison and (2) people released from jail who were sentenced to either a straight or split felony jail term. Specifically, they looked at recidivism rates for these people in the two years following realignment as compared to similar people released from prison before realignment. The researchers found that people released to PRCS had slightly higher recidivism rates than similar people released from prison prior to realignment. Specifically, they found that 71.9 percent of those released to PRCS were rearrested (2.6 percentage points higher than the pre‑realignment comparison group) and 56.4 percent were reconvicted (2.4 percentage points higher). They hypothesized that the difference could be tied to an actual increase in offending behavior related to a perceived reduction in sanctions under realignment. Alternatively, they noted, it is possible that the PRCS population was monitored more closely while under county probation supervision than their pre‑realignment counterparts under parole supervision. If that were the case, then higher rates of recidivism could be due to a higher likelihood of detection of crime, not necessarily an actual difference in crime.
…While Recidivism Outcomes for People Sentenced to Jail Were Mixed… The researchers found that 74.5 percent of people released from jail who were sentenced to either a straight or split felony jail term were rearrested (2.3 percentage points higher than the pre‑realignment comparison group) and 54.9 percent were reconvicted (2 percentage points lower than the pre‑realignment comparison group).
…But Effects Varied and Could Be Different Now. Researchers noted that the results varied considerably between the counties. They hypothesized that this variation could be driven by demographic, economic, and geographic variation as well as differences in county capacity and/or experience in providing evidence‑based interventions before realignment. Finally, the researchers cautioned that recidivism rates are likely to change over time as counties build capacity and experience working with these new populations.
Key Takeaways
Below, we identify key takeaways from our review of the state and local experience with the 2011 realignment of adult felony populations. These takeaways are meant to help inform the Legislature when it considers future policy decisions related to the structure of criminal justice system responsibilities, and potentially state and local responsibilities more broadly.
Improved Alignment of Incentives Within the Criminal Justice System. Prior to realignment, county decision‑makers—such as prosecutors and Boards of Supervisors—were incentivized to prefer sentences to state prison, even though it is generally the most costly option. A person sentenced to incarceration for a felony would go to prison, be released to parole supervision, and potentially be returned to prison if they violate their parole—largely at state expense. In contrast, lesser sanctions—such as felony probation—are largely county costs. After the 2011 realignment, counties bear a greater share of the costs of incarcerating people convicted of felonies. Accordingly, the 2011 realignment helped to improve the alignment of criminal justice system costs with the level of government that has a significant role in deciding whether to incur those costs.
Led to a Large Decrease in Caseload but a Comparatively Small Increase in Crime, Suggesting a Potential Improvement in Overall Cost‑Effectiveness. As discussed above, the 2011 realignment did not result in a one‑to‑one shift of populations from the state to county responsibility. Instead, it resulted in a net decrease—by tens of thousands of people—in the total state and county criminal justice population. Research also suggests that the 2011 realignment may have contributed to a modest increase in property crime but no effect on violent crime. This substantial reduction in total caseload without a major increase in crime suggests that realignment may have improved the overall cost‑effectiveness of the criminal justice system. However, it is unclear what ultimately drove this increase in cost‑effectiveness. For example, if realignment improved delivery of programs and services designed to reduce reoffending, this could increase overall cost‑effectiveness. Alternatively, if the amount of incarceration used prior to realignment was not preventing very much crime relative to its costs, then simply reducing the amount of incarceration could have improved cost‑effectiveness.
Helped Address Significant Problems Facing the State. The 2011 realignment helped the state to significantly downsize its prison population and thereby reduce severe prison overcrowding. Absent such a reduction in the prison population, the state would have had to pay for significantly more prison capacity at a time when it was already in a deep fiscal crisis. Alternatively, it would have had to allow the federal courts to simply release tens of thousands of people from prison. In addition, by reducing its spending commitments and shifting revenues to counties instead of General Fund resources, the realignment created savings that helped the state address its significant budget shortfall.
Increased Population Pressure on Jails, Particularly Initially. Jails faced increased population pressure after the 2011 realignment and responded primarily by increasing the number of sentenced and unsentenced people who were released earlier than otherwise. Proposition 47 relieved some of this pressure. In addition, state‑financed jail construction has led to the addition of over 8,000 beds statewide and modernization of some existing capacity, though most of these construction projects were not completed until after the most acute population pressure on jails had subsided.
Led to Higher Risk and Need Populations at the County Level. The populations shifted to county jurisdiction under realignment appear to have relatively high risks of re‑offending and/or higher service and treatment needs. For example, people released from prison to PRCS appear to have higher underlying risks of reoffending than people released to parole. In addition, with the responsibility of housing more people serving felony sentences, jails are likely exposed to higher cost pressures and other challenges associated with delivering services to and providing security for a longer‑term, potentially more criminally sophisticated population.
Was Affected by Subsequent Changes, Which Influenced How Its Impacts Evolved Over Time. While realignment dramatically impacted California’s criminal justice system, subsequent changes have also significantly affected it. For example, while realignment created population pressures on jails and led to early releases, Proposition 47 significantly mitigated these issues. Accordingly, in considering realignment as it exists today, it is necessary to consider how subsequent changes to the criminal justice system have interacted with it.
Is Difficult to Fully Evaluate Due to the Limited Information on County Activities and Outcomes. Between 2011‑12 and 2023‑24, the state authorized a cumulative total of over $100 million for BSCC to distribute to counties who submitted information related to the implementation of the 2011 realignment, including responses to an annual survey on how they allocated the realigned tax revenues. This data may be helpful to stakeholders trying to understand how a specific county is implementing realignment in a given year. However, due to the way it was collected, the ability to make comparisons across counties (or even over time for the same county) is very limited. This made it difficult for the Legislature and stakeholders to provide oversight. In addition, while the 2011 realignment was expressly authorized with an expectation that counties could achieve better outcomes (such as reduced recidivism) than the state due to their greater flexibility to adapt programs and services, it is difficult to assess the extent to which this has occurred due to limited data on county activities and outcomes as well as the inherent difficulty of knowing what outcomes would have been absent the 2011 realignment.
Conclusion
The 2011 criminal justice realignment appears to have achieved some of its goals, including improving the alignment of fiscal incentives within the criminal justice system and helping the state address a fiscal crisis. In addition, it helped to mitigate prison overcrowding, which in turn, helped avoid court‑ordered prison releases and/or a costly expansion of the prison system and likely contributes toward a more well‑functioning prison system. Moreover, realignment generated a net reduction in the state and local criminal justice population with only a modest increase in property crime and no increase in violent crime. However, realignment imposed new burdens on counties in the form of increased and more complex‑to‑serve populations. While the state authorized bond funding to expand and modernize jail infrastructure, the earliest projects were not completed until 2014 and several projects are still not finished. In addition, while—in principle—counties are better positioned than the state to achieve positive outcomes due to their knowledge of and flexibility to adapt to local needs, it is ultimately unclear if this goal of the realignment has been met. This is due to data limitations and the challenge of knowing what would have happened in the absence of the 2011 realignment.
Appendix 1: Chapter 96 of 2023 (AB 1080, Ta)
(a) The Legislative Analyst’s Office shall prepare a report, to be submitted to the Legislature on June 30, 2026, evaluating the results of Assembly Bill 109 of the 2011‑12 Regular Session over the previous 10 years, including, but not limited to, the following:
(1) The amount of funding received per county and how that funding was allocated, including, but not limited to, the following categories:
(A) Funding received by department or agency.
(B) All types of facilities construction.
(C) The number and type of additional personnel.
(D) Rehabilitative programming.
(E) Any other services.
(2) Information on sentencing practices, including the use of straight sentencing, split sentencing, probation, diversion, and any other alternatives to custody.
(3) The impact on the county jail population as based on changes to the average monthly jail population, whether there were changes in jail release policies, and whether the county jail was under any court‑ordered population cap.
(4) Information on post‑release community supervision practices, including caseload of probation officers, responses to supervision violations, including describing the sanctions used and particularly the use of flash incarceration, and programming and services offered.
(5) Recidivism outcomes, as defined by rearrest and reconviction rates after release from custody for offenders sentenced under subdivision (h) of Section 1170, and those released on post‑release community supervision.
(b) The report may be based on data from every county, or alternatively, a multicounty study using data from at least 15 counties representative of the state.
(c) (1) A report to be submitted pursuant to subdivision (a) shall be submitted in compliance with Section 9795 of the Government Code.
(2) Pursuant to Section 10231.5 of the Government Code, this chapter is repealed on June 30, 2030.
Appendix 2: Realigned Revenues by County and Fiscal Year
The total amount of revenue that flows to counties to pay for the three felony populations is divided into two streams: base and growth. The total amount of money in a given year in the base stream is equivalent to the total amount of realigned revenue collected in that year, up to the total collected in the prior year. Any additional sales tax revenue collected above that amount goes into the growth stream and is distributed the following year. The base and growth amounts are allocated to counties using two separate formulas that were developed by the Department of Finance (DOF) in consultation with the California State Association of Counties (CSAC). The base formula allocates funding to each county using a fixed percentage that was determined in 2015‑16 by incorporating measures of each county’s felony jail and probation caseloads, overall adult population, crime rate, and other factors relevant to implementation of the 2011 realignment. The growth formula allocates funding based on factors that reflect county performance, including sending fewer new commitments to prison from one year to the next. In sum, the base formula uses permanent percentages that are intended to reflect each county’s share of overall workload, thereby promoting funding stability from year to year. In contrast, the growth formula is designed to change from year to year based on county performance, thereby providing an incentive for counties to improve over time. (Prior to 2015‑16, interim formulas were used to give DOF and CSAC time to collect relevant data and determine appropriate metrics needed to develop the permanent formulas.)
Realigned revenues by recipient county and fiscal year from both the base and growth accounts can be downloaded from the online version of this report. Base account revenues are listed by the fiscal year in which they were both collected and distributed. Growth account revenues are listed by the fiscal year in which they were collected.
Appendix 3: Jail Construction Financing
Since 2007, the state has authorized about $2.5 billion in General Fund‑backed lease revenue bonds to fund the construction and modernization of county jails. These funds have been awarded to counties through a competitive program administered by the Board of State and Community Corrections. In some cases, counties that were initially awarded bond funds later relinquished them (such as because construction bids or estimated operational costs were higher than anticipated). Relinquished funds are typically offered to counties who had applied but did not receive funding (or only received partial funding) in the initial round. As shown in Figures 1 and 2, a total of 53 awards have been made with some counties receiving more than one. As of September 8, 2025, projects associated with 36 awards were completed, yielding a net capacity gain of 8,266 beds. Projects associated with the remaining 17 awards were not yet completed and are expected to yield a net capacity increase of 151 beds. A total of 18 counties received no bond funding for jail construction through these awards. Of that amount, ten received awards they later relinquished, three applied for bond funds but were not successful, and five did not apply for funds.
Appendix 3, Figure 1
Jail Construction Projects Completed as of
September 8, 2025
|
County |
Award (in Millions of Dollars) |
Net Bed Gain |
Year Completed |
|
San Bernardino |
$100.0 |
1,368 |
2014 |
|
San Diego |
100.0 |
788 |
2014 |
|
Solano |
61.5 |
362 |
2014 |
|
Madera |
27.8 |
144 |
2014 |
|
Calaveras |
26.4 |
95 |
2014 |
|
Stanislaus |
77.4 |
382 |
2015 |
|
Kings |
33.0 |
240 |
2016 |
|
Madera |
3.0 |
— |
2016 |
|
San Luis Obispo |
25.1 |
149 |
2017 |
|
Stanislaus |
36.6 |
288 |
2017 |
|
Kern |
100.0 |
822 |
2018 |
|
Imperial |
32.5 |
274 |
2018 |
|
Santa Cruz |
24.6 |
(98) |
2018 |
|
Solano |
23.0 |
— |
2018 |
|
Napa |
13.5 |
— |
2018 |
|
Kings |
18.7 |
24 |
2018 |
|
Tulare |
60.0 |
494 |
2019 |
|
Sutter |
9.7 |
42 |
2019 |
|
Riverside |
100.0 |
1,183 |
2020 |
|
Santa Barbara |
80.0 |
316 |
2021 |
|
Yolo |
36.3 |
(125) |
2021 |
|
San Benito |
15.1 |
72 |
2021 |
|
Tuolomne |
13.0 |
32 |
2021 |
|
Tuolomne |
20.0 |
51 |
2021 |
|
Monterey |
80.0 |
576 |
2022 |
|
Trinity |
20.0 |
19 |
2022 |
|
Ventura |
55.1 |
— |
2023 |
|
Yolo |
26.2 |
10 |
2023 |
|
Orange |
100.0 |
512 |
2024 |
|
Orange |
80.0 |
384 |
2024 |
|
Fresno |
79.2 |
(199) |
2024 |
|
Plumas |
25.0 |
(7) |
2024 |
|
Placer |
13.8 |
(176) |
2025 |
|
Napa |
2.8 |
196 |
2025 |
|
Placer |
30.0 |
— |
2025 |
|
Napa |
20.0 |
48 |
2025 |
|
Totals |
$1,569.4 |
8,266 |
Appendix 3, Figure 2
Jail Construction Projects Not Yet Completed as of
September 8, 2025
|
County |
Award (in Millions |
Anticipated |
Status |
|
San Joaquin |
$36.5 |
256 |
Construction 99% |
|
Yuba |
20.0 |
— |
Construction 98% |
|
Contra Costa |
70.0 |
— |
Construction 98% |
|
Butte |
40.0 |
— |
Construction 96% |
|
Amador |
17.2 |
40 |
Construction 83% |
|
Tehama |
20.0 |
64 |
Construction 78% |
|
Mendocino |
25.0 |
60 |
Construction 75% |
|
Merced |
40.0 |
— |
Construction 73% |
|
Colusa |
20.0 |
4 |
Construction 70% |
|
El Dorado |
25.0 |
‑6 |
Construction 23% |
|
Mono |
25.0 |
46 |
Construction 0%‑5% |
|
Tulare |
40.0 |
‑110 |
Pending Contract Award |
|
Madera |
19.0 |
20 |
Pending Contract Award |
|
Sonoma |
40.0 |
— |
Pending Contract Award |
|
Alameda |
54.3 |
‑18 |
Pending Scope Change |
|
Modoc |
24.5 |
3 |
Pending Scope Change |
|
San Bernardino |
50.5 |
‑208 |
Pending Establishment |
|
Totals |
$567.1 |
151 |
Selected References
Bird, Mia and Ryken Grattet (2020). SB 678 Incentive‑Based Funding and Evidence‑Based Practices Enacted by California Probation Are Associated with Lower Recidivism Rates and Improved Public Safety. California Probation Resource Institute.
Bird, Mia, Ryken Grattet and Viet Nguyen (2017). Realignment and Recidivism in California. Public Policy Institute of California.
Grattet, Ryken, Sonya Tafoya, Mia Bird and Viet Nguyen (2016). California’s County Jails in the Era of Reform. Public Policy Institute of California.
Lawrence, Sarah (2014). Court‑Ordered Population Caps in California County Jails. Stanford Criminal Justice Center.
Lofstrom, Magnus and Steven Raphael (2013). Impact of Realignment on County Jail Populations. Public Policy Institute of California.
Lofstrom, Magnus and Steven Raphael (2015). Realignment, Incarceration, and Crime Trends in California. Public Policy Institute of California.
Martin, Brandon and Magnus Lofstrom (2026). California’s County Jails. Public Policy Institute of California.
Nguyen, Viet, Ryken Grattet and Mia Bird (2017). California Probation in the Era of Reform. Public Policy Institute of California.