Ann Hollingshead

November 19, 2025
The 2026-27 Budget
California's Fiscal Outlook
- Introduction
- AI Enthusiasm Boosting Revenues, but for How Long?
- Why Do Budget Problems Grow?
- Comments
- Appendix
Executive Summary
Not Safe to Bet Artificial Intelligence (AI) Fueled Exuberance Is Sustainable. Both the California and U.S. economies currently face significant headwinds. Borrowing costs, a key factor in business expansions and major consumer purchases, remain high. New tariffs on imports into the U.S. are creating cost pressures for businesses and consumers. Despite this, income tax collections have been strong in recent months, growing at double‑digit rates. These strong income tax collections are being driven by enthusiasm around AI, which has pushed the stock market to record highs and boosted compensation among the state’s tech workers. With so much exuberance surrounding AI, it now appears time to take seriously the notion that the stock market has become overheated. History suggests that the stock market is prone to overreact to major technological advances, even if the technology itself turns out to be revolutionary.
Our Revenue Outlook Builds in Some Insurance Against a Stock Market Downturn. Reflecting concerns about the potential effects of tariffs, the budget act enacted in June assumed revenues would decline in 2025‑26 and grow modestly in 2026‑27. Looking primarily at strong trends in income tax collections since June would suggest a significant upgrade to budget act revenues is warranted. However, our Fiscal Outlook revenue forecast reflects a smaller, temporary upgrade which reverses beginning in 2026‑27. This is because our forecast incorporates the strong risk that recent income tax gains are tied to an unsustainable stock market. This does not mean our forecast assumes a stock market downturn will definitely happen. Instead, our forecast includes income tax collections that are somewhat weaker than suggested by cash trends, but still tens of billions of dollars above where they would be if stocks actually drop significantly. This middle‑ground approach offers the state some insurance against revenue declines, resulting in smaller budget corrections should a market downturn actually occur.
2026‑27 Budget Problem Now Larger Than Anticipated. Under our revenue and spending estimates, the Legislature faces an almost $18 billion budget problem in 2026‑27. This is about $5 billion larger than the budget problem anticipated by the administration in June, despite improvements in revenue. This is because constitutional spending requirements under Proposition 98 (1988) and Proposition 2 (2014) almost entirely offset revenue gains. Moreover, we estimate costs in other programs to be about $6 billion higher than anticipated. Starting in 2027‑28, we estimate structural deficits to grow to about $35 billion annually due to spending growth continuing to outstrip revenue growth.
Budget Position Is Weak. We advise the Legislature to address the budget problem through a combination of ongoing solutions—namely, achievable spending reductions and/or revenue increases. There are three reasons these actions are now critical. First, the budget problem is now larger than anticipated, despite improvements in revenue, and the structural deficits are significant and growing. Second, while our revenue estimates hedge against a market downturn, they do not reflect the revenue declines the state would experience in a recession. Third, the state has used most of its budget resiliency tools to address prior deficits. If our estimates hold, the Legislature will face a fourth consecutive year of budget problems—all during a period of overall revenue growth. As it stands—with larger forecasted deficits and many fewer tools available to address them—California’s budget is undeniably less prepared for downturns.
Introduction
Each year, our office publishes the Fiscal Outlook in anticipation of the upcoming budget season. This report gives the Legislature our independent estimates and analysis of the state’s General Fund budget condition with the goal of helping lawmakers prepare for the 2026‑27 budget process. As always, our Fiscal Outlook evaluates the budget’s condition based on current law and policy both at the state and federal level. This means we are assessing the state’s spending and revenues assuming no new laws or policies are enacted. This is not a prediction of what will happen—state and federal laws and policies will change in the coming years—but rather serves as a baseline to help the Legislature understand its starting place. This year, for example, our outlook reflects our best estimates of the effects of H.R. 1: One Big Beautiful Bill Act on the state budget but does not make assumptions about future federal policy changes.
AI Enthusiasm Boosting Revenues, but for How Long?
Middling Corporation and Sales Tax Collections in Line With Generally Weak Economic Conditions. Both the California and U.S. economies currently face significant headwinds. Borrowing costs, a key factor in business expansions and major consumer purchases, remain high. New tariffs on imports into the U.S. are creating cost pressures for businesses and consumers. And uncertainty with the federal government appears to be contributing to a general anxiety about the economy. Amid these conditions, California businesses have pared back hiring, resulting in no payroll job growth in the state so far this year. California consumers similarly are limiting spending, with sales of taxable goods flat over the last year. Consumers also continue to report historically low optimism about the economy’s future. Consistent with these trends, collections from the sales tax and corporation tax (adjusted for recent policy changes) have posted below‑average growth in recent months.
Income Tax, Fueled by Exuberance Over Artificial Intelligence (AI), Remains Lone Bright Spot. In stark contrast, income tax collections have been strong in recent months, growing at double‑digit rates. These strong income tax collections are being driven by enthusiasm around AI, which has pushed the stock market to record highs and boosted compensation among the state’s tech workers. The stock market (S&P 500) has risen 50 percent in the last two years. Most of these gains come from the meteoric rise in the value of a handful of tech companies that investors believe will be major beneficiaries of recent advances in AI. These companies have made big bets on AI, spending hundreds of billions of dollars on data centers and offering extraordinary pay packages to recruit AI researchers. This spending, coupled with sizable gains to investors and tech company employees via stock options, is boosting state income tax receipts.
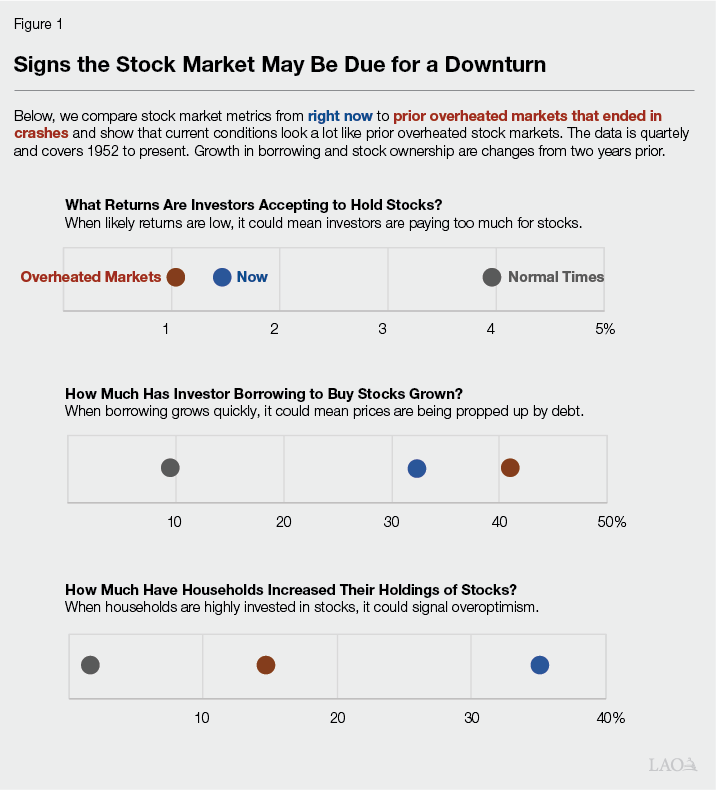
This Time Might Be Different, but It Is Not Safe to Bet on It. With so much enthusiasm surrounding AI, it now appears time to take seriously the notion that the stock market has become overheated. History suggests that the stock market is prone to overreact to major technological advances, even if the technology itself turns out to be revolutionary. For California, the dot‑com era—when stocks rose and then fell precipitously in response to widespread adoption of the internet—offers the most salient example. The internet has proven to be a transformative technology and, yet, the stock market’s initial reaction was clearly overly exuberant. As shown in Figure 1, many signs of an overly exuberant stock market are present today: measures of whether stocks are “expensive” are at historically high levels, investors are borrowing more to buy stocks, and households are more invested in the stock market than they have been in at least 70 years. In the past, these patterns have been a sign that a stock market downturn will occur in the next couple of years. There certainly is some chance that this time is different and such a downturn is not forthcoming. Nonetheless, the risk appears strong enough—and the potential consequences for the state budget dire enough—that we think it should be incorporated in the state’s revenue outlook.
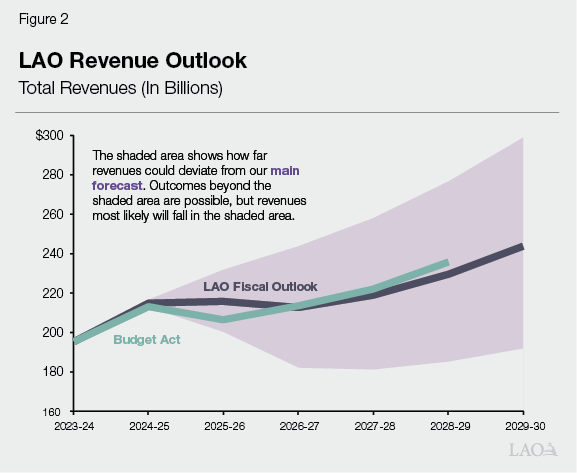
Our Revenue Outlook Builds in Some Insurance Against a Stock Market Downturn. Reflecting concerns about the potential effects of tariffs, the budget act enacted in June assumed revenues would decline in 2025‑26 and grow modestly in 2026‑27. Looking primarily at strong trends in income tax collections since June would suggest a significant upgrade to budget act revenues is warranted. However, our Fiscal Outlook revenue forecast, shown in Figure 2, reflects a smaller, temporary upgrade which reverses beginning in 2026‑27—resulting in 2026‑27 revenues being in line with budget act estimates. This is because our forecast incorporates the strong risk that recent income tax gains are tied to an unsustainable stock market. This does not mean our forecast assumes a stock market downturn will definitely happen. Instead, because a market downturn is only a risk but not a certainty, our forecast includes income tax collections that are somewhat weaker than suggested by cash trends, but still tens of billions of dollars above where they would be if stocks actually drop significantly. This middle‑ground approach offers the state some insurance against revenue declines, resulting in smaller budget corrections should a market downturn actually occur. On the other hand, if a market downturn does not occur, revenues very likely will beat our forecast. Should this occur, we advise the Legislature to treat these extra revenues as temporary for the time being.
Why Do Budget Problems Grow?
$18 Billion Budget Problem in 2026‑27
2025‑26 Budget Act Anticipated Deficits Through the Multiyear. The Legislature has needed to address budget problems for three years in a row. The state solved a $27 billion deficit in 2023‑24, a $55 billion deficit in 2024‑25, and a $15 billion deficit in 2025‑26 (in addition to roughly $28 billion in proactive budget‑balancing actions taken the year before). At the time of the 2025‑26 Budget Act, the administration anticipated the state would face an almost $13 billion budget problem in 2026‑27. In addition, the administration estimated the state would continue to face structural deficits between $15 billion and $25 billion through 2028‑29.
2026‑27 Budget Problem Now Larger Than Anticipated. Under our revenue and spending estimates, the Legislature faces an almost $18 billion budget problem in 2026‑27. This is about $5 billion larger than the budget problem anticipated by the administration in June. Figure 3 provides our estimates of the General Fund condition, including our estimate of the budget problem. The budget’s bottom line is the accumulated change in General Fund revenues and spending across the three fiscal years in the budget window—2024‑25, 2025‑26, and 2026‑27—and reflected in the ending balance in the Special Fund for Economic Uncertainties in 2026‑27.
Figure 3
General Fund Condition Under Fiscal Outlook
(In Millions)
|
2024‑25 |
2025‑26 |
2026‑27 |
|
|
Prior‑year balance |
$41,978 |
$33,386 |
$23,833 |
|
Revenues and transfers |
228,694 |
222,639 |
212,400 |
|
Total expenditures |
237,286 |
232,193 |
235,931 |
|
Ending fund balance |
$33,386 |
$23,833 |
$302 |
|
Encumbrances |
$18,001 |
$18,001 |
$18,001 |
|
SFEU balance |
$15,385 |
$5,832 |
‑$17,699 |
|
Reserves |
|||
|
BSA balance |
18,351 |
14,023 |
14,023 |
|
SFEU = Special Fund for Economic Uncertainties and BSA = Budget Stabilization Account. |
|||
Revenue Improvement Almost Entirely Offset by Constitutional Requirements. Across 2024‑25 to 2026‑27, our revenue estimates are up $11 billion compared to the budget act. These revenue improvements do not, on net, improve the budget’s bottom line, however. This is because of the requirements of Proposition 98 (1988), which governs school and community college funding, and Proposition 2 (2014), which specifies reserve deposits and debt payments, as seen in Figure 4. Together, due to higher revenue estimates, these requirements increase by over $10 billion—representing nearly all of the revenue gain. The share of revenues going to these requirements is more than typical. Specifically, over 60 percent of the revenue improvement—$7 billion—goes to schools and community colleges. Of this increase, $5.1 billion reflects formula‑driven increases in the Proposition 98 requirement resulting from our higher revenue estimates. (A portion of this increase is due to “maintenance factor”—a formula requiring the state to accelerate funding in 2024‑25 to compensate for the suspension of the minimum requirement in the previous year.) The remaining $1.9 billion is related to paying a preexisting “settle‑up” obligation from the June 2025 budget. (More information about funding for schools and community colleges under our outlook can be found in the box below.) In addition, while we assume Proposition 2 reserve deposits for 2026‑27 are suspended—due to the anticipated budget problem—revenue improvements in 2024‑25 and 2025‑26 require the state to make $2.8 billion in “true up” reserve deposits. Under our revenue estimates, the state also is required to make roughly $600 million more in debt payments in 2026‑27 compared to budget act assumptions. If the state did not choose to suspend the BSA deposit for 2026‑27, constitutional requirements would actually exceed the state’s revenue gains under our outlook.
Figure 4
Revenue Improvement More Than
Offset by Higher Costs
(In Billions)
|
Anticipated Deficit at 2025‑26 Budget Act |
‑$12.6 |
|
Revenues higher |
$11.1 |
|
Proposition 98 higher |
‑7.0 |
|
Proposition 2 higher |
‑3.4 |
|
All other spending higher |
‑5.7 |
|
Anticipated Deficit at LAO Fiscal Outlook |
‑$17.7 |
School and Community College Funding
Proposition 98 Requirement Controlled by Formulas. Proposition 98 (1988) establishes a minimum annual funding level for schools and community colleges. The state calculates this requirement each year using formulas in the State Constitution that account for changes in General Fund revenue, per capita personal income, student attendance, and other inputs. The state meets the requirement through General Fund spending and local property tax revenue. For any given budget, the state has new estimates for the previous, current, and upcoming years.
Formula‑Driven Requirements Increase General Fund Spending by $5.1 Billion. We estimate the Proposition 98 formulas require a $5.1 billion increase in General Fund spending across the 2024‑25 through 2026‑27 period (relative to the June 2025 estimates). This increase mainly reflects our higher revenue estimates in 2024‑25 and 2025‑26. Specifically, the formulas automatically direct nearly 40 percent of the additional revenue to schools and community colleges, and they also require the state to make a larger “maintenance factor” payment. Maintenance factor accelerates the required funding increase in 2024‑25 to compensate for the suspension of the minimum requirement in 2023‑24.
Preexisting “Settle‑Up” Obligation Increases Spending by $1.9 Billion. The June 2025 budget approved school and community funding at a level $1.9 billion below the estimated requirement for 2024‑25. This gap created a one‑time obligation commonly known as settle up. We assume the state pays this obligation in the upcoming budget, consistent with its practice since 2018‑19. Trailer legislation specifies that the state will use the payment to support existing education programs, eliminate payment deferrals, and/or avoid future deferrals.
Large One‑Time Windfall and Modest Ongoing Increase for School and Community College Programs. Accounting for the formula‑driven increases and the settle‑up payment, total General Fund spending is up nearly $7 billion from the June 2025 estimates (see “Proposition 98 Funding Changes for Schools and Community Colleges” in the appendix). We estimate this higher spending—combined with growth in local property tax revenue and several smaller adjustments—makes $7.4 billion in one‑time funds available for school and community college purposes in the upcoming budget. Regarding ongoing funds, we estimate the state could cover a 2.51 percent statutory cost‑of‑living adjustment for existing programs, but no other ongoing increases.
State Has Options to Help Protect Ongoing Programs. If state revenues decline, the funding set aside under Proposition 98 would decrease by about 40 cents for each $1 in lower revenue. Moreover, our outlook projects a zero balance in the state’s school reserve by the end of 2026‑27. The Legislature could use the one‑time funding to build a buffer that would protect school and community college programs. Specifically, it could (1) eliminate the payment deferrals included in the June budget, (2) provide schools and community colleges with an advance payment toward their future funding allocations, and (3) expedite the restoration of a block grant that it previously reduced. We explain these options in The 2026‑27 Budget: Fiscal Outlook for Schools and Community Colleges.
All Other Costs Increase Budget Problem by Almost $6 Billion. Across all other programs, total spending increases about $6 billion compared to budget act estimates. These changes are described below and summarized in Figure 5.
- Statewide Expenditures Higher by $2.4 Billion. Statewide expenditures include items like retiree health care, pension payments, and statewide administrative costs, as well as set‑asides for major state costs or savings that are not easily reflected in departments’ budgets. At the time of the budget act, the administration assumed savings in statewide expenditures that are not reflected in our outlook.
- H.R. 1 Increases Costs by $1.3 Billion Across Medi‑Cal and CalFresh. H.R. 1 made a number of changes to Medicaid, known as Medi‑Cal in California, and the Supplemental Nutrition Assistance Program, known as CalFresh in California. Generally, these changes will result in fewer program beneficiaries and increased state costs. In 2026‑27, we anticipate state costs for Medi‑Cal and CalFresh to increase about by $1 billion and $300 million, respectively, due to H.R. 1. Importantly, our estimate assumes the state can continue levying provider taxes at their existing levels. (Shortly before we released this report, federal administrators issued preliminary guidance suggesting that the state would need to start adjusting certain provider taxes beginning July 2026. Our estimates do not reflect this recent guidance.)
- Corrections Costs Higher by About $850 Million. Our estimates for corrections costs are higher across the budget window by a total of about $850 million compared to the administration’s estimates. Fundamentally, these higher cost estimates reflect an imbalance between the California Department of Corrections and Rehabilitation costs and the amount provided in its budget. The imbalance includes two components: (1) the partial continuation of a gap between its budget and its ongoing costs that were identified in 2024‑25 but that have not been addressed fully and (2) additional efficiencies assumed as part of the 2025‑26 budget that we estimate will yield less savings than anticipated.
- All Other Costs Up by $1.1 Billion. We reflect a solutions erosion of close to $800 million related to employee compensation changes adopted as part of the budget package. In addition, all other costs, mostly in health and human services programs, are up close to $300 million.
Figure 5
Other Spending Up by About $6 Billion
(In Billions)
|
Other Spending Changes |
|
|
Statewide expenditures |
$2.4 |
|
H.R. 1 |
1.3 |
|
Corrections |
0.9 |
|
Solutions erosion |
0.8 |
|
Other |
0.3 |
|
Total |
$5.7 |
Out‑Year Budget Problems of About $35 Billion Each Year
While Some Recent Solutions Tempered Spending Growth… In our November 2024 outlook, we highlighted that both the difference in the levels of revenue and spending as well as the difference between revenue and spending growth rates were driving structural deficits. In addressing the budget problem, the Legislature enacted some ongoing spending solutions that reduced spending by an estimated $2.5 billion in 2025‑26, which at the time were expected to grow to over $10 billion by 2028‑29. These ongoing solutions largely were focused in Medi‑Cal, which prior to the budget act had been expected to grow over 7 percent on average annually. While the costs of H.R. 1 increase Medi‑Cal spending, which we describe in the box below, we now anticipate Medi‑Cal growth to be 4.1 percent on average from 2025‑26 through 2029‑30.
…Spending Growth Remains Elevated. Despite these solutions, the gap between spending and revenues widens by over $10 billion in 2027‑28. This widening gap is due to both faster spending growth in 2027‑28 as well as below‑average revenue growth in that year. Faster spending growth is driven by a few factors, including: (1) the costs of H.R. 1 ramping up, (2) the expiration of certain one‑time solutions, namely furloughs, (3) the planned repayment of budgetary borrowing (like the Proposition 98 and Medi‑Cal maneuvers), and (4) the planned expansion of certain programs, like child care slots and foster care rate reform. After 2027‑28, although forecasted spending and revenue growth rates roughly even out, the gap between their respective levels remains, causing structural deficits to persist.
Estimated Fiscal Effects of H.R. 1 on Medi‑Cal and CalFresh
In total, we estimate H.R. 1 will increase state costs by about $5 billion by 2029‑30. Specifically, we estimate Medi‑Cal costs will increase on net by $3 billion and CalFresh costs will increase by almost $2 billion. The largest drivers of the costs in Medi‑Cal are the restrictions on provider taxes and an increase in the state’s share of costs for limited‑scope coverage for immigrant populations. These costs are offset by the anticipated decline in enrollment of childless adults due to the new community engagement (or work) requirements. In CalFresh, increased costs largely are driven by the state’s share of costs for benefits. (While the state is taking steps to reduce the state’s share of costs for benefits, the success of those efforts is yet to be known.) Importantly, our estimate of state costs under H.R. 1 are limited to only those costs the state must pay due to changes in cost sharing ratios and other changes in law. Our estimates do not include any costs of changes in policy that are under the Legislature’s discretion, like backfilling reductions in federal funds due to eligibility changes.
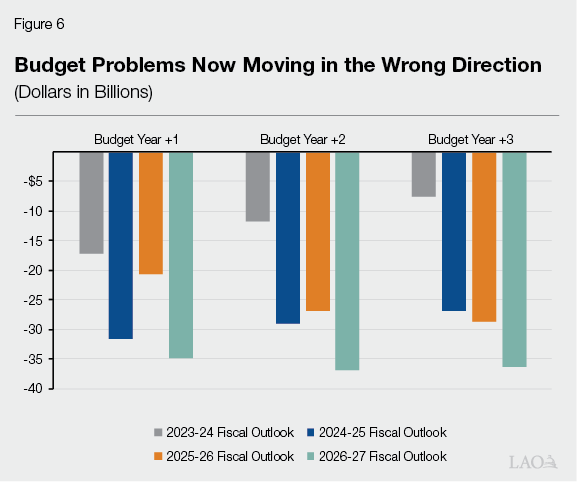
Structural Deficits Now Moving in the Wrong Direction. Under our estimates, structural deficits would be around $35 billion annually starting in 2027‑28. These out‑year deficits are larger than our recent outlooks as shown in Figure 6. There are two main drivers of these deficits. One, revenues dropped significantly in 2022‑23 and today remain below where they were projected to be. Two, the state has not adjusted the current level of ongoing state services to fully reflect this more limited capacity. To some degree, this is because certain solutions, particularly related to state operational efficiencies, were overly optimistic in their assumed level of savings.
Comments
Budget Position Is Weak. We advise the Legislature to address the budget problem through a combination of ongoing solutions—namely, achievable spending reductions and/or revenue increases. There are three reasons these actions are now critical. First, the budget problem is now larger than anticipated, despite improvements in revenue, and the structural deficits are significant and growing. Second, while our revenue estimates hedge against a market downturn, they do not reflect the revenue declines the state would experience in a recession. Third, as explained below, the state has used most of its budget resiliency tools to address prior deficits. If our estimates hold, the Legislature will face a fourth consecutive year of budget problems—all during a period of overall revenue growth.
Budget Resilience Waning. In solving the last few years of deficits, the Legislature largely was able to avoid making ongoing spending cuts to the state’s core programs. Rather, the budget problems were addressed mostly with temporary fixes, which included reducing one‑time spending, using budgetary borrowing, withdrawing reserves, and temporarily increasing revenues. Some options remain, however. The state has $14 billion in reserves and could likely find additional capacity for budgetary borrowing, if needed. That said, at this point, the state has used over $20 billion in borrowing, one‑time and temporary spending solutions are exhausted, and budget reserves are at about half of their peak. As it stands—with larger forecasted deficits and many fewer tools available to address them—California’s budget is undeniably less prepared for downturns.
Ignoring Risks Could Create Serious Challenges Later. While important components of the state economy are sluggish, revenues are not falling, nor are conditions as bad as they would be in an outright recession. This makes solving the budget problem with ongoing solutions all the more important. Continuing to use temporary tools—like budgetary borrowing—would only defer the problem and, ultimately, leave the state ill‑equipped to respond to a recession or downturn in the stock market. Our revenue forecast begins to factor in the possibility of such a downturn. As such, building a budget using these revenues would mean taking important steps toward bringing the state into structural balance before a crisis arrives.
Upside on Revenue Unlikely to Balance Budget… Revenues could come in higher than our forecast. Even with significant revenue improvement, however, the state likely would still face deficits in future years. As a rough rule of thumb, due to the requirements of Proposition 98 and Proposition 2, to balance the budget, revenue improvement needs to be almost double the size of the deficit. As such, under our estimates, annual revenues would need to be about $60 billion higher than we forecast to close the out‑year gaps. Revenue gains of this magnitude are quite unlikely.
…Or Be Sustainable. In the near term, a key source of upside is continued stock market strength. If this occurs, we advise the Legislature to consider such an upside as temporary and still take steps to bring the budget into structural balance. We recommend the Legislature use any additional revenues to rebuild budget resilience either through reserve deposits or repaying outstanding budgetary debts.
Appendix
Appendix Figure 1
LAO Fiscal Outlook Revenues
(In Billions)
|
2024‑25 |
2025‑26 |
2026‑27 |
2027‑28 |
2028‑29 |
2029‑30 |
|
|
Personal Income Tax |
$128.8 |
$130.4 |
$125.2 |
$133.6 |
$141.4 |
$151.9 |
|
Corporation Tax |
41.3 |
41.7 |
41.7 |
41.5 |
43.0 |
45.2 |
|
Sales Tax |
33.6 |
34.0 |
34.3 |
35.4 |
36.5 |
37.5 |
|
Total “Big Three” Revenue |
$203.7 |
$206.1 |
$201.2 |
$210.4 |
$220.9 |
$234.7 |
|
Other Revenues |
$11.4 |
$10.0 |
$11.7 |
$8.5 |
$8.9 |
$9.2 |
|
Total Revenues |
$215.0 |
$216.1 |
$213.0 |
$219.0 |
$229.8 |
$243.9 |
|
BSA Deposit or Withdrawal |
$4.8 |
$4.3 |
— |
‑$2.3 |
‑$3.0 |
‑$2.3 |
|
Other Transfers |
8.8 |
2.2 |
‑$0.6 |
0.7 |
‑0.3 |
‑0.3 |
|
Total Revenues and Transfers |
$228.7 |
$222.6 |
$212.4 |
$217.4 |
$226.4 |
$241.3 |
|
BSA = Budget Stabilization Account. |
||||||
Appendix Figure 2
General Fund Spending by Agency Through 2029‑30
(Dollars in Billions)
|
Agency |
2024‑25 |
2025‑26 |
2026‑27 |
2027‑28 |
2028‑29 |
2029‑30 |
Average |
|
Legislative, Executive |
$7.6 |
$5.1 |
$3.6 |
$3.6 |
$3.0 |
$3.0 |
‑5.5% |
|
Courts |
3.2 |
3.3 |
3.4 |
3.5 |
3.7 |
3.8 |
4.2 |
|
Business, Consumer Services, and Housing |
3.7 |
0.7 |
1.0 |
0.6 |
0.6 |
0.6 |
‑16.8 |
|
Transportation |
0.3 |
0.2 |
— |
— |
— |
— |
— |
|
Natural Resources |
7.5 |
2.7 |
2.5 |
3.4 |
3.5 |
4.0 |
16.8 |
|
Environmental Protection |
0.6 |
0.1 |
0.1 |
0.1 |
0.1 |
0.1 |
0.1 |
|
Health and Human Services |
76.2 |
86.5 |
91.8 |
99.8 |
104.5 |
108.9 |
5.9 |
|
Corrections and Rehabilitation |
13.6 |
13.3 |
13.1 |
13.0 |
12.9 |
13.0 |
‑0.2 |
|
Education |
19.9 |
19.3 |
21.6 |
23.5 |
24.3 |
25.3 |
5.5 |
|
Labor and Workforce Development |
1.1 |
1.0 |
0.9 |
1.0 |
1.0 |
1.0 |
1.0 |
|
Government Operations |
3.5 |
2.8 |
3.5 |
3.2 |
3.9 |
3.8 |
2.4 |
|
General Government |
|||||||
|
Non‑Agency Departments |
2.4 |
1.2 |
1.1 |
1.7 |
1.1 |
1.1 |
‑0.7 |
|
Tax Relief/Local Government |
0.7 |
0.8 |
0.6 |
0.7 |
0.7 |
0.7 |
4.3 |
|
Statewide Expenditures |
1.1 |
4.4 |
4.4 |
6.3 |
7.5 |
8.4 |
23.7 |
|
Capital Outlay |
0.8 |
0.7 |
0.2 |
0.3 |
0.2 |
0.2 |
‑10.6 |
|
Debt Service |
5.5 |
5.8 |
5.9 |
5.9 |
5.9 |
6.0 |
0.6 |
|
Non‑98 Spending Total |
$147.8 |
$147.9 |
$153.8 |
$166.6 |
$173.1 |
$179.9 |
5.4% |
|
Proposition 98a |
$89.5 |
$84.3 |
$82.1 |
$85.8 |
$90.2 |
$97.7 |
6.0% |
|
Total Forecasted Spending |
$237.3 |
$232.2 |
$235.9 |
$252.3 |
$263.2 |
$277.5 |
5.6% |
|
aReflects General Fund component of the Proposition 98 guarantee. bFrom 2026‑27 to 2029‑30. |
|||||||
Appendix Figure 3
Proposition 98 Funding Changes for Schools and Community Colleges
(Dollars in Millions)
|
June Budget |
November LAO |
Change |
||
|
Amount |
Percent |
|||
|
2024‑25 |
||||
|
General Funda |
$85,711 |
$89,520 |
$3,809 |
4.4% |
|
Local property tax |
32,317 |
32,581 |
263 |
0.8 |
|
Totals |
$118,029 |
$122,101 |
$4,072 |
3.5% |
|
2025‑26 |
||||
|
General Fund |
$80,738 |
$84,326 |
$3,588 |
4.4% |
|
Local property tax |
33,821 |
34,029 |
208 |
0.6 |
|
Totals |
$114,558 |
$118,355 |
$3,796 |
3.3% |
|
2026‑27 |
||||
|
General Fund |
$82,536 |
$82,130 |
‑$406 |
‑0.5% |
|
Local property tax |
35,556 |
35,671 |
115 |
0.3 |
|
Totals |
$118,092 |
$117,800 |
‑$291 |
‑0.2% |
|
Three‑Year Totals |
||||
|
General Fund |
$248,985 |
$255,976 |
$6,991 |
2.8% |
|
Local property tax |
101,694 |
102,280 |
586 |
0.6 |
|
Totals |
$350,679 |
$358,256 |
$7,577 |
2.2% |
|
aJune budget amount excludes $1.9 billion “settle‑up” obligation. Our November outlook assumes the state pays this obligation. |
||||