LAO Contact

February 8, 2024
The 2024‑25 Budget
Supplemental Security Income/State Supplementary Payment (SSI/SSP) Program
Summary
For 2024-25, the Governor’s budget proposes $3.7 billion from the General Fund for the state’s share of SSI/SSP—an increase of $121 million (3 percent) over estimated 2023-24 expenditures. This increase would bring total program funding to $11.5 billion ($3.7 billion from the General Fund and $7.8 billion federal funds) in 2024-25. The primary driver of this increase is the full-year cost impact of the 9.2 percent SSP grant increase that took effect on January 1, 2024. The administration does not include any new SSP related proposals as part of the Governors 2024-25 budget.
Background
The SSI/SSP program provides cash grants to low-income aged, blind, and disabled individuals. Grant levels for SSI/SSP are determined by both the federal government and the state. Specifically, the federal government pays for the SSI portion of the grant while the state pays the SSP portion of the grant.
Federal Government Required to Provide Annual Cost-of-Living (COLA) Adjustment to SSI Grants… The federal government is required to provide an annual COLA each January to the SSI portion of the grant. The federal COLA is based on the Consumer Price Index for Urban Wage Earners and Clerical Workers (CPI-W). In years that the CPI-W is negative (as was the case in 2010, 2011, and 2016), the federal government does not decrease SSI grants, but instead holds them flat.
…While State Has Option to Provide Annual COLA to SSP Grants. The state has full discretion over whether and how to provide increases to the SSP portion of the grant. Until 2011, the state had a statutory annual COLA. These COLAs generally reflected whole-grant COLAs. Whole-grant COLAs worked by applying the California Necessity Index (CNI) to the total SSI/SSP grant. If the federal SSI COLA was not enough to increase total SSI/SSP grants to CNI-adjusted levels, then the SSP portion of the grant was increased by the remaining amount. (Despite the state statutory COLA, there were many years prior to 2011 when the COLA was not provided due to budget constraints.) After the Great Recession, SSP grants occasionally were increased by applying the CNI only to the SSP portion of the grant (in 2016-17 and 2021-22). Additionally, while not COLAs, SSP grant increases were provided in 2021-22, 2022-23, and 2023-24. We describe those increases more fully below.
During Great Recession, SSP Grants for Individuals and Couples Were Reduced to Federally Required Minimum. The state is required to maintain SSP monthly grant levels at or above the nominal levels in place in March 1983 ($156.40 for SSP individual grants and $396.20 for SSP couple grants) in order to receive federal Medicaid funding. As shown in Figure 1, during the Great Recession, the state incrementally decreased SSP grants for individuals and couples until they reached these minimum levels in June 2011 and November 2009, respectively.
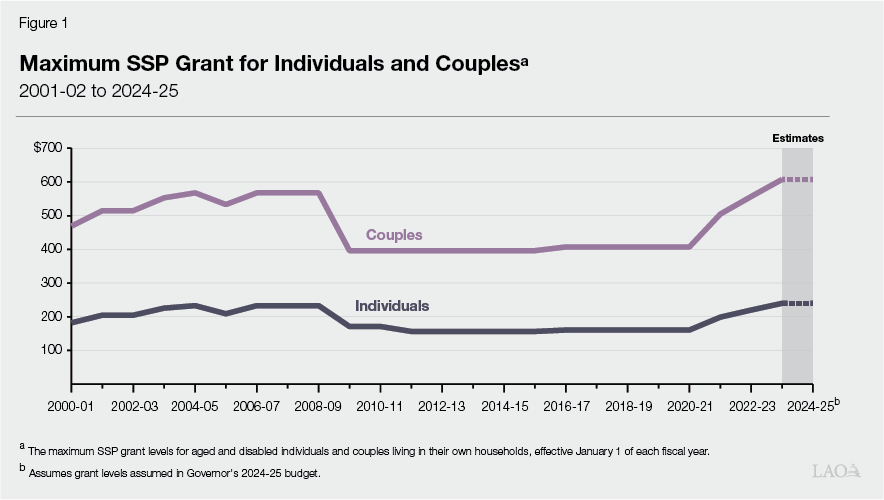
SSP Grants Were Increased in 2016-17, 2021-22, 2022-23, and 2023-24. Since the Great Recession, grants for individuals and couples have been increased four times—in 2016-17 (by 2.76 percent), 2021-22 (by 23.95 percent), 2022-23 (by 10.3 percent), and 2023-24 (by 9.2 percent). The 2021-22, 2022-23, and 2023-24 SSP grant increases were based on specific dollar amounts set in statute. Statute required the Department of Finance to estimate what grant increase could be supported by a half-year cost of $291 million in 2021-22 (estimated to be about $580 million in 2022-23), a half-year cost of $150 million in 2022-23 (estimated to be about $300 million in 2023-24), and a half-year of cost of $146 million in 2023-24 (estimated to be about $292 million in 2024-25). Based on these calculations, SSP grants increased by 23.95 percent on January 1, 2022 (increasing grants by $39 for individuals and $98 for couples), by 10.3 percent on January 1, 2023 (increasing grants by about $21 for individuals and $52 for couples) and by 9.2 percent on January 1, 2024 (increasing grants by about $20 for individuals and $51 for couples).
Governor’s Budget Assumptions
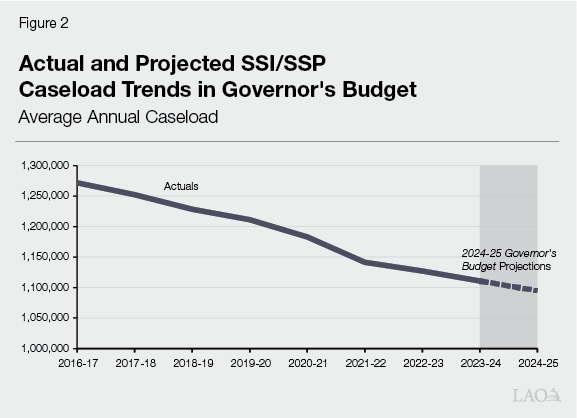
Governor’s January Budget Assumes SSI/SSP Caseload Continues to Decline. The SSI/SSP caseload grew at a rate of less than 1 percent each year between 2011-12 and 2014-15. Beginning in 2015-16, however, SSI/SSP caseload began to decline slowly at an average rate of 1.7 percent each year. As shown in Figure 2, the Governor’s budget projects that caseload will decrease by 1.4 percent in 2023-24 and 1.5 percent in 2024-25, which is in line with past caseload trends. The Department of Social Services recently stated that the primary drivers of this steady caseload decline are (1) overall program attrition from the disabled population and (2) slower caseload growth due to fewer individuals meeting income and asset eligibility thresholds. To further understand these potential drivers, we have reached out to the department to ask for data regarding the average number of applicants, average applicant processing time, most common reasons for applicant denials, and other factors. We will provide further comments at the time of the May Revision if necessary.
Governor’s January Budget Includes Federal SSI COLA Estimates and Holds 2024-25 SSP Grants Unchanged. Figure 3 shows how 2022-23 maximum SSI/SSP grant levels compare to 2023-24 maximum SSI/SSP grant levels and the administration’s estimates of the 2024-25 SSI grant increase. The projected increases to maximum SSI/SSP grant levels in 2024-25 are due to the estimated federal SSI COLA.
Figure 3
SSI/SSP Monthly Maximum Grant Levelsa
|
2022‑23 |
2023‑24 |
2024‑25 |
|
|
Maximum Grant—Individuals |
|||
|
SSI |
$914.00 |
$943.00 |
$966.00 |
|
SSP |
219.73 |
239.94 |
239.94 |
|
Totals |
$1,133.73 |
$1,182.94 |
$1,205.94 |
|
Percent of federal poverty levelb |
93.31% |
94.26% |
92.50% |
|
Maximum Grant—Couples |
|||
|
SSI |
$1,371.00 |
$1,415.00 |
$1,449.00 |
|
SSP |
556.62 |
607.83 |
607.83 |
|
Totals |
$1,927.62 |
$2,022.83 |
$2,056.83 |
|
Percent of federal poverty levelb |
117.30% |
118.76% |
116.24% |
|
aThe maximum monthly grants displayed refer to those for aged and disabled individuals and couples living in their own households, effective as of January 1 of the respective calendar year. bCompares grant level to federal poverty guidelines from the U.S. Department of Health and Human Services for 2023 and 2024. Estimates of federal poverty guidelines for 2025 are based on the LAO Consumer Price Index for All Urban Consumers projection. The 2025 federal poverty guidelines will not be finalized until fall 2025. |
|||
Increase in 2024-25 Driven by Estimated Federal COLA. The Governor’s budget estimates that the federal COLA for the SSI portion of the grant will be 2.4 percent in 2024-25, increasing maximum SSI grants by $23 for individuals and $34 for couples on January 1, 2025 (the actual federal SSI COLA will not be known until fall 2024). The Governor’s budget does not propose any change in the maximum SSP grants for 2025.
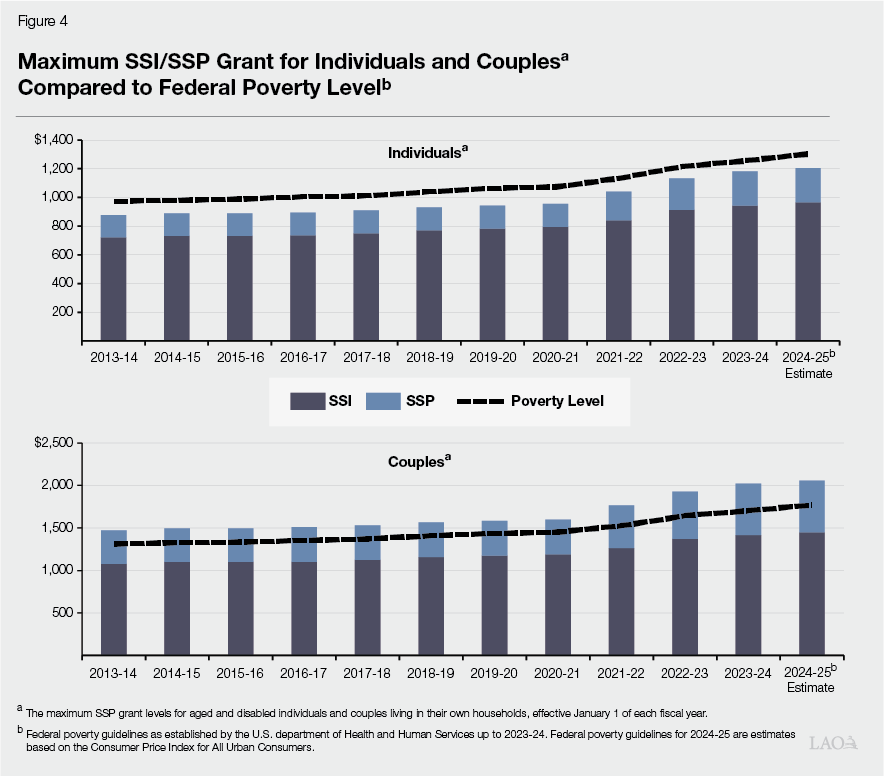
Despite Recent SSI and SSP Grant Increases and Upcoming COLA, Grant Levels Remain Below Federal Poverty Level (FPL) for Individuals. As shown in Figure 4, the maximum combined SSI/SSP monthly grant amount for individuals (the bulk of the SSI/SSP caseload) and couples had been increasing on average by 1.2 percent annually since January 2014—predominantly due to the provision of federal SSI COLAs. In 2022, maximum SSI/SSP grant levels for individuals and couples experienced a more significant increase (an overall increase of 9 percent and 10 percent, respectively) due to the highest in history one-time SSP grant increase (23.95 percent) and a historically high federal SSI COLA (5.9 percent) taking effect on January 1, 2022. Additionally, in 2023, maximum SSI/SSP grant levels for individuals and couples increased again—by about $95 and 9 percent overall for individuals and $162 and 9 percent overall for couples due to a one-time SSP grant increase (10.3 percent) and a higher-than-usual SSI COLA (8.8 percent). In 2024, maximum SSI/SSP grant levels for individuals and couples increased once again—by about $49 and 4.4 percent overall for individuals and $95 and 4.9 percent overall for couples due to a one-time SSP grant increase (9.2 percent) and an SSI COLA (3.2 percent). Despite these most recent grant increases, current maximum SSI/SSP grant levels for individuals remain below the FPL, while grant levels for couples remain above the FPL. Moreover, despite the estimated 2.4 percent federal SSI COLA projected for January 1, 2025, maximum SSI/SSP grant levels for individuals are projected to remain below the FPL in 2024-25.