LAO Contact

February 14, 2023
Comparing CalWORKs Take‑Up Rates
Across Demographic Groups
- Comparing CalWORKs Eligibility Rates by Demographic Groups
- Data Sources for Comparing Populations
- Comparing CalWORKs Take‑Up Rates by Demographic Groups
- Potential Reasons for Different Take‑Up Rates Between Groups
Summary
This is the second in a series of publications estimating the percentage of California Work Opportunity and Responsibility to Kids (CalWORKs)‑eligible families who enroll in the program—otherwise known as the CalWORKs take‑up rate. In the first post, we introduced our methodology for estimating the number of families eligible for CalWORKs since 2005 and compared this to the number who actually enrolled. We found that roughly 60 percent of eligible families enroll in CalWORKs. In this brief, we (1) compare the economic and demographic characteristics of our estimated CalWORKs‑eligible population to those of the overall population of California, and (2) compare the CalWORKs take‑up rates for various demographic and economic groups of eligible families. Generally, we find groups which historically have relatively high poverty rates are both more likely to be eligible for CalWORKs and more likely to enroll than those with relatively low poverty rates. These findings can inform future policy decisions aimed at increasing participation rates in the CalWORKs program.
Comparing CalWORKs Eligibility Rates by Demographic Groups
Two Surveys Provide Most of the Information Used in This Post. Throughout the brief we rely on publicly available survey data to estimate the characteristics of three populations: all Californians, CalWORKs‑eligible Californians, and CalWORKs recipients. The textbox below describes the two surveys used throughout our analysis. Because the COVID‑19 pandemic has affected data collection for one of these surveys (and the state and federal response to the pandemic has affected the availability of other economic supports generally and CalWORKs participation in particular), the most recent year of data we use in this analysis is 2019.
Data Sources for Comparing Populations
Data on California Work Opportunity and Responsibility to Kids (CalWORKs)‑Eligible and Overall Populations Come From the American Community Survey (ACS). As described in our previous post, the ACS surveys a representative sample of more than 2 million households and contains sufficient economic data to allow us to estimate the number of individuals likely eligible for CalWORKs. In this analysis, we use these data to describe the overall California population as well as the population of CalWORKs‑eligible families. The federal Census Bureau reports that COVID‑19 significantly impacted data collection for the ACS in 2020. In addition, the pandemic saw the advent of many temporary supports for low‑income families which may have affected CalWORKs enrollment in both 2020 and 2021. Consequently, the data reported from these years may not be comparable to that collected in prior years. Recognizing this, we will focus on data collected between 2005 and 2019 throughout this brief. We expect these data to best represent the CalWORKs‑eligible and enrolled populations in a “typical” year.
Data on the CalWORKs‑Enrolled Population Come From an Annual Survey of Some Recipients. Federal law requires all states receiving Temporary Assistance for Needy Families funding (TANF, the federal funding source which covers some CalWORKs costs) to report certain demographic and economic data on recipients of that funding annually. In California, these data are collected through the Research and Development Exercise Project (RADEP), which surveys a random sample of approximately 3,000 CalWORKs recipients annually.
Our Two Data Sources Are Not Perfectly Compatible. In some instances, the ACS and RADEP surveys ask slightly different questions about the same general information, requiring us to make some assumptions about how such data can be compared. In addition, the RADEP sample excludes CalWORKs families who do not meet certain eligibility requirements that would qualify the parents to receive TANF dollars. For example, parents which have exceeded the 60‑month federal lifetime limit on TANF assistance are excluded from the RADEP sample (as are their children), even though state law allows children in such families to continue receiving CalWORKs assistance. Overall, the RADEP sample excludes about one‑quarter of all CalWORKs cases. For purposes of this analysis, and due to data limitations, we have assumed these excluded families are sufficiently similar to other CalWORKs families to allow us to draw some general conclusions from the RADEP data. We have validated this assumption by referencing data from prior years, when all CalWORKs cases were included in the RADEP sample. However, if families currently excluded from the RADEP sample are no longer similar to other CalWORKs families, the results of this analysis would be different.
All Estimates Provided in This Post Are Subject to Multiple Levels of Uncertainty. In particular, because we rely on survey data, our estimates are subject to uncertainty regarding how representative these surveys’ samples are of their underlying populations. As is always the case with survey data, this uncertainty is greater when we look at smaller and smaller components of the underlying populations. Consequently, we advise caution in the interpretation of our estimates—in particular, the smaller the population estimated, the more likely our estimates are subject to error. That said, our estimates do provide insight—particularly when comparing across groups—into CalWORKs participation.
We Will Continue to Review and Refine Our Methods as More Data Become Available. We are continuing to engage with knowledgeable stakeholders to refine the methodologies used in this analysis. In particular, we are engaged in ongoing conversations with researchers within the Department of Social Services who are currently conducting some similar analyses. Based on these conversations, and any results produced by the administration, we may revisit some of the estimates presented below at a later date. In addition, we intend to repeat the analyses presented below on future data as it becomes available and report on any major shifts we see.
Some Demographic/Economic Characteristics Reflect Families Overall… The two surveys used for this analysis ask various questions about the attributes of the respondents. In some cases, the questions identify characteristics of the entire family. Examples of family‑level characteristics include a family’s size (how many children it contains) or its composition (whether it is headed by a single mother, single father, two parents, or some other caregiver). Families also can be identified by the collective incomes of their members. The federal definition of poverty is relative to family size, such that a single mother caring for one child while making $18,000 a year would not (in 2019, the year we use for most of our analyses below) be considered impoverished, whereas a single mother making the same amount but caring for two children would be.
…Whereas Others Reflect the Characteristics of Individuals. Other survey questions reflect only the characteristics of an individual. Many families contain members of different races, educational levels, and employment statuses. For example, a family containing both Black and white members cannot accurately be assigned by the survey to a single racial characteristic. Such characteristics, thus, can only accurately describe individuals, rather than families as a whole. Both surveys used for this analysis collect individual‑level information for all members of a household.
This Brief Explores Both Family and Individual‑Level Characteristics. Below, we use one approach when evaluating eligibility and take‑up rates by family‑level characteristics, such as family size, and a different approach when evaluating these rates by individual‑level characteristics, such as race. For family‑level characteristics, we examine the CalWORKs eligibility and take‑up rates of children, as all CalWORKs families contain at least one eligible child but only about half of CalWORKs families contain any eligible adults. (As noted in the box above, parents of otherwise‑eligible children may no longer be eligible for CalWORKs for reasons like reaching the 60‑month time limit. The children of these adults, however, can continue to receive CalWORKs grants.) For individual‑level characteristics, we examine the CalWORKs eligibility and take‑up rates for adults, as adults are ultimately responsible for deciding whether to enroll their families in CalWORKs and thus their characteristics seem most relevant in determining take‑up rates.
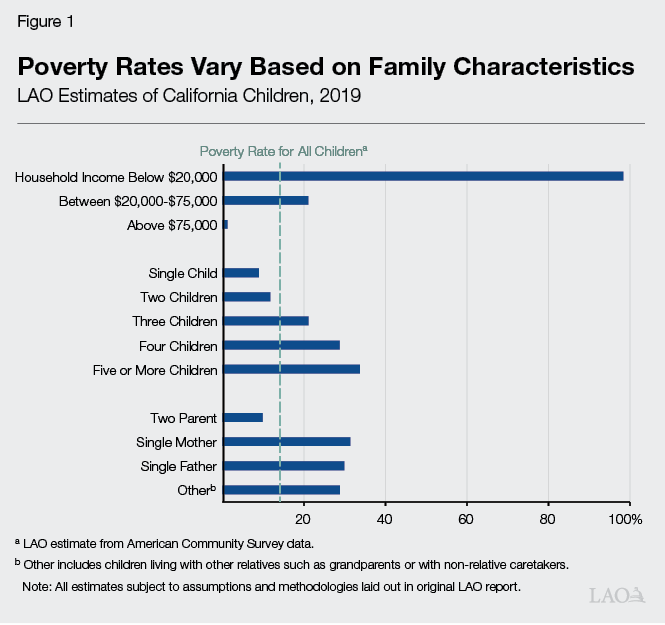
Poverty Rates Vary Based on Family‑Level Characteristics... To qualify for CalWORKs, families generally must earn less than about 80 percent of the federal poverty level. Figure 1 shows our estimates of poverty rates for children by various family characteristics in 2019. Our estimate for the overall poverty rate for California children is shown as a dotted line, whereas the poverty rates for children belonging to specific demographic groups are shown as blue bars. Bars extending beyond the dotted line represent groups with relatively high poverty rates, whereas smaller bars represent groups with relatively low poverty rates. Unsurprisingly, because poverty is defined based on family size and income, poverty rates are strongly correlated with both the number of children and household income. In addition, single‑parent households are far more likely to experience poverty than two‑parent households, although there is little difference between families headed by single mothers and those headed by single fathers.
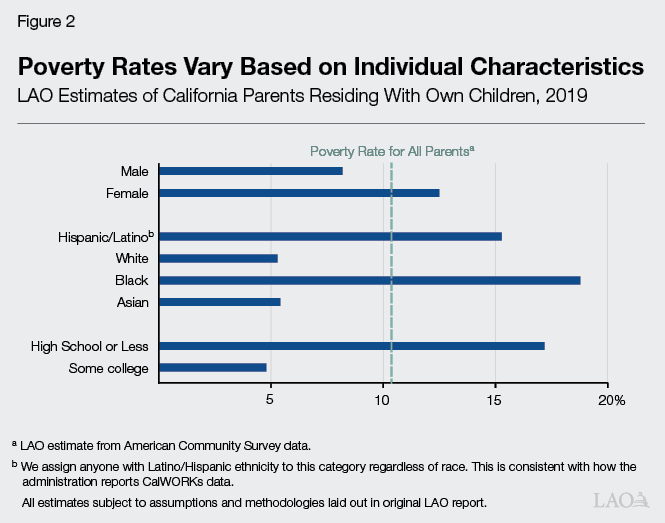
…And Also Based on Individual Characteristics. Figure 2 shows our estimates of poverty rates for parents in select demographic groups in 2019. Our estimate for the overall poverty rate for California parents is shown as a dotted line, whereas the poverty rates for parents belonging to specific demographic groups are shown as blue bars. For example, women had a higher poverty rate than parents as a whole, whereas men had a lower poverty rate. In examining the historical data, we found groups with above‑average poverty rates in 2019 also had above‑average poverty rates in each year since 2005 (when our analysis of CalWORKs take‑up rates begins); the same is true for groups with below‑average poverty rates.
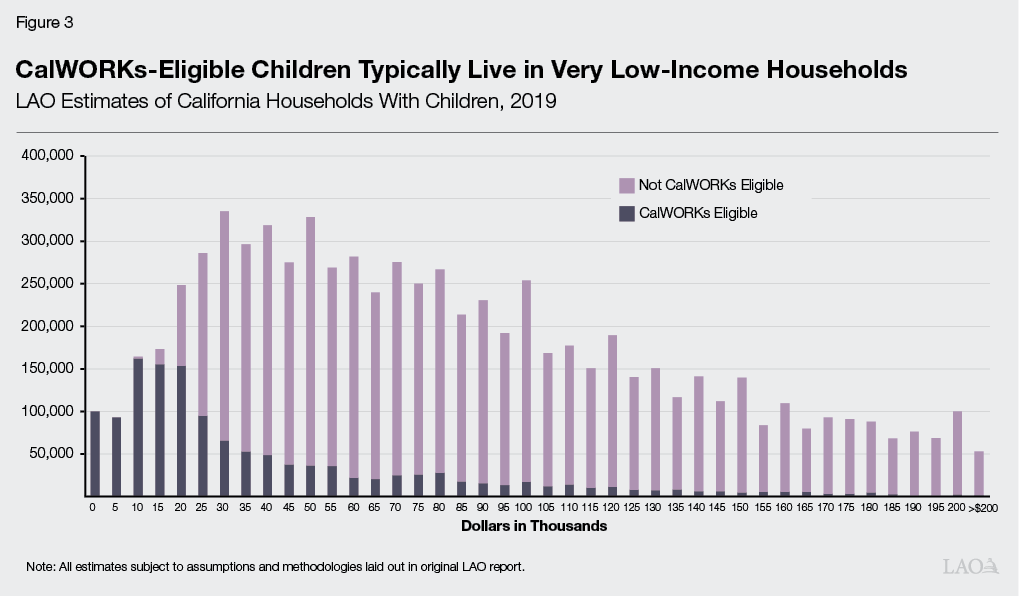
Families Residing in Very Low‑Income Households Are More Likely to Be CalWORKs‑Eligible. CalWORKs eligibility is determined based on family income, not household income. Thus, a multifamily household potentially could include both higher‑income members and also a CalWORKs‑eligible family. Figure 3 shows the distribution of CalWORKs‑eligible children by household income. Unsurprisingly, nearly every child residing in a very‑low‑income household (those making $20,000 or less per year) is likely CalWORKs‑eligible, as are a smaller number of children residing in middle‑ and high‑income households. (Low‑income families cohabiting with higher‑income friends and family present a particular challenge for our estimate of the CalWORKs‑eligible population, as discussed in the nearby box.)
Our Model Does Not Account for Contributions From Friends and Family. As discussed above, some low‑income families live with higher‑income friends or family members. An unemployed single mother, for example, might live with relatives. If this mother were to apply for California Work Opportunity and Responsibility to Kids (CalWORKs), current state regulations likely would require reporting the relatives’ gift of room and board as income. In some cases, such gifts might render this mother or similar applicants ineligible for CalWORKs benefits. (Although these in‑kind contributions count as income for purposes of determining eligibility, they do not affect the size of grants for CalWORKs recipients.) Unfortunately, American Community Survey data do not allow us to easily simulate the effect of these regulations on potential CalWORKs applicants, and thus our eligibility model disregards all income from such gifts. Fully accounting for such gifts would cause some otherwise CalWORKs‑eligible families to be considered ineligible, and this would cause our estimate of all take‑up rates to increase. However, based on our understanding from county administrators and other stakeholders, we understand that applicants very rarely have such gifts applied against their income for eligibility purposes.
CalWORKs‑Eligible Children Are Somewhat More Likely to Reside in Multigenerational Households. Relative to all children in California, we find CalWORKs‑eligible children are somewhat more likely to reside in households including at least one parent and one grandparent. Importantly, the frequency of such multigenerational households differs between demographic groups, with such households being particularly more common amongst Hispanic/Latino and Asian Californians and particularly less common among white Californians. Upon closer inspection of the available data, we believe this in part reflects a larger trend of CalWORKs‑eligible families moving in with relatively higher‑income friends and family.
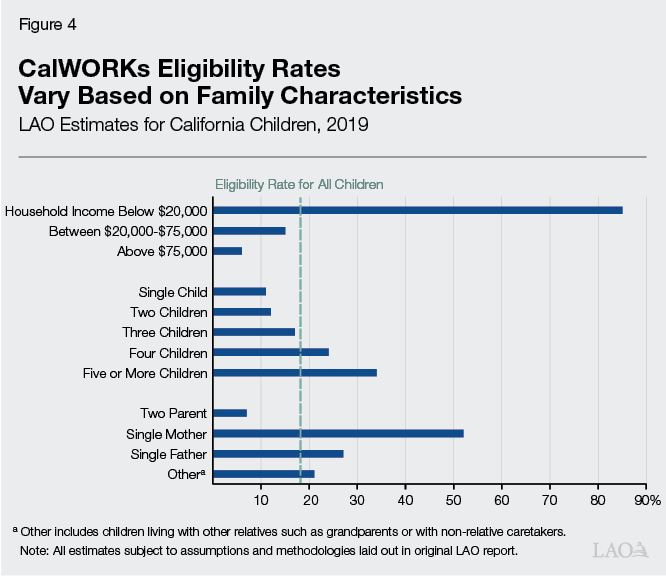
Children From Groups With Relatively High Poverty Rates Are More Likely to Be CalWORKs‑Eligible… Figure 4 summarizes our remaining findings on CalWORKs eligibility by family‑level characteristics. The overall eligibility rate for California children is shown as a dotted line, whereas the eligibility rates for children belonging to specific demographic groups are shown as blue bars. Generally speaking, we find CalWORKs eligibility rates are highest for children residing in low‑income households, and increase alongside the number of children in each household. Combining this information with the information from Figure 1—which identified family characteristics correlated with above‑average rates of poverty—we find larger families and, not surprisingly, families with smaller incomes have both higher poverty rates and higher CalWORKs‑eligibility rates. Notably, however, families headed by a single mother are much more likely to be CalWORKs‑eligible than those headed by a single father despite these families having similar poverty rates. In reviewing the data, this appears to be because families headed by single mothers are about twice as likely to report zero outside income as those headed by single fathers. (Families with two parents have lower rates of both poverty and CalWORKs eligibility.)
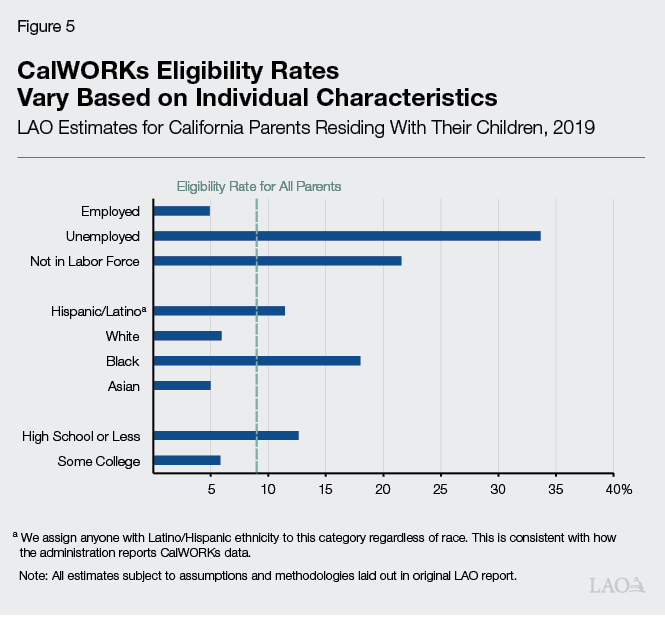
...As Are Parents From Groups With Relatively High Poverty Rates. Figure 5 summarizes our remaining findings on CalWORKs eligibility by individual‑level characteristics. The overall eligibility rate for California parents is shown as a dotted line, whereas the eligibility rates for parents belonging to specific demographic groups are shown as blue bars. Again, combining this information with the information from Figure 2—which identified demographic groups with above‑average rates of poverty—this figure shows that groups which have higher poverty rates also tend to have higher CalWORKs eligibility rates. For example, Black parents are more likely to be CalWORKs eligible than white parents and also experienced a higher poverty rate.
Comparing CalWORKs Take‑Up Rates by Demographic Groups
Take‑Up Rates Differ Between Families, Children, and Parents. In our last post, we estimated the CalWORKs take‑up rate among families at about 60 percent. Our estimates for the take‑up rates of CalWORKs‑eligible children and parents are both lower than this overall take‑up rate. In both cases, these lower take‑up rates suggest smaller families (or, at least, families containing relatively fewer CalWORKs‑eligible parents and children) are relatively more likely to enroll in CalWORKs than larger families. We discuss this finding in more detail in the nearby text box.
Larger Families Are More Likely to Have Outside Income. As noted above, the fact that our estimates for parent and child take‑up rates are below our estimate for family take‑up rates suggests that larger families (or, at least, families with more California Work Opportunity and Responsibility to Kids [CalWORKs]‑eligible parents and children) are less likely to enroll in the program than smaller families. One possible explanation for this is that larger families are more likely to have jobs or other sources of income, and (as we discuss below) families with outside income receive smaller CalWORKs grants. These smaller grants may dissuade some families with outside income from enrolling in the program. Among CalWORKs‑eligible families, we find those with two eligible parents are more likely to report outside income than those with one or zero eligible parents. Similarly, CalWORKs‑eligible families with three or more children are somewhat more likely to report outside income than those with only one or two. Accounting for these differences in outside income explains most of the gap between our estimated take‑up rates for families, parents, and children.
Estimating Parental Eligibility Is Particularly Challenging... Estimating parental eligibility is difficult because many parents are ineligible for CalWORKs due to factors not directly measured by the American Community Survey (ACS). Such factors include immigration status, compliance with CalWORKs programmatic requirements, and lifetime limits on aid. Although we have attempted to account for each of these factors, such adjustments are imperfect. To account for the effect of sanctions and lifetime limits, we used administrative data on CalWORKs‑enrolled families in which only the children are eligible for aid to estimate the corresponding number of ineligible parents. (This reflects about half of CalWORKs families.) This approach has a serious limitation: it cannot account for families that chose to disenroll in CalWORKs after parents were rendered ineligible for aid. Accounting for such families would cause our estimate of parent take‑up rates to increase by an unknown amount. We therefore encourage extra caution in interpreting our estimates of parent take‑up rates, as these are likely to be underestimated.
…But We Believe Comparisons Between Different Groups of Parents Are Still Meaningful. For the purposes of this analysis, we assumed there are no systematic differences in ineligible parents by demographic or economic groups. To the extent this assumption holds true, we can compare the relative eligibility and take‑up rates of parents belonging to different demographic and economic groups. Thus, we can say that groups of parents with estimated take‑up rates below the overall parent take‑up rate are relatively less likely to enroll in the program, and those with higher estimated take‑up rates are relatively more likely to enroll in the program. However, to the extent that there are systematic differences between sanctioned and timed‑out adults and those currently eligible for CalWORKs across different demographic groups, these comparisons are less accurate.
CalWORKs Take‑Up Rates Are Lower for Families With Outside Income. Relative to the take‑up rate for all CalWORKs‑eligible families (60 percent), we estimate the take‑up rate for families reporting no outside income is somewhat higher and those reporting at least some outside income is much lower.
Overall, CalWORKs Take‑Up Rates Are Highest for Groups With Relatively High Poverty Rates… Figure 6 summarizes our estimated take‑up rates for parents across several economic and demographic categories. The overall take‑up rate for CalWORKs‑eligible parents is shown on top. The dotted line provides a reference point to compare the take‑up rate for all parents to take‑up rates for specific demographic groups. For example, we estimate women have a much higher take‑up rate than men. When comparing Figure 6 to Figure 5 (showing relative eligibility rates) above, we find groups with relatively higher eligibility rates also tend to have higher take‑up rates. For instance, Black parents are both more likely to be CalWORKs‑eligible than Asian parents and also have higher take‑up rates. Looking even further back to Figure 2, we find that the groups with relatively high take‑up rates also tend to be groups with relatively high poverty rates. For example, Black parents have higher take‑up and poverty rates than Asian parents.
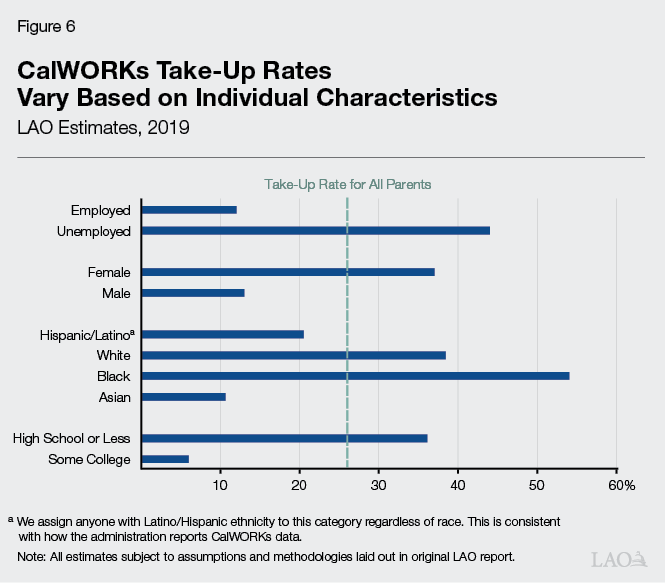
…With the Notable Exception of Hispanic/Latino and White Families. In comparing Figures 2 and 6, we generally find groups with above‑average poverty rates also have above‑average CalWORKs take‑up rates. This is not the case, however, for Hispanic and Latino parents, which have above‑average rates of poverty but below‑average rates of CalWORKs take‑up. Nor is it the case for white parents, which have below‑average rates of poverty but above‑average rates of CalWORKs take‑up. Although there are likely many factors which contribute to these results, one potential reason may be that Hispanic and Latino parents are the most likely to live in multi‑generational households and white parents the least likely (according to our analysis of ACS data), and financial support from other family members could partially substitute for CalWORKs assistance.
Since 2005, CalWORKs Take‑Up Rates Have Decreased Across Almost Every Group. As discussed in our previous post, the overall CalWORKs take‑up rate for families has decreased from about 70 percent in 2005 to about 60 percent in 2019. This decline in participation occurred across nearly all demographic groups. Each of the demographic groups examined above saw a relative decrease in their take‑up rates between 2005 and 2019. The only exception we have found is among parents with more than a high school education, whose take‑up rate increased modestly during this period.
Potential Reasons for Different Take‑Up Rates Between Groups
To Date, Relatively Little Work Has Been Done on Understanding CalWORKs Take‑Up Rates. In preparing this brief, we talked to a broad selection of stakeholders, including county administrative staff, current and former CalWORKs recipients, and groups providing guidance to CalWORKs applicants. Although each of these stakeholders provided valuable insights into how CalWORKs (and, especially, its application process) operates, understandably, none claimed a deep familiarity with the group of most interest to our research: those families who are eligible for the program but choose not to enroll. Unfortunately, because there are few service ties to these families, understanding why they do not enroll in CalWORKs is very difficult. In addition, our review of the relevant social science literature provided few insights.
Despite these challenges, our conversations with stakeholders did yield some insights that could be useful for beginning to understand why families do not enroll. Moreover, our assessment of program characteristics—in combination with this stakeholder information—provide some additional avenues for consideration. Although not a comprehensive list, some possible reasons to explore for take‑up rate differences include:
- Social Networks May Drive Program Awareness. According to our stakeholder interviews, most CalWORKs applicants first hear of the program from family members, neighbors, or colleagues. To the extent people live, work, or associate with others sharing similar economic and demographic characteristics, such word‑of‑mouth could result in “clusters” of people enrolling in the program who share these characteristics.
- For Some, Benefits May Not Be Worth the Effort to Get Them. In most situations, applying for CalWORKs is a multistep process involving relatively complicated paperwork and in‑person interviews. Once enrolled, parents must continue to submit regular reauthorization paperwork and, in many cases, must comply with ongoing work or job‑training requirements. Some parents may feel these requirements are too burdensome and the associated benefits too low to justify enrolling in the program. This seems more likely to be true of parents with outside income, for whom CalWORKs benefits are reduced relative to parents with no outside income. Specifically, a family’s CalWORKs grant is reduced by 50 cents for every $1 above $500 per month they earn. This general cost‑benefit analysis also may explain why families with no eligible parents appear to have higher take‑up rates, as families with no eligible parents are exempt from meeting work or job‑training requirements. As prices for housing, food, and consumer goods increase at a more rapid pace than in recent years, this cost benefit analysis may result in even fewer eligible people deciding it is worth it to apply for benefits.
- Some May Be Relying on Support from Families Rather than CalWORKs Benefits. As we discuss above, some CalWORKs‑eligible families appear to live with relatively higher‑income friends and family members. For at least some of these families, the financial support they receive from social networks is likely serving as an alternative to CalWORKs. To the extent that some groups (for example, Hispanic and Latino or Asian Californians) are more likely to live in multi‑generational households or otherwise cohabit with family or friends, this could help explain why take‑up rates differ between groups.
- Negative Program Perceptions May Discourage Enrollment. Another common thread in our stakeholder interviews is that many CalWORKs applicants are reportedly very reluctant to apply for aid and do so only as a “last resort.” To the extent such attitudes vary between groups, this could explain some differences in take‑up rates between groups.
Better Understanding Differential Take‑Up Rates Could Inform Future Policy Decisions. Policymakers interested in increasing CalWORKs take‑up rates may wish to target policy changes to groups with particularly low take‑up rates. For example, CalWORKs could be made more attractive to families with outside income by allowing these families to earn more without affecting their monthly CalWORKs benefits, or by reducing the amount of paperwork these families have to complete to remain enrolled. Increasing take‑up for specific demographic groups might mean targeted promotional campaigns or re‑branding efforts designed to reduce any potential stigma associated with the program. We note that, as a result of a recent $2 million appropriation, the administration is currently in the very early stages of developing a statewide promotional campaign to increase program utilization. In future posts, we hope to shed further light on the potential efficacy of such strategies.