
May 12, 2021
COVID-19
An Initial Look at Effects of the COVID-19 Pandemic on Local Government Fiscal Condition
- Introduction
- Local Government in California
- Local Governments’ Financial Data
- Revenue Effects of COVID‑19 Pandemic
- Expenditure Effects of COVID‑19 Pandemic
- Federal and State COVID‑19 Pandemic Relief to Local Governments
- LAO Comments
- Conclusion
Executive Summary
In this analysis, we examine what is known about the impacts of the coronavirus disease 2019 (COVID‑19) pandemic’s economic effects on local governments’ fiscal condition. At the time of writing this analysis, the full extent of these effects is not known and will not be known for some time. As such, the purpose of this analysis is not to be a comprehensive assessment of how each local government has been affected by COVID‑19. Instead, this analysis is based on currently available data and provides our initial thoughts on how three types of local governments have been affected by COVID‑19: cities, counties, and independent special districts.
Different Types of Revenues Affected Differently by Pandemic. The COVID‑19 pandemic has been an unprecedented disruption to California’s economy. While the particular experience of each local government likely varies based on its economic drivers, our analysis discusses what we know so far about how key local revenues—property taxes, sales and use taxes, user charges, and transient occupancy (hotel) taxes—have been affected by the pandemic.
- Property tax revenue largely has remained stable.
- Some significant variation, despite overall decline in sales and use tax.
- Some user fee‑based services likely saw revenues decline due to executive orders and public health requirements.
- Significant declines in travel and tourism likely have impacted transient occupancy tax (TOT) revenue.
The impact on local governments’ finances as a result of these revenue changes varies widely because local governments’ reliance on each type of revenue differs.
COVID‑19 Pandemic Has Increased Local Government Costs. Local governments expanded and established new programs and responsibilities in order to directly address the COVID‑19 emergency. In other cases, local governments experienced increased costs from new protocols that allowed them to continue operating existing programs while protecting the public health and the health of employees. Local governments also accrued additional costs as an employer.
Flexible Federal and State COVID‑19 Relief to Local Governments Varied. Federal and state legislation since the onset of the COVID‑19 pandemic has directed flexible funding to cities and counties to address the impacts of the COVID‑19 pandemic. Some local governments have received substantial flexible federal resources while others received less and an entire type of local government—special districts—in most cases received no direct flexible federal assistance. (Some local governments also received federal funding for specific pandemic‑related activities.)
Fiscal Condition of Local Governments Varies. Assessing how the fiscal condition of local governments overall has been affected by the COVID‑19 pandemic with certainty is difficult. In large part, this is because different revenue sources have been impacted differently and local governments’ reliance on these revenue sources varies significantly. The expenditure pressures experienced by local governments also varied. Further, some local governments have received substantial federal resources while others received less or none.
Some Local Governments With Certain Attributes May Benefit From Assistance in the Short Term. Additional actions by the Legislature to address the economic and revenue consequences of this emergency for local governments could be warranted in some cases. However, should the Legislature wish to provide any of the state’s American Rescue Plan (ARP) funds—or other state funds—to assist local governments, we recommend the Legislature consider using a targeted methodology to allocate such funds.
Framework for Assessing Local Governments’ Fiscal Condition. Given the variability of local governments’ fiscal condition, we lay out a framework for the Legislature to use to identify local governments whose fiscal condition most likely has been adversely affected by the pandemic. A local government that falls into more than one of these categories likely has experienced more significant impacts to its fiscal condition.
- Significant reliance on sales tax revenue.
- Significant reliance on TOT revenue.
- Significant reliance on user fee revenue.
- Lower levels of flexible federal funding received to date.
In addition, as the Legislature contemplates how it would assess a local government’s need for additional relief as a result of the COVID‑19 pandemic, we recommend the Legislature consider what additional information it might want to collect as part of the review process. For example, the extent to which a local government provided services with increased demand during the pandemic likely indicates how a local government’s expenditures may have been affected by the pandemic.
Fortunately, Legislature Has Time to Decide How to Appropriate Its Federal Funds. The state has until December 31, 2024 to spend its federal ARP allocation. As such, we recommend the Legislature not allocate all of the ARP funds available to the state as part of its 2021‑22 budget. In the near term, if the Legislature is interested in providing some funding to local governments, it could consider allocating funds to local governments whose fiscal condition have been most clearly negatively impacted—such as special districts that had a direct role in responding to the COVID‑19 pandemic with no access to flexible federal fund relief. The Legislature could develop a more targeted approach to distributing additional assistance in the long term when additional information becomes available about the fiscal pressures on local governments, including how existing federal assistance has offset local revenue declines and expenditure pressures.
Introduction
For more than a year, virtually every aspect of life has been changed dramatically by the coronavirus disease 2019 (COVID‑19) pandemic. In this analysis, we examine what is known about the impacts of COVID‑19’s economic effects on local governments. At the time of writing this analysis, the full extent of these effects is not known and will not be known for some time. As such, the purpose of this analysis is not to be a comprehensive assessment of how each local government has been affected by COVID‑19. Instead, this analysis is based on currently available data and provides our initial assessment on how three types of local governments have been affected by COVID‑19: cities, counties, and independent special districts.
Over the coming weeks, the Legislature will consider its final budget package and how to allocate the state’s most recently received federal assistance and possible budget surplus. To the extent that the Legislature considers allocating a portion of the state’s funds to local governments, this analysis provides initial insights into which local governments might be in better or worse fiscal health in the current phase of the pandemic—allowing the Legislature to be strategic in its allocation. In this analysis, we provide background information on cities, counties, and independent special districts, including a description of when financial data reflecting the effects of the pandemic will be available; discuss what we know so far about how the COVID‑19 pandemic has affected local government revenues and expenditures; and describe the flexible sources of federal and state assistance provided to local governments. We conclude with our comments on local governments’ fiscal condition and our recommendations for the Legislature as it considers what additional assistance, if any, could be reasonable for local governments.
Local Government in California
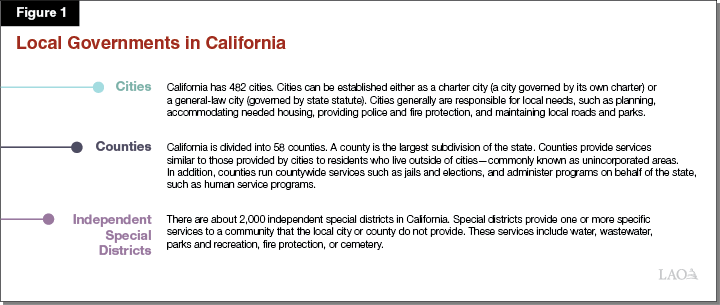
Counties, Cities, Schools, and Special Districts Make Up California’s Local Governments. California is composed of a network of counties, cities, schools, and special districts that collectively are known as local governments. For purposes of this analysis, we focus on counties, cities, and independent special districts (referred to simply as special districts for the remainder of this analysis). (We exclude schools because their funding is determined based on a constitutional formula known as Proposition 98.) In this section, we identify the principal services delivered by cities, counties, and special districts, and describe the key flexible revenue sources these local governments rely on to serve their residents.
Services
Local Governments Provide a Wide Array of Services to Their Communities. Cities, counties, and special districts generally have different responsibilities, and fund and administer different services. We provide an overview of these services in Figure 1.
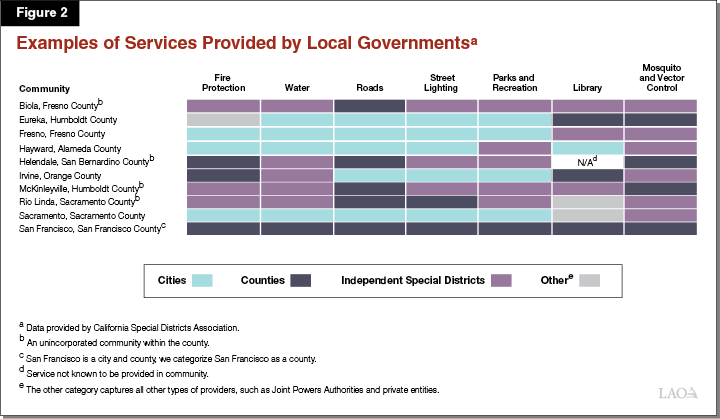
Where you live determines whether a specific service is provided to you by your city, county, or a special district. Figure 2 illustrates how residents in different parts of the state may receive services from different mixes of local governments.
Sources of Funding
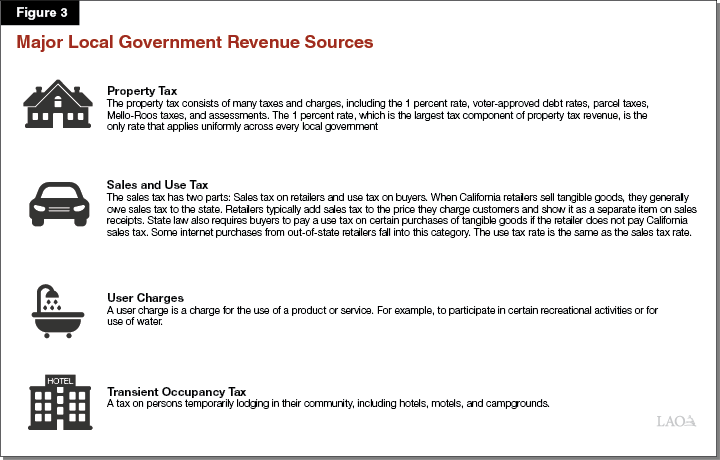
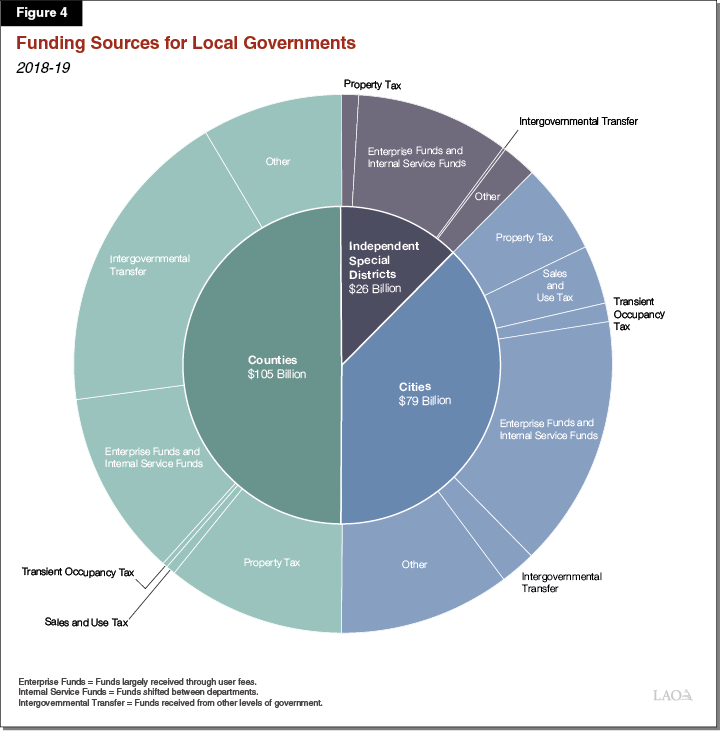
Local Governments Rely on Various Local Revenue Sources to Serve Their Communities. Local revenue sources are the most flexible funding source for cities, counties, and special districts. The largest single local government revenue source is the property tax, followed by local sales taxes. Local governments levy property taxes on property owners—including residential and commercial property—based on the value of their property and collect sales taxes on the retail sale of goods. In addition to these taxes, local governments levy a variety of user charges and fees, and other taxes. Examples include hotel taxes, parking fees, building permit fees, regulatory fees, and judicial fines and penalties. Figure 3 describes these major local government revenue sources and Figure 4 identifies how much local governments rely on each type of revenue source.
Local Governments Rely on Revenue Sources to Different Degrees. The extent to which local governments rely on property tax, sales and use tax, user charges, or transient occupancy tax (TOT) (commonly known as a hotel tax) revenue varies across the state. The next three sections describe some of the reasons for this variation in the major sources of flexible local revenue.
Property Tax
Local Governments’ Property Tax Shares Vary Widely. Property tax revenue remains within the county in which it is collected and is used exclusively by local governments. Proposition 13 (1978) generally caps property taxes at 1 percent of a property’s assessed value. Proposition 13 allows assessed value to increase up to 2 percent per year (assuming the property does not change ownership) and allows voters to authorize some additional assessments. Each local government in a county receives a share of the 1 percent rate based on the property taxes it levied when Proposition 13 passed. As a result, property tax shares vary widely among local governments. For example, while the statewide average share of property taxes among cities is roughly 20 percent, in Los Angeles County alone, cities’ shares range from less than 10 percent to over 30 percent. In addition to the share of property taxes received by a local government, property tax revenues also depend on the assessed value of property within the jurisdiction. Higher assessed values result in more revenue for a given property tax share.
Generally, Counties Rely Heavily on Property Taxes. While counties’ reliance on property tax varies—from 21 percent to 56 percent of total revenues collected locally—the median county received 35 percent of its total revenue collected locally from property taxes in 2018‑19 (the most current year aggregated statewide data is available). For comparison, cities’ reliance on property taxes ranges from 3 percent to 62 percent of total revenues collected locally, however, the median city received 17 percent of its total revenue collected locally from property taxes in 2018‑19. Certain types of special districts—typically those that do not charge a user fee, like fire districts—heavily rely on property taxes.
Sales and Use Tax
Sales Tax Rate Varies Across Local Governments. California’s average sales and use tax rate is roughly 8.5 percent. Most of that rate is dedicated to either the state General Fund or other dedicated purposes, while a portion reflects local sales tax levies that can be used flexibly. Specifically, 1 percent—known as the Bradley‑Burns tax—goes to all cities and counties as a flexible revenue. State law also authorizes local governments to levy optional sales and use taxes known as transactions and use taxes (TUTs). The total TUT rate varies across cities and counties, ranging from 0 percent to 3 percent. Aside from a few minor exceptions, special districts do not receive sales tax revenue.
Generally, Cities Rely More Heavily on Sales and Use Tax Than Counties. Cities received between less than 1 percent and 70 percent of their total revenue collected locally from sales and use taxes in 2018‑19, with the median city receiving 13 percent of its total revenue collected locally from this source. For comparison, the median county received 4 percent of its total revenue collected locally from sales and use taxes, while the county most reliant on sales tax received 18 percent of total revenues collected locally from this source.
User Charges
Some Special Districts Are More Reliant on User Charges to Fund Services. Some special districts, like water and electric utility districts, are almost entirely reliant on user charges to operate. These generally are referred to as enterprise districts. In other cases, user charges may offset a portion of operating a specific program. For example, a local park and recreation department may offset the cost of its yoga classes and sports leagues through fees.
Transient Occupancy Tax
Nearly All Cities and Counties Levy a TOT (Hotel Tax). Nearly all cities and counties impose a TOT on persons temporarily lodging in their community. While most commonly cities and counties levy a 10 percent TOT, the rates range from 4 percent in several cities to 15.5 percent in Palo Alto. Special districts do not levy hotel taxes. Figure 5 shows the local governments in California most reliant on the hotel tax.
Figure 5
Local Governments Most Reliant on TOT Revenue
2018‑19
|
TOT as Share of |
|
|
Mammoth Lakes |
59% |
|
Yountville |
43 |
|
Mariposa County |
37 |
|
South Lake Tahoe |
33 |
|
Dana Point |
33 |
|
Goleta |
32 |
|
Calistoga |
31 |
|
Ojai |
31 |
|
Bishop |
28 |
|
Carmel‑by‑the‑Sea |
28 |
|
Solvang |
25 |
|
Pismo Beach |
25 |
|
Buellton |
24 |
|
Half Moon Bay |
24 |
|
Westlake Village |
23 |
|
Pacific Grove |
20 |
|
Burlingame |
20 |
|
aTotal revenue includes proprietary and governmental funds, excluding intergovernmental fund transfers from the federal, state, or county government. |
|
|
TOT = Transient Occupancy Tax. |
|
Cities Tend to Be More Reliant on TOT Revenue Than Counties. The median city received 1.5 percent of its 2018‑19 local revenues from TOT. For the city most dependent on TOT, these revenues represented 59 percent of 2018‑19 local revenues. In contrast, the median county received 0.5 percent of its 2018‑19 local revenues from TOT. The county most reliant on TOT received 37 percent of its 2018‑19 local revenue from this source. (This particular county, Mariposa, is an exception likely primarily due to the fact that the federal government owns most of the land in Mariposa County. The county cannot levy property taxes on federal land and TOT has become a viable alternative given the significant draw of visitors to Yosemite National Park.) Figure 5 shows that while cities generally are more reliant on TOT revenues than counties, there still is wide variation when it comes to the degree to which local governments rely on TOT revenue as a share of their total revenue.
Other Sources of Funding
Typically, Federal and State Funding Is Dedicated to Specific Purposes. Aside from a few relatively small exceptions, federal and state funding to local governments is provided for specific purposes. For example, the state dedicates funding to counties for the administration of several health and human services programs, like California Work Opportunity and Responsibility to Kids (CalWORKs) and Medi‑Cal. The state also provides funding for a broad range of programmatic activities, for example, in criminal justice, housing and homelessness, and transportation. Similarly, typically funding from the federal government is for dedicated purposes. For example, one of the larger sources of federal funding to local governments, the Community Development Block Grant, is provided to help develop housing and improve economic opportunities. As a result, local governments generally are limited in their ability to use federal and state funding flexibly.
Local Governments’ Financial Data
Lag in Aggregated Reporting of Local Financial Data Creates Limitations. Similar to the state, local governments release Comprehensive Annual Financial Reports annually—reporting their revenues, expenditures, liabilities, and other financial information. Local governments also are required to provide annual reports of their finances—including revenues and expenditures—to the State Controller’s Office (SCO). SCO aggregates and publishes local governments’ financial information in a uniform manner. Currently, SCO has published data through 2018‑19. While it is possible to review individual local governments’ financial information today from 2019‑20, there’s no aggregated data available for 2019‑20. SCO is expected to release aggregated 2019‑20 local government financial information in November 2021. Until that time, while evaluating individual local governments’ finances and assessing how their finances were affected in the early months of the pandemic is possible, without aggregated data, assessing which local governments have been affected the most is not feasible. In the absence of aggregated financial reports, we rely on various other sources and interviews with local government representatives to inform our initial assessment of the effects of the pandemic on local governments’ finances.
SCO Collecting COVID‑19‑Specific Revenue and Expenditure Data Moving Forward. In special reporting instructions, SCO has directed local governments to capture COVID‑19‑related revenue and expenditure effects in their financial reporting going forward. This information first will be included in local governments’ 2019‑20 financial reports, expected to be released by SCO in November 2021. This information will provide greater insight and facilitate legislative oversight on how local governments used federal and state aid to respond to the COVID‑19 emergency and inform what financial pressures persist for local governments.
Revenue Effects of COVID‑19 Pandemic
COVID‑19 Pandemic Rapidly Changed Economic Situation. While the particular experience of a local government varies based on its economic drivers, generally, the COVID‑19 pandemic has been an unprecedented disruption to California’s economy. In spring 2020, the economy abruptly ground to a halt: millions of Californians lost their jobs, businesses closed, and consumers deeply curtailed spending. Almost as quickly, Californians began to adjust to the realities of the pandemic. With this adjustment, and accompanying major federal actions to support the economy, came a rapid rebound in economic activity over the summer of 2020. However, some of this economic recovery was mitigated by a surge in COVID‑19 cases in winter 2020 that disrupted economic activity. While the recent reduction in cases and the administration of COVID‑19 vaccines has spurred more economic activity, the recovery has been incomplete and uneven. Many low‑wage, less‑educated workers remain out of work. Meanwhile, relatively few high‑wage, highly educated workers faced job losses during the pandemic. Certain sectors—such as leisure and hospitality—remain depressed, while others—such as technology—remain strong. In this section of the analysis, we discuss what we know so far about how the property tax and sales tax (the largest discretionary revenue sources for local governments) and user charges and hotel taxes (revenue sources more likely to be affected by behavioral changes caused by the COVID‑19 emergency) have been affected by the pandemic.
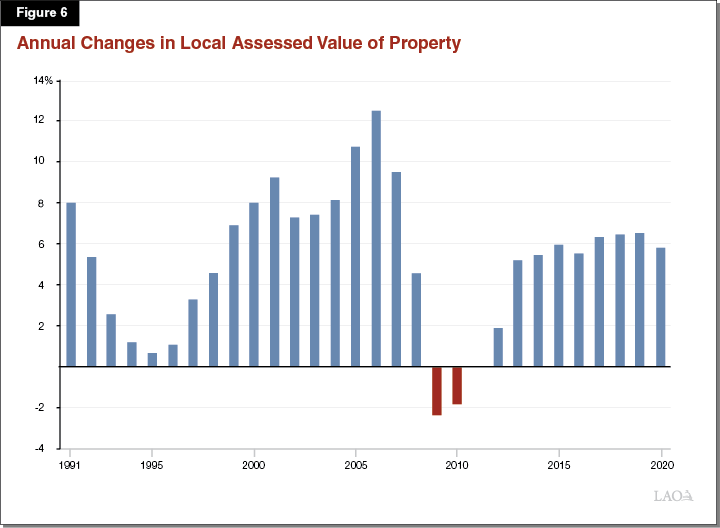
Property Tax Revenue Has Remained Largely Stable. The property tax is a county administered tax. As such, the state does not have complete and accurate data on property tax revenue collected by local governments until it is reported by local governments and compiled and published by state agencies. However, data on the assessed value of property is more readily available and can serve as a proxy to understand changes in property tax revenues before they are published. Figure 6 depicts the annual change in assessed property value from 1991 to 2020. While the dot‑com bust of the early 2000s and the Great Recession (2007 through 2009) and related housing bubble bust resulted in sudden and significant slowing and declines in assessed value, the COVID‑19 emergency appears—at least so far—to have had a more limited effect on the assessed value of property. The state’s housing markets, which slowed briefly in the early months of the pandemic, have seen robust activity over the past several months. We anticipate this trend will continue into 2021, with relatively rapid home price growth, low interest rates reducing the cost of purchasing a home, and a return to normal levels of home building activity, which would help maintain property tax revenue growth. Conversely, the pandemic caused notable slowdowns in commercial property markets, which have yet to recover. Should these slowdowns persist, they could counteract booming housing markets and put downward pressure on property tax revenues, especially in jurisdictions with high concentrations of offices, hotels, and retail properties. Overall, we anticipate that statewide property tax revenues will remain stable moving forward, but outcomes likely will be uneven across jurisdictions.
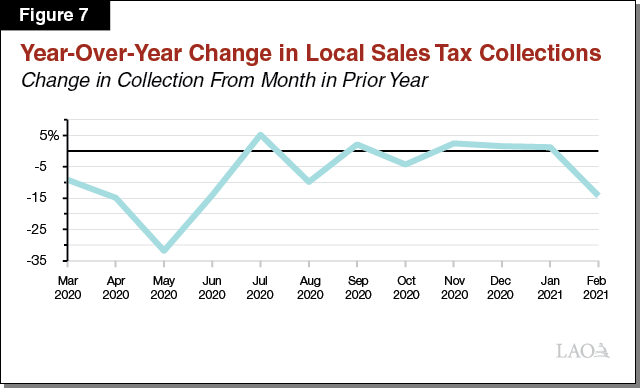
Overall Decline in Sales and Use Tax Revenue. The sales tax is administered by the state, and the California Department of Tax and Fee Administration posts on its website monthly sales tax collection data for local governments. As Figure 7 shows, between March 2020 and February 2021, local sales tax collections declined in 7 of the 12 months, with the largest decline occurring in May 2020. As compared with the Great Recession, the decline was narrowly concentrated in time and the recovery was much faster during the COVID‑19 pandemic. Overall, current estimates indicate that local sales tax revenue declined 3.5 percent from $7.3 billion in 2018‑19 to $7 billion in 2019‑20 statewide. We estimate that the decline in sales tax revenue collections between March 2020 and February 2021 likely resulted in roughly 65 percent of city governments across the state experiencing some amount of revenue loss during that time period. For the remainder of 2020‑21, however, we anticipate a notable rebound in sales tax collections, pushing total collections in 2020‑21 somewhat above pre‑pandemic levels.
Increased Sales and Use Tax Revenue for Select Local Governments. Despite overall declines in sales and use tax revenue, some local governments have seen significant growth in this revenue source during the pandemic. How sales and use tax revenue has changed for a particular local government depends on its tax base and complex allocation rules that dictate which local government receives sales and use tax revenue—generally based on where a purchase is made. Without an individualized analysis of the sales and use tax in a particular community, determining what drove this variation or the effect the change has on a particular community’s overall revenues is difficult. However, we can make general observations about some known key drivers for this variation. For example, communities that have a large online distribution facility—like Dinuba in Tulare County— experienced growth in sales and use tax revenues during the pandemic, while communities that rely on fuels—like Aliso Viejo in Orange County—for their sale tax revenue experienced greater declines in sales tax revenue, as driving declined during the pandemic. In addition, by adjusting for the fact that some cities rely more heavily on the sales tax for their overall revenues than others, we can get a slightly better sense of the cities that are most affected by the changes in their sales and use tax collection. In most cases, the cities with the largest percent change (positive or negative) in sales and use tax collection do not appear to rely on sales tax as heavily as other cities. For example, the City of Rolling Hills has seen their sales and use tax revenue increase by nearly 400 percent during the pandemic. However, the sales and use tax only accounts for about 1 percent of that city’s discretionary revenue. As a result, taken in isolation, the increase in sales and use tax revenue likely has little effect on Rolling Hills’ overall fiscal condition. Figure 8 shows the cities whose sales tax revenue likely has been most affected—both positively and negatively—by the pandemic. The stark variation in revenue impacts among cities during the pandemic highlights that drawing broad conclusions based on statewide observations of increases and decreases in the sales tax paints an incomplete picture.
Figure 8
Cities Likely Most Affected by Declines and
Rises in Sales and Use Taxa
|
Change in |
Estimated Effect |
|
|
Aliso Viejo |
‑54.0% |
‑13.3% |
|
Commerce |
‑21.4 |
‑8.2 |
|
Costa Mesa |
‑17.0 |
‑6.7 |
|
Corte Madera |
‑19.6 |
‑6.5 |
|
Tulelake |
‑49.5 |
‑5.6 |
|
Artesia |
‑21.8 |
‑5.5 |
|
Auburn |
‑22.4 |
‑5.4 |
|
Monterey |
‑42.5 |
‑5.3 |
|
Los Gatos |
‑30.9 |
‑5.2 |
|
Dixon |
‑19.0 |
‑5.0 |
|
Farmersville |
51.0 |
4.0 |
|
Cotati |
11.0 |
4.1 |
|
Yreka City |
18.0 |
4.5 |
|
Trinidad |
17.0 |
4.6 |
|
Rio Dell |
45.0 |
5.3 |
|
Angels Camp |
24.0 |
7.0 |
|
Westmorland |
103.0 |
8.4 |
|
Cupertino |
41.0 |
9.7 |
|
Jurupa Valley |
67.0 |
21.7 |
|
Dinuba |
135.0 |
21.8 |
|
aCities That Rely on Sales and Use Tax With Largest Losses and Gains in Sales Tax Collection 12 Months Before and After March 2019 (Comparing March 2019‑February 2020 and March 2020‑February 2021 Collections). |
||
Some Special Districts Likely Saw Revenues Decline Due to Executive Orders and Public Health Requirements. Some special districts, like water, wastewater, and electricity districts, derive most of their revenue from user charges, meaning delayed payments result in immediate budget losses for those agencies. In an effort to protect public health, the Governor issued Executive Order N‑42‑20 that prohibits water shutoffs during the pandemic despite nonpayment. As a result, water agencies likely have significant revenue declines. Based on a survey from the State Water Resources Control Board, water agencies statewide had outstanding payments of over $1 billion as of January 2021, some of which is directly related to the COVID‑19 pandemic. Other local governments and state regulatory entities also have issued shutoff prohibitions for electric utility agencies. Similarly, user fees make up about one‑third of total revenues for park and recreation districts on average. This portion of revenue—earned from facility rentals, indoor park district programs/classes, and other similar operations—was virtually eliminated for much of the past year due to public health orders.
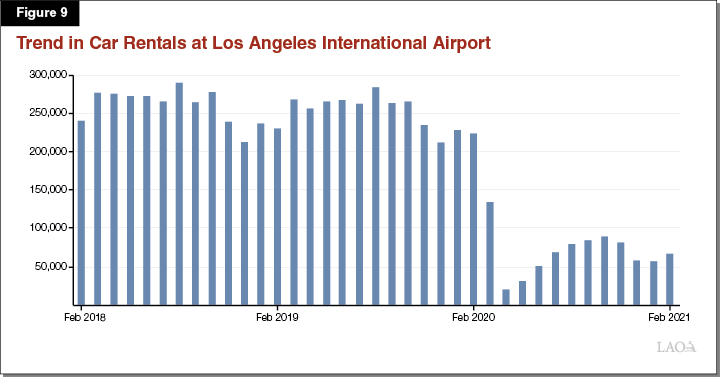
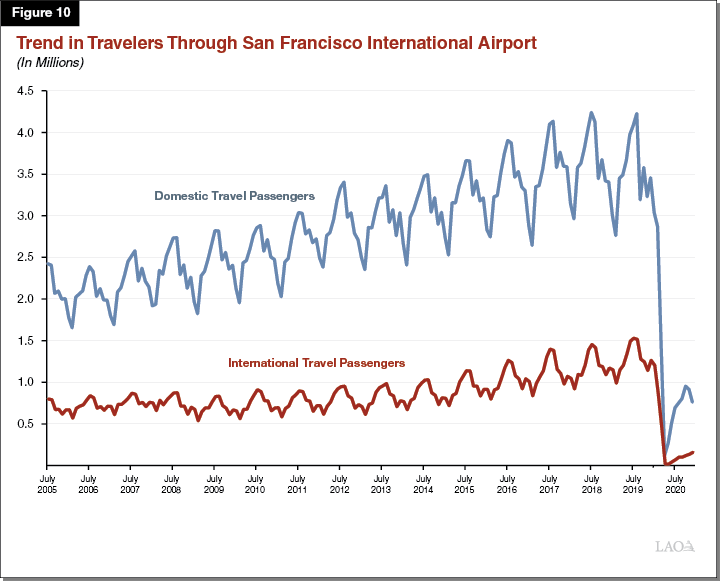
Significant Declines in Travel and Tourism Likely Have Impacted TOT Revenue. TOT is acutely affected by changes in tourism and travel. While TOT is a locally administered tax and aggregated data on how COVID‑19 has affected revenue collection will not be available until SCO publishes 2019‑20 and 2020‑21 financial data for local governments, changes in travel patterns indicate TOT revenue likely has been severely depressed by the COVID‑19 emergency. Figures 9 and 10 illustrate how car rentals at Los Angeles International Airport and passenger volumes at San Francisco International Airport have plummeted since the onset of the pandemic and remain below pre‑pandemic levels. Local governments who rely on tourism or business travel for both TOT and sales and use tax revenue likely have seen larger overall revenue declines. For example, cities with convention centers or other local governments with large annual events, such as the Coachella Valley Music and Arts Festival, likely have experienced this compounding effect.
Expenditure Effects of COVID‑19 Pandemic
Our analysis of revenues relies on various data sources along with interviews with local government representatives to develop an initial assessment of how the COVID‑19 pandemic has affected local government revenues. However, our discussion of how the COVID‑19 pandemic has affected expenditures largely is based on interviews with local government representatives. This is because there are limited suitable alternatives to SCO’s published data on local government expenditures.
COVID‑19 Pandemic Has Increased Local Government Costs as a Service Provider. Local governments expanded and established new programs and responsibilities in order to directly address the COVID‑19 emergency. For example, California’s 61 local health jurisdictions—counties and three cities—are responsible for local public health. Since the onset of the pandemic, these local health jurisdictions have expanded services to conduct contact tracing, manage testing, coordinate vaccination, and coordinate communication and response efforts in their jurisdictions during the COVID‑19 emergency. While significant federal funding was provided for these purposes, local health jurisdictions may have incurred costs above the amounts provided. For example, in some cases, local governments have had to increase peace officer presence at vaccine distribution centers for enhanced security. As another example, some communities established childcare centers for essential employees.
In other cases, local governments had to find new ways to safely operate and administer existing programs. In these cases, local governments experienced increased costs from new protocols that allowed them to continue operation while protecting the public health and the health of employees. For example, local governments purchased and deployed personal protective equipment for use during the pandemic. Facilities that remained open to the public required regular cleaning and sanitization. Additionally, some local governments reoriented essential staff into groups or pods, such that different shifts would work at different times or different weeks in order to reduce the chance of an outbreak affecting services. Some special districts reported housing certain essential workers on site or carrying out other isolation measures to prevent staff from falling ill and disrupting services. All of these precautionary measures—taken to ensure key functions such as fire, health, and water services kept functioning—came at increased cost due to overtime and other expenses. In other cases, local governments incurred costs in order to provide services virtually, such as ensuring remote access to public meetings.
COVID‑19 Pandemic Has Increased Local Government Costs as an Employer. While some local governments have minimal staffing, local government in aggregate is a major employer in the state. For example, the U.S. Census reports that local governments (the broad definition of the term, including counties, cities, school districts, and special districts) in California employed nearly 1.5 million full‑time‑equivalent employees in 2019. Local governments have been required to provide workers’ compensation, paid sick leave, and family medical leave to employees during the pandemic. If employees were required to take leave—for example, to comply with public health quarantine or isolation directives—local governments may have incurred overtime to pay for employees to cover absent staff’s shifts. In addition to payroll costs, many local governments incurred equipment costs related to their workforces as they had to purchase and deploy new technology to enable staff to shift to remote work while continuing to meet their responsibilities to the public.
Local Governments Have Decreased Some Services to Reduce Costs in Response to COVID‑19 Pandemic. Similar to the state, local governments developed and adopted their 2020‑21 budgets in the weeks following the onset of the COVID‑19 emergency. Due to the significant uncertainty at the time and the potential for truly dire outcomes, local governments largely assumed they would incur significant budget problems. Local governments adopted budget actions to address their anticipated serious budget problems. For example, some local governments reduced some services, held positions vacant, and implemented layoffs or furloughed employees. In other cases, local governments sought to reduce costs by deferring or canceling scheduled infrastructure and maintenance projects and purchases of vehicles or other major equipment. Despite these cost saving efforts, local governments overall indicate that the heightened fiscal pressures—declining revenues and increasing expenditures—outweighed the magnitude of these solutions. That being said, because of the dramatic and broad range of local government experience throughout the pandemic, the severity of these budgetary pressures may vary across local governments.
Federal and State COVID‑19 Pandemic Relief to Local Governments
Recent federal and state legislation directed funding to local governments to aid in their response to the COVID‑19 emergency. In this section, we describe the major state and federal sources of funding that could mitigate some of the potential budgetary strain created by the COVID‑19 pandemic that we described earlier. In particular, we describe discretionary resources provided to local governments. Funding provided for specific purposes—like testing and vaccine distribution—are not included. Figure 11 provides a summary of the major sources of flexible federal relief funding to the state and local governments.
Figure 11
Flexible Federal COVID‑19 Funding to
State and Local Governmentsa,b
(In Billions)
|
Coronavirus |
Local Fiscal |
Total |
|
|
State |
$7.7 |
$27.0 |
$34.7 |
|
Counties |
5.8 |
8.1 |
13.9 |
|
Cities |
1.8 |
7.8 |
9.6 |
|
Special Districts |
— |
— |
— |
|
Totals |
$15.3 |
$42.9 |
$58.2 |
|
aDoes not include federal funds directly provided to local governments for specific purposes. bSan Francisco is categorized as a county. cAccounts for Coronavirus Relief Fund money allocated directly from the federal government and allocations from the state to local governments. |
|||
|
COVID‑19 = coronavirus disease 2019. |
|||
The Coronavirus Aid, Relief, and Economic Security (CARES) Act
Coronavirus Relief Fund (CRF). The CARES Act (H.R. 748), which was signed into law on March 27, 2020, established CRF to provide $150 billion to state, local, tribal, and territorial governments for “necessary expenditures incurred due to the public health emergency with respect to the Coronavirus Disease 2019” between March 1 and December 30, 2020. (Subsequent federal Legislation allowed eligible jurisdictions to use CRF allocations through December 31, 2021.) The fund set aside $139 billion for states based on their estimated populations as of July 1, 2019. (Tribal and territorial governments were eligible for the remaining $11 billion.) The U.S. Department of the Treasury (Treasury), which is responsible for administering the CRF, determined that California was eligible for $15.3 billion from the CRF to be shared between the state and local governments, which generally reflects the state’s share of the national population. Below, we describe the CRF allocations to local governments.
- Direct Federal Assistance to Cities, Counties, and the State. Cities and counties in California with populations greater than 500,000 were eligible for CRF directly from the federal government. These cities and counties drew funding from the CRF allocation set aside for California in proportion to their population. In all, 16 counties and 5 cities received a combined $5.8 billion in CRF allocations directly from the federal government. As a result, California’s state government received the remaining $9.5 billion from the CRF available to the state.
- Indirect Federal Assistance to Cities and Counties. The state’s 2020‑21 budget allocated a portion of the state’s $9.5 billion CRF to local governments: $1.3 billion to counties and $500 million to cities to be used toward homelessness, public health, public safety, and other services to combat the COVID‑19 pandemic. For cities, 45 percent of the available funding was distributed to cities with populations between 300,000 and 500,000 as a share of their respective population. (Cities that received a direct CRF allocation from the federal government did not receive additional state allocations.) The remaining 55 percent generally was allocated to cities with populations below 300,000 as a share of their respective populations. The portion of the state’s CRF allocation that the budget allocated to counties ($1.3 billion) went to all counties, generally as a proportion of their population. Therefore, counties with populations above 500,000 received both direct and indirect CRF allocations. Cities and counties are required to comply with the state’s public health orders to receive the funding.
Uses and Restrictions of CRF Allocations. In addition to requiring that the CRF allocations be used towards responding to the pandemic, the federal legislation prohibits the use of CRF funds for costs approved in the most recent budget. Therefore, CRF allocations cannot be used to backfill previously anticipated expenditures or declines in anticipated revenue.
Special Districts Largely Did Not Receive CARES Act Funding. While some special district hospitals, transit, and airport facilities did receive industry‑specific federal COVID‑19 financial assistance, it generally was limited. In addition, special districts did not receive any flexible CRF allocations. Further, special district economic impacts were not mitigated through local action either, with one primary exception. While many counties and cities in California chose to establish grant programs for small businesses and nonprofits, only Kern County established such a program for special districts. Kern County established a $2 million grant program using its CRF allocation for special districts operating within the county.
The American Rescue Plan (ARP)
Coronavirus Local Fiscal Recovery Fund. The ARP (H.R. 1319), which was signed into law on March 11, 2021, included $350 billion in funding to state and local governments for fiscal recovery. According to recently released Treasury documents, California is eligible for $42.9 billion in fiscal recovery funds from ARP to be shared between the state and local governments. Cities and counties will directly receive $15.9 billion in fiscal recovery funds. Unlike CRF, all cities and counties will receive an allocation from the local fiscal recovery fund, regardless of population. The federal government will distribute funds directly to all counties and cities with populations greater than 50,000 based on a modified Community Development Block Grant (CDBG) formula. For cities with a population below 50,000, the state is required to allocate the funds ($1.2 billion), generally based on each small city’s share of the state’s total population. (For purposes of estimating how the funds are distributed across small cities in this analysis, we rely on estimates from the Federal Fund Information for States.) Treasury anticipates allocating $8.1 billion to California counties (including all funds allocated to the City and County of San Francisco), and $7.8 billion to California cities, including the set aside for small cities.
Uses and Restrictions of Local Fiscal Recovery Funds. Both the state and local governments can use the funds for only specific purposes: (1) to respond to the public health emergency or negative economic impacts associated with the emergency; (2) to support essential work; (3) to backfill a reduction in revenue that has occurred since 2018‑19; or (4) for water, sewer, or broadband infrastructure. State and local governments have until December 31, 2024 to use the funds. State and local governments are prohibited from using the funds to make payments towards employee pension benefits above what is actuarially required—something referred to as a supplemental pension payment. The state cannot use the funds to offset directly or indirectly a reduction in the net tax revenue of the state through a change in law, regulation, or administrative interpretation. We are reviewing recently released Treasury guidance with more specifics on how the federal administration interprets the statutory language in ARP. That guidance is important to our understanding of how local governments can spend the funds—for example, what purposes will be allowable or prohibited—and how some of the specific restrictions will work.
CARES Act and ARP Funding Combined
Federal Relief Allocations Vary Across the State. Figure 12 provides a heat map of per capita CRF and local fiscal recovery fund allocations to local governments by county, while Figures 13 and 14 provide tables of federal relief allocations to counties and the state’s largest cities, respectively. As these figures display, the amount of federal relief varies across the state’s cities and counties.
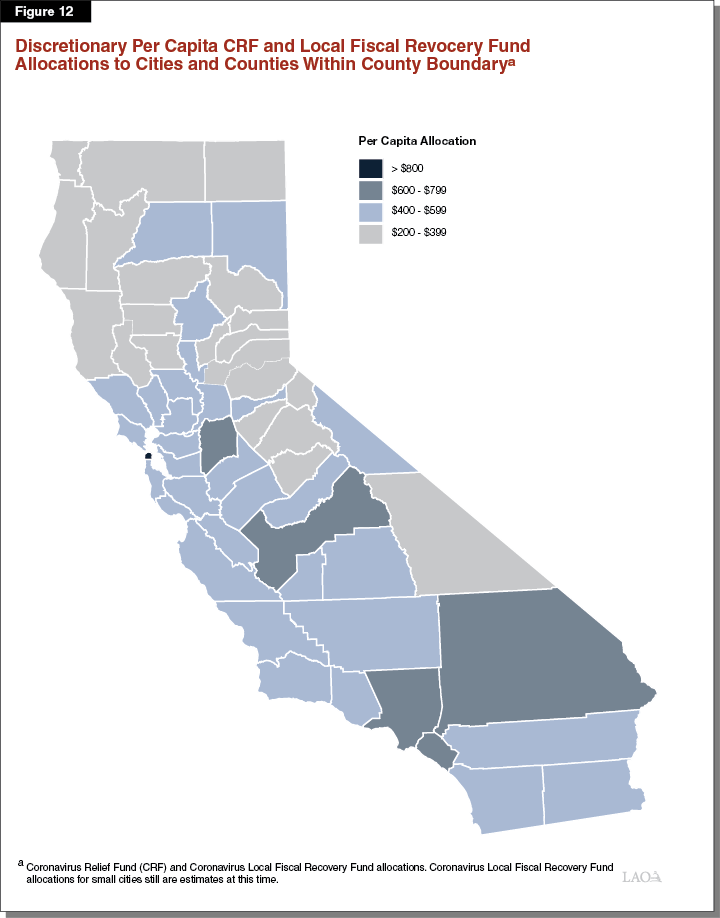
Figure 13
Discretionary Federal COVID‑19 Funding to Counties
(In Millions)
|
County |
CRFa |
Local Fiscal Recovery Fund |
Total Federal Funds |
County |
CRFa |
Local Fiscal Recovery Fund |
Total Federal Funds |
|
|
Alameda |
$330.0 |
$324,6 |
$654.7 |
Orange |
$627.6 |
$616.84 |
$1,244.5 |
|
|
Alpine |
0.1 |
0.2 |
0.3 |
Placer |
41.2 |
77.4 |
118.5 |
|
|
Amador |
3.8 |
7.7 |
11.6 |
Plumas |
1.9 |
3.7 |
5.5 |
|
|
Butte |
21.4 |
42.6 |
64.0 |
Riverside |
487.3 |
479.9 |
967.2 |
|
|
Calaveras |
4.6 |
8.9 |
13.5 |
Sacramento |
206.2 |
301.5 |
507.7 |
|
|
Colusa |
2.2 |
4.2 |
6.4 |
San Benito |
6.4 |
12.2 |
18.6 |
|
|
Contra Costa |
227.8 |
224.1 |
451.9 |
San Bernardino |
430.6 |
423.5 |
854.0 |
|
|
Del Norte |
2.8 |
5.4 |
8.2 |
San Diego |
387.8 |
648.4 |
1,036.2 |
|
|
El Dorado |
19.7 |
37.5 |
57.2 |
San Francisco |
174.5 |
624.8 |
799.3 |
|
|
Fresno |
98.0 |
194.1 |
292.1 |
San Joaquin |
150.8 |
148.0 |
298.8 |
|
|
Glenn |
3.0 |
5.5 |
8.5 |
San Luis Obispo |
28.3 |
55.0 |
83.3 |
|
|
Humboldt |
13.6 |
26.3 |
39.9 |
San Mateo |
151.6 |
148.9 |
300.5 |
|
|
Imperial |
19.2 |
35.2 |
54.4 |
Santa Barbara |
46.1 |
86.7 |
132.8 |
|
|
Inyo |
1.9 |
3.5 |
5.4 |
Santa Clara |
189.6 |
374.5 |
564.1 |
|
|
Kern |
178.2 |
174.9 |
353.0 |
Santa Cruz |
27.7 |
53.1 |
80.7 |
|
|
Kings |
15.7 |
29.7 |
45.4 |
Shasta |
18.2 |
35.0 |
53.1 |
|
|
Lake |
6.5 |
12.5 |
19.0 |
Sierra |
0.3 |
0.6 |
0.9 |
|
|
Lassen |
2.9 |
5.9 |
8.9 |
Siskiyou |
4.5 |
8.5 |
13.0 |
|
|
Los Angeles |
1,220.7 |
1,950.0 |
3,170.7 |
Solano |
44.9 |
86.9 |
131.8 |
|
|
Madera |
16.1 |
30.6 |
46.7 |
Sonoma |
50.3 |
96.0 |
146.3 |
|
|
Marin |
26.6 |
50.3 |
76.9 |
Stanislaus |
108.9 |
107.0 |
215.9 |
|
|
Mariposa |
1.8 |
3.3 |
5.2 |
Sutter |
10.3 |
18.8 |
29.1 |
|
|
Mendocino |
9.0 |
16.8 |
25.8 |
Tehama |
6.6 |
12.6 |
19.3 |
|
|
Merced |
28.9 |
53.9 |
82.8 |
Trinity |
1.4 |
2.4 |
3.8 |
|
|
Modoc |
1.0 |
1.7 |
2.7 |
Tulare |
48.9 |
90.6 |
139.5 |
|
|
Mono |
1.4 |
2.8 |
4.2 |
Tuolumne |
5.6 |
10.6 |
16.2 |
|
|
Monterey |
45.0 |
84.3 |
129.3 |
Ventura |
167.0 |
164.3 |
331.3 |
|
|
Napa |
14.2 |
26.8 |
40.9 |
Yolo |
22.6 |
42.8 |
65.4 |
|
|
Nevada |
10.0 |
19.4 |
29.4 |
Yuba |
8.0 |
15.3 |
23.3 |
|
|
aIncludes CRF funds that the state allocated to local governments. |
||||||||
|
COVID‑19 = coronavirus disease 2019 and CRF = Coronavirus Relief Fund. |
||||||||
Figure 14
Discretionary Federal COVID‑19 Funding to Cities
(In Millions)
|
City |
CRFa |
Local Fiscal |
Total |
|
Los Angeles |
$694.4 |
$1,278.9 |
$1,973.3 |
|
San Diego |
248.5 |
299.7 |
548.2 |
|
San Jose |
178.3 |
212.3 |
390.6 |
|
Fresno |
92.8 |
170.8 |
263.6 |
|
Sacramento |
89.6 |
112.3 |
201.9 |
|
Long Beach |
40.3 |
135.8 |
176.0 |
|
Oakland |
37.0 |
188.1 |
225.1 |
|
Bakersfield |
33.5 |
94.5 |
128.0 |
|
Anaheim |
30.5 |
106.6 |
137.1 |
|
Santa Ana |
28.6 |
128.4 |
156.9 |
|
Riverside |
28.0 |
73.5 |
101.5 |
|
Stockton |
27.2 |
78.1 |
105.2 |
|
Irvine |
3.5 |
56.4 |
59.9 |
|
Chula Vista |
3.4 |
57.5 |
60.9 |
|
Fremont |
2.9 |
44.2 |
47.1 |
|
aIncludes CRF funds that the state allocated to local governments. |
|||
|
COVID‑19 = coronavirus disease 2019 and CRF = Coronavirus Relief Fund. |
|||
Substantial Variation in Federal Funding as a Share of City and County Budgets. We compared the amount of federal funding received from CRF and ARP to each city and county’s total locally collected revenue in 2018‑19—the last available year in which we have aggregated data before the pandemic affected revenues. Across all cities and counties, the median amount of federal funds received represents about 15 percent of their total 2018‑19 local revenues, while the average was 17 percent. However, there was substantially more variation in the level of federal funding received as a percentage of 2018‑19 revenues by cities than counties. For counties, federal funding represented between 3 percent and 49 percent of 2018‑19 local revenues. For cities, federal funds ranged from 0.03 percent to 67percent of local revenues. (This small amount on the low end for cities largely is because small cities did not receive any CRF funding directly from the federal government.)
In General, Counties Received More Federal Funds Relative to Their Budgets. The median county received federal funding representing 24 percent of 2018‑19 local revenues, while the median cities received about 14 percent of 2018‑19 revenues. Further, whereas the top quartile of counties received federal funds that represented at least 31 percent of 2018‑19 revenues, the top quartile of cities received federal funds that represented at least 20 percent of 2018‑19 revenues.
Other Sources of Funding
Local governments—primarily cities and counties, but also some types of special districts—have also received additional federal funding to address specific aspects of the pandemic. Most of this funding has been allocated directly to local governments, but some funding will pass through the state. For example, the Department of Public Health has allocated more than $1.5 billion in federal funds to local public health jurisdictions to expand lab capacity; increase testing, contact tracing, surveillance, and epidemiology activities; improve data reporting; conduct targeted outreach to vulnerable communities; and manage distribution and administration of vaccinations. Moreover, similar to the state, local governments in California are eligible to apply for partial reimbursement for local costs to respond to COVID‑19, pursuant to the federal disaster declaration. Refer to the box for additional information about the Federal Emergency Management Agency Public Assistance Program.
Federal Emergency Management Agency (FEMA) Public Assistance Program
Coronavirus Disease 2019 (COVID‑19) FEMA Reimbursement. On March 13, 2020, the President declared a national emergency in wake of the ongoing COVID‑19 pandemic. As a result, state, local, tribal, and territorial governments, and certain private nonprofit organizations, are eligible for FEMA’s Public Assistance Grant Program for emergency protective measures taken during the pandemic. Although the federal government has ultimate discretion, some of these costs could include costs associated with disinfecting eligible facilities, providing temporary medical facilities, providing temporary housing for persons experiencing homelessness, purchasing equipment and supplies (such as face masks and other personal protective equipment), and directing law enforcement to provide necessary assistance. Local governments must meet various requirements to secure the federal funding available under these declarations. Most notably, local governments must agree to provide a portion of the funding for eligible costs. (The federal government may cover the remaining portion of eligible costs.) For example, early in the pandemic, the federal government guidance indicated they would cover 75 percent of eligible costs, which was later adjusted to 100 percent of eligible costs. At times, the state helps offset local governments’ share of cost. For example, through the California Disaster Assistance Grant, the state has covered 75 percent of local government costs that are not covered by the federal government in past disasters.
Uncertainty About FEMA Reimbursement Could Create Additional Fiscal Strain for Local Governments. At this time, how much federal funding ultimately will be provided to California state and local governments for COVID‑19‑related purposes as a result of the emergency and major disaster declarations is unclear. First, there remains uncertainty about what costs will be eligible for FEMA reimbursement. Second, how much funding in total will be made available to states for COVID‑19‑related reimbursements is unknown. Emergency and major disaster declarations are funded from the federal Disaster Relief Fund (DRF). As of March 31, 2021, the Disaster Relief Fund had about $67 billion in funding nationally for all disasters, including the COVID‑19 pandemic. (Any future disaster declarations, such as wildfires, would draw on the same federal DRF for FEMA assistance.) Third, how much of these funds ultimately could be provided to governments in California is unclear. This is because local governments still are determining the full amount of potentially eligible costs. Moreover, depending on the amount of eligible costs submitted by all state and local entities for reimbursement, the federal government may need to further increase the appropriation to DRF if it is to ensure that all affected governments receive full reimbursement for all eligible costs, as it did with the passage of the CARES Act. Alternatively, if there is not sufficient federal appropriation, the federal government could change how it administers FEMA reimbursements. For example FEMA could exercise greater scrutiny when reviewing claims, choose to not fully reimburse eligible costs, and/or delay payments. As a result, the actual amount local governments will receive in FEMA reimbursements may differ from their submitted claims and create additional budgetary strain on local governments.
LAO Comments
Condition of Local Governments’ Finances
Fiscal Condition of Local Governments Varies. Assessing how local governments’ fiscal conditions have been affected by the COVID‑19 pandemic with certainty is difficult. In large part, this is because different revenue sources have been impacted differently and local governments’ reliance on these revenue sources varies significantly. Moreover, the fiscal condition of a particular city, county, or special district today is, in part, influenced by its condition prior to the pandemic. Local governments that had healthy revenues and reserves at the start of the pandemic were better positioned to weather the pandemic’s economic effects. The expenditure pressures experienced by local governments also varied. For example, some types of special districts, such as fire protection districts that provide emergency response, were directly involved in responding to COVID‑19 and had associated costs, while other special districts, like mosquito and vector control districts, may have been less affected by COVID‑19 and likely had more limited expenditure pressures as a result. Further, some local governments have received substantial federal resources while others received less. Notably, an entire type of local government—special districts—in most cases received no flexible federal assistance. Given the variability of local governments’ fiscal condition, below, we lay out a framework for the Legislature to use to identify local governments whose fiscal condition most likely has been adversely affected by the pandemic.
Framework for Assessing Local Governments’ Fiscal Condition
Any Additional Financial Assistance to Local Governments Should Be Targeted Based on Assessment of Local Government Fiscal Condition. Cities and counties have been provided historically significant levels of federal funding to respond to the COVID‑19 pandemic. The allocation of this past funding was designed to get money to cities and counties as fast as possible largely by using readily available metrics, such as a jurisdiction’s population and other commonly used allocation formulas, to determine the level of funding allocated to each jurisdiction. Additional actions by the Legislature to address the economic and revenue consequences of this emergency for local governments could be warranted in some cases. However, should the Legislature wish to provide any of the state’s ARP funds—or other state funds—to assist local governments, we recommend the Legislature consider using a more targeted methodology to allocate such funds. There is no one‑size‑fits‑all approach to assisting local government because each jurisdiction has its own unique circumstances.
Unfortunately, Aggregated Data Not Currently Available to Precisely Identify Local Governments That May Be in Most Need of Additional Resources… At this time, a targeted approach that identifies and distributes funds to the local governments that may be most in need across the state is more easily said than done. The state will have limited insight into which local governments have been most affected by the pandemic until after the SCO publishes additional years of local government financial data. The picture will become more clear next year when the Legislature considers the state’s 2022‑23 budget after the SCO has published local governments’ 2019‑20 financial data and clearer still when the Legislature considers the state’s 2023‑24 budget after the SCO has published local governments’ 2020‑21 financial data.
…However, Some Local Governments With Certain Attributes May Benefit From Assistance in the Short Term. There likely are local governments that are facing financial pressure that could benefit from receiving additional state assistance—a portion of the state’s ARP funds or other sources—in 2021‑22. Although local governments’ financial data are not yet available, we have identified a list of characteristics—based on data available about local governments before and during the pandemic—that we think can help the Legislature if it is interested in strategically identifying which local governments’ fiscal condition has been most affected by the pandemic, and therefore might be in the most need of additional assistance in 2021‑22. A local government that falls into more than one of these categories, likely is in greater need of additional resources.
- Significant Reliance on Sales Tax Revenue. Many cities rely on sales tax revenue as a major revenue source for their budget. In the case of the 24 cities most reliant on sales tax (the top 5 percent), sales and use tax collections in 2018‑19 constituted between 31 percent and 70 percent of total local revenues. While some cities actually saw growth in their sales tax revenue collections during the pandemic, most experienced declines. Of the local governments that saw a decline in sales tax collections, those that rely more heavily on sales tax revenues—meaning sales tax makes up a larger share of overall revenue sources—likely have seen larger revenue declines than those that rely on other revenues. Of the cities that rely on sales tax revenue, cities whose sales tax revenues depend on tourism likely have been especially affected.
- Significant Reliance on TOT Revenue. Although we do not have data on TOT collections during the pandemic, there is clear evidence that travel declined significantly. Consequently, TOT collections also likely dropped. Local governments that rely more heavily on TOT revenues—meaning TOT makes up a larger share of overall revenue sources—likely have seen larger revenue declines than those that rely on other revenues. In the case of the 24 cities most reliant on TOT (the top 5 percent), TOT collections in 2018‑19 constituted between 15 percent and 59 percent of the cities’ 2018‑19 local revenues.
- Significant Reliance on User Fee Revenue. The economic fallout of the pandemic resulted in a decline in user fees either because public health orders prevented access to services (for example, parks and recreation services) or because government orders protected users from having services shut off due to lack of payment. Local governments that rely heavily on these fees—like enterprise districts—likely have been more acutely affected.
- Lower Levels of Federal Funding Received to Date. The recent actions by the federal and state governments described in this analysis will mitigate some of the adverse budgetary effects that the COVID‑19 pandemic has had on local governments. That being said, the funding received by local governments on a per capita basis varied across the state. In addition, with some very limited exceptions, special districts did not receive CRF or local fiscal recovery federal funds. While 25 percent of cities received federal funds that constituted at least 20 percent of 2018‑19 revenues, 5 percent of cities (24 cities) received federal funds that constituted only between 0.03 percent and 3.8 percent of 2018‑19 revenues.
Additional Considerations. As the Legislature contemplates how it would assess whether a local government could benefit from additional relief as a result of COVID‑19, we recommend the Legislature consider what additional information it might want to collect as part of the review process. For example, the extent to which a local government provided services with increased demand during the pandemic likely indicates how a local government’s expenditures may have been affected by the pandemic.
Fortunately, Legislature Has Time to Decide How to Appropriate Its Federal Funds. The state has until December 31, 2024 to spend its federal ARP allocation. As such, we recommend the Legislature not allocate all of the ARP funds available to the state as part of its 2021‑22 budget. (Our recent publication, A Framework for Allocating Federal Recovery Funds, lays out some guiding principles for the Legislature to consider as it formulates a plan for using the fiscal recovery funds.) That said, there may be an interest in allocating a portion of these funds to local governments that did not receive federal assistance this year, or otherwise are clearly know to be experiencing significant financial pressure. In the near term, if the Legislature has interest in providing fiscal relief to local governments, it could allocate funds to local governments most clearly in need—such as special districts that had a direct role in responding to the COVID‑19 pandemic with no access to federal fund relief. The Legislature could develop a more targeted approach to distributing additional assistance in the long term when additional information becomes available about the fiscal pressures on local governments, including how existing federal assistance has offset local revenue declines and expenditure pressures.
Long‑Term Uncertainties Remain
Pandemic Could Have Unknown Long‑Term Effects on Local Governments. The long‑term consequences of the pandemic are yet to be known. For instance, if there are broad, long‑standing changes to where people chose to live and work, the pandemic could, over time, change the key economic drivers of a community. As an example, some employers may continue to provide their employees additional flexibility to work remotely even after the COVID‑19 emergency subsides. These changes could affect the value of commercial property and over time lead to deceleration in local government property tax revenue growth. These unknowns create an unprecedented degree of uncertainty about the economic outlook of local governments. Given the breadth of these uncertainties, waiting to decide whether to allocate some of the state federal funding is prudent until there is a better understanding of how local governments have been affected by the COVID‑19 pandemic.
Conclusion
In this analysis, we provide a framework for the Legislature to use in order to identify which local governments’ fiscal condition likely have been most affected by the pandemic. While the analysis focused on the use of federal funds, recent revenue trends suggest the possibility of a budget surplus, presenting an opportunity for the Legislature to also consider using state resources to fill in any gaps in federal funding to local governments to address COVID‑19‑related costs or to provide assistance for other non‑COVID‑19‑related budgetary pressures facing local governments. Whether using state or federal funds, the Legislature has the opportunity to assess whether it is interested in providing additional financial assistance to local governments. If so, the Legislature could consider targeting these additional resources to those local governments that, based on the factors presented in this analysis, are under the most fiscal pressure due to a combination of (1) decreased revenues, (2) increased costs, and (3) relatively lower allocations of state and federal relief funds thus far.