LAO Contact
- Local Control Funding Formula Kindergarten
- Career Technical Education
- Statewide System of Support "Inclusive Early Education" Expansion State Preschool
- K-12 Education in Context
- Special Education Staffing
- Overview of Governor’s Proposition 98 Budget Pension Costs

February 7, 2018
The 2018-19 Budget
Proposition 98 Education Analysis
- Introduction
- K‑12 Education in Context
- Overview of Governor’s Proposition 98 Budget
- Local Control Funding Formula
- Career Technical Education
- Special Education Teacher Proposals
- “Inclusive Early Education” Expansion
- State Preschool
- Kindergarten
- Pension Costs
- Summary of Recommendations
Executive Summary
In this report, we analyze the Governor’s overall Proposition 98 budget package as well as his specific spending proposals for K‑12 education and early education.
Overall Proposition 98 Budget
Governor’s Budget Contains $6.3 Billion in Proposition 98 Spending Proposals. Of the new spending, almost $5 billion (78 percent) is for K‑12 education, $1.2 billion (19 percent) is for the California Community Colleges (CCC), and $193 million (3 percent) is for the California State Preschool Program. Across the three segments, $3.9 billion is for ongoing programs and $2.4 billion is for one‑time activities. Under the Governor’s budget, overall K‑12 funding per student increases from the revised 2017‑18 level of $11,165 to $11,628 in 2018‑19, an increase of $463 (4.1 percent).
Governor’s Overall Budget Approach Is Reasonable but Some Specific Proposals Do Not Address Root Issues. We think the Governor’s plan to allocate available Proposition 98 funding to a mix of ongoing and one‑time initiatives is reasonable. Including one‑time initiatives reduces the likelihood of programmatic cuts to schools if the state experiences an economic downturn after 2018‑19. Additionally, many of the Governor’s specific proposals—including those relating to the Local Control Funding Formula (LCFF), district support, special education staffing shortages, and career technical education (CTE)—focus on areas of interest to the Legislature. We are concerned, however, that several of the Governor’s proposals are unlikely to address longstanding and systemic underlying problems in these areas. In response to many of these proposals, we offer the Legislature alternatives designed to address root issues. In many cases, these alternatives can be structured to cost less than the funding levels proposed by the Governor.
Key Messages
Reaching Full Implementation of LCFF Creates Opportunity to Reflect. The Governor’s plan to dedicate most new ongoing K‑12 funding to LCFF implementation is consistent with the Legislature’s approach over the past five years. By continuing to prioritize LCFF implementation, the state would be fostering greater local control and flexibility while simultaneously providing more funding for disadvantaged students. Upon reaching full implementation, the Legislature will have many options to consider regarding next steps. We weigh the trade‑offs of six possible options: (1) increasing base rates, (2) increasing supplemental/concentration rates, (3) changing rules for how districts generate funding for English learner and low‑income (EL/LI) students, (4) raising the concentration threshold and rate to target funds to the highest‑poverty districts, (5) providing clearer guidance and/or more flexibility for how high‑poverty districts may use EL/LI funding, and (6) creating new categorical programs. Upon deciding its core policy objectives, the Legislature this year or in coming years might pursue one or more of these options.
Legislature Could Adopt a More Strategic Approach to Retiring the K‑12 Mandate Backlog. The Governor’s budget proposes $1.8 billion in one‑time discretionary grants to schools. The funds would be distributed on a per‑student basis and first applied to districts’ outstanding mandate claims. With two‑thirds of districts having no claims, the bulk of the $1.8 billion would have no effect on the backlog, with the backlog decreasing less than $300 million. As an alternative to the Governor’s approach, we recommend the Legislature identify an amount equal to or in excess of the remaining backlog (about $900 million) and distribute funds on a per‑student basis, but require districts receiving funds to write off all remaining claims. This approach would make substantially more progress toward eliminating the backlog without rewarding districts that have unusually costly claims.
Recommend Alternative Approach to System of Support. The Governor’s budget includes four proposals totaling $76 million that are focused on supporting districts recently identified as having performance issues. We have serious concerns with the Governor’s overall approach to designing this system of support as well as each of his four specific proposals. We recommend the Legislature consider an alternative approach centered around districts rather than county offices of education (COEs). We believe the alternative approach has many advantages. Perhaps most importantly, it promotes district ownership of improvement efforts by allowing districts to choose from multiple teams of experts specializing in their performance issues. It also promotes responsiveness by allowing the California Collaborative on Educational Excellence to contract with new teams of experts each year as new district performance issues emerge. Unlike the Governor’s approach, it does not silo support for general education and special education, provide COEs with additional funding for services that already are funded through their LCFF allocations, or create new regional entities with poorly defined roles. It also costs substantially less ($30 million compared to $76 million).
Recommend LCFF Approach to CTE, but Modify Existing CTE Program if Taking Categorical Approach. The Governor’s budget provides $212 million for a high school CTE program run out of CCC. The Governor’s primary objective of running the program out of CCC is to improve coordination between schools, community colleges, and industry partners. We recommend the Legislature fund CTE from LCFF. If the Legislature has concerns that schools will not offer CTE under the LCFF structure, the Legislature could consider modifying the formula (for example, increasing the high school base rate) or modifying the accountability system (for example, establishing separate college and career readiness indicators). Though we believe funding CTE within LCFF promotes more coherent planning as well as clearer and stronger accountability, the Legislature might consider creating a CTE categorical program. If the Legislature takes this approach, we recommend it reject the Governor’s Strong Workforce approach and instead modify the existing CTE Incentive Grant program. Specifically, we recommend the Legislature (1) set a minimum threshold of CTE coursework that must be aligned with regional workforce needs, (2) require school and college districts to share data and accountability for CTE student outcomes, and (3) fold in funding from four other high school CTE programs.
Recommend Comprehensive Approach to Addressing State’s Special Education Staffing Shortages. The Governor proposes two one‑time grant programs totaling $100 million to support special education teacher recruitment, training, and retention. While we commend the Governor for focusing on the longstanding problem of special education staffing shortages in the state, we are concerned that his proposals fail to address the root causes of these shortages—most notably a lack of pay differentials for special education teachers, and to a lesser extent, overly restrictive education and credentialing requirements. The Governor’s proposals also do not address the longstanding shortages of special education specialists (such as speech therapists). We recommend the Legislature reject both of the Governor’s proposals and instead pursue changes that address the root causes of these shortages. Specifically, we recommend schools establish ongoing pay differentials for special education teachers. At the state level, we recommend pursuing a variety of actions, including reducing the number of special education credentials, authorizing a four‑year degree pathway option for special education teachers, and providing targeted enrollment funding for the California State University to expand certain graduate specialist training programs.
Introduction
In this report, we analyze the Governor’s budget proposals for K‑12 education and early education. In the first section of the report, we provide background on public schools in California. We then provide an overview of the Governor’s Proposition 98 budget package. In the remaining sections of the report, we analyze the Governor’s specific school and early education proposals and examine a few related issues, including school pension costs. The report also contains two sections responding to statutory requirements. In these two sections, we examine (1) state funding rates for kindergarten and (2) health and safety standards for school districts offering State Preschool. In our forthcoming Higher Education Analysis, we provide background on the California Community Colleges, also funded by Proposition 98, and discuss the Governor’s specific community college proposals. On the “EdBudget” portion of our website, we post dozens of tables containing additional detail about the Proposition 98 budget.
K‑12 Education in Context
In this section, we answer many questions legislators and others commonly ask about K‑12 education in California. We begin by providing information on the main components of California’s public school system. We then review the state’s K‑12 accountability system. Lastly, we explain the basics of school finance in California.
California’s Public School System
Below, we describe California’s students, teachers and staff, local education agencies (LEAs), and state education agencies.
Students
California Has More Than 6 Million Public K‑12 Students. In 2016‑17, California’s public schools enrolled 6.2 million students, representing 12 percent of all public school students in the nation. About two‑thirds of these students were in grades kindergarten through eight, with one‑third attending high school. From the mid‑2000s through 2013‑14, K‑12 attendance remained essentially flat. Since 2014‑15, attendance has declined slightly each year.
Almost Six in Ten California Students Are Identified as Low Income. In 2016‑17, 58 percent of California’s public school students were eligible to receive a free or reduced price school meal under a large federal nutrition program. States frequently use this eligibility measure as an indicator of a student coming from a low‑income family. Qualifying students come from families earning no more than 185 percent of the federal poverty level. In 2016‑17, this level equated to $45,000 for a family of four. California’s rate of free or reduced price meal eligibility is above the nationwide rate of 52 percent.
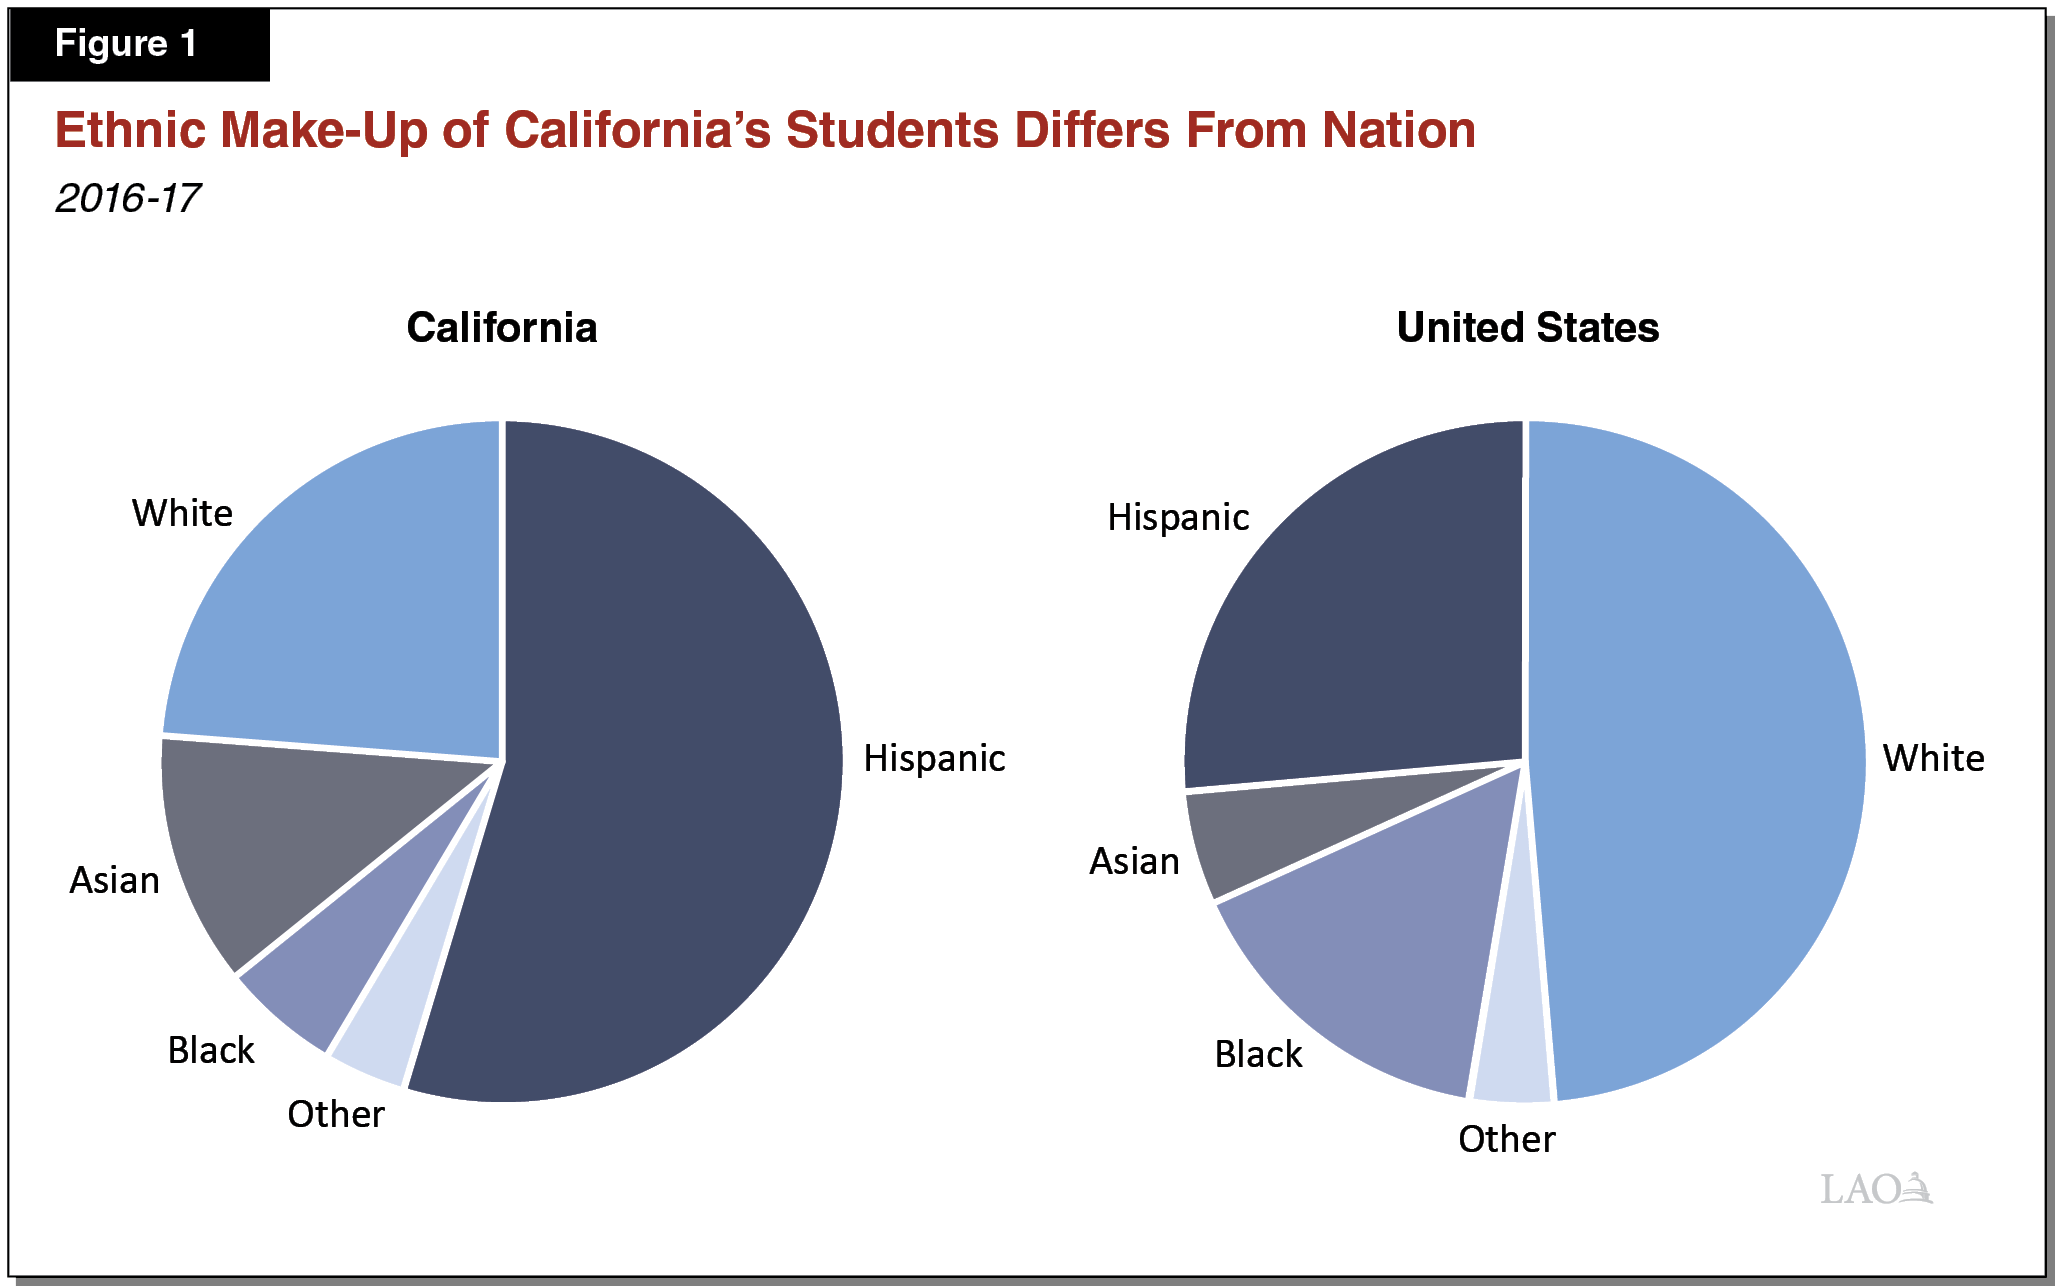
About Half of California Students Are Hispanic. As Figure 1 shows, the ethnic make‑up of California’s students differs notably from the nation. Whereas about half of California’s students are of Hispanic origin and about one‑quarter are white, in the United States those shares are flipped. Differences exist among other ethnic groups too, with Asian students comprising a larger share of students in California than the nation (12 percent and 5 percent, respectively), and black students comprising a smaller share (6 percent in California compared to 16 percent nationwide).
About One‑Fifth of California Students Are English Learners. Students are classified as English learners based on a home language survey and their performance on a test of English proficiency. In 2016‑17, 21 percent (1.3 million) of California students were classified as English learners—a higher proportion than in any other state. Three out of every ten English learners in the nation attend school in California. Even more California students—almost 2.7 million students overall—speak a primary language other than English at home, but almost half of these students are considered fluent in English. California students come from families speaking over 65 different home languages, although the vast majority (78 percent) speak Spanish, with Vietnamese the next most common language (3 percent).
About One in Ten California Students Are Identified as Having a Disability Affecting Their Education. In 2016‑17, about 754,000 California students (12 percent) were identified with a disability affecting their education. Pursuant to federal law, schools must provide these students with special education services. California identifies a slightly smaller proportion of students for special education than the rest of the nation (13 percent). Specific learning disabilities such as dyslexia are the most common diagnoses requiring special education services (affecting 5 percent of the state’s K‑12 students), followed by speech and language impairments (affecting 3 percent of California’s students). Although autism remains a relatively rare diagnosis (affecting 1.7 percent of California’s students), the number of students diagnosed with this disability has increased notably (from 14,000 children in 2000‑01 to 105,000 in 2016‑17).
Staffing
California Has Almost 300,000 Teachers. In 2016‑17, about 296,000 full‑time‑equivalent teachers were employed in California’s public school system. Roughly three‑quarters of teachers are women, similar to the share in other states. Compared to the student population, teachers are more likely to be white (66 percent of teachers compared to 24 percent of students) and less likely to be Hispanic (21 percent of teachers compared to 55 percent of students). Over the past five years, the state’s teacher workforce has increased at an average annual rate of 1.5 percent per year.
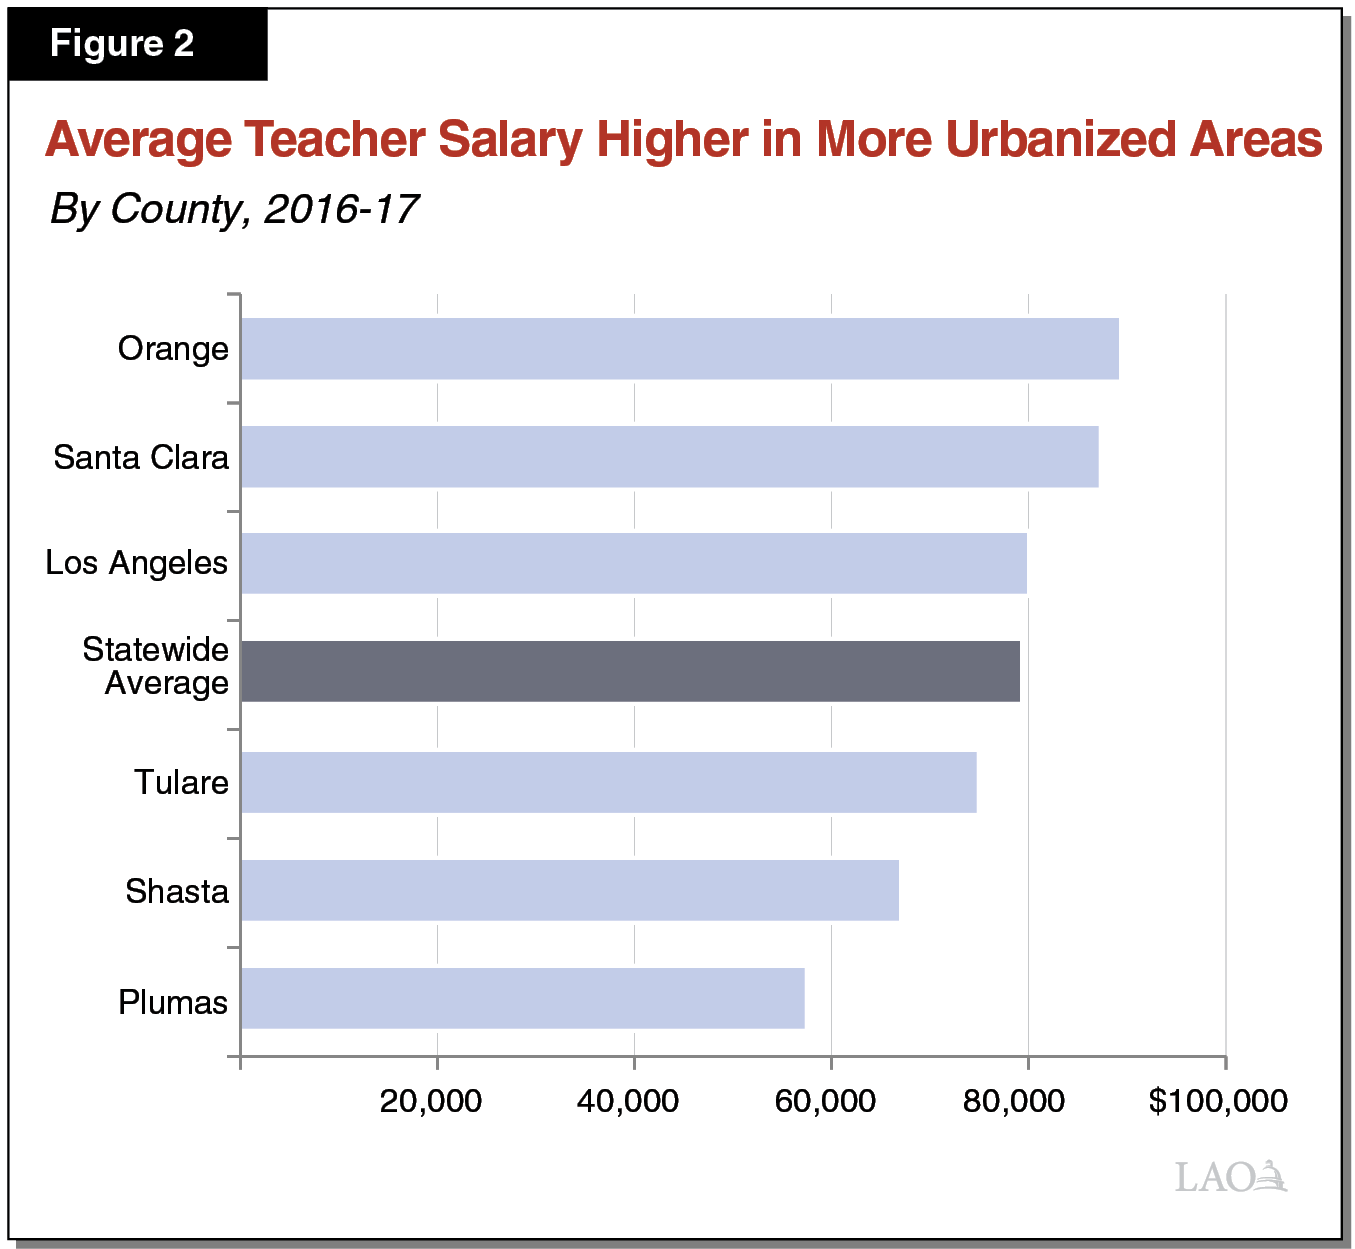
Teacher Salaries Vary Across the State, Are Higher on Average Than Other States. In California, the state requires most LEAs to set teacher salary levels through collective bargaining. As Figure 2 shows, teacher salaries vary widely across the state, with salaries generally higher in urbanized areas than rural areas. In 2016‑17, the average teacher salary was $79,100—34 percent higher than the national average. California consistently ranks among the top states for teacher salary, along with Connecticut, New York, New Jersey, and Massachusetts.
California Has Highest Student‑to‑Teacher Ratio in Nation. Though California’s teachers tend to be better paid than the rest of the nation, the state has comparatively fewer of them. Over the five‑year period from 2010 through 2014, the national average student‑to‑teacher ratio hovered at 16. California’s ratio was notably higher throughout this period, but it has been declining steadily since 2011‑12. In 2016‑17, California’s student‑to‑teacher ratio was 20.4.
California Has 306,000 Other School Staff. In addition to teachers, schools employed 306,000 full‑time‑equivalent staff in various administrative and support positions in 2016‑17. This number includes 26,000 principals, assistant principals, and other school administrators (equating to about 1 school manager for every 11 teachers). It also includes 29,000 pupil services personnel (primarily counselors, psychologists, and speech pathologists). Similar to teachers, both administrators and pupil services personnel must hold a state credential. The remaining 251,000 employees work in positions that do not require a credential. These employees—known as classified staff—include clerical workers, janitors, teacher aides, and bus drivers.
Local Education Agencies
School Districts and Charter Schools Provide Most Instruction. The public school system comprises many LEAs. In 2016‑17, 945 school districts and 1,248 charter schools operated in California—typically offering comprehensive educational programs for students in their local areas. In addition, county offices of education (COEs) operate certain types of schools for at‑risk students, including students who are incarcerated or have been expelled. Many COEs also operate special education, career technical education, adult education, and preschool programs. California’s public school system also includes seven state‑run schools—consisting of three special schools for blind or deaf students and four schools for students incarcerated at state juvenile justice facilities.
Size of California School Districts Varies Dramatically. As Figure 3 shows, California’s school districts vary greatly in size. One‑quarter of school districts are very small, serving 300 or fewer students. Another one‑third are small, serving between 301 and 2,500 students. Whereas these two sets of districts combined comprise more than half of all districts in California, they account for only 7 percent of all students. At the other extreme, 12 very large districts each serve more than 40,000 students and together educate one‑fifth of all students in the state. The number of school districts in each county also varies across the state, with seven counties containing a single district each, and the most populous county (Los Angeles) containing 80 districts.
Figure 3
California School Districts Vary Greatly in Size
2016‑17
|
District Sizea |
Number of Districts |
Percent of All Districts |
Total Students |
Percent of All Students |
|
Less than 300 |
242 |
26% |
28,986 |
1% |
|
301 to 2,500 |
311 |
33 |
347,203 |
6 |
|
2,501 to 5,000 |
132 |
14 |
485,979 |
9 |
|
5,001 to 10,000 |
110 |
12 |
816,719 |
15 |
|
10,001 to 40,000 |
138 |
15 |
2,588,579 |
48 |
|
40,001+ |
12 |
1 |
1,076,310 |
20 |
|
Totals |
945 |
100% |
5,343,776 |
100% |
|
aBased on average daily attendance. Excludes charter school attendance. |
||||
Charter Schools Are Fast Growing. Charter schools are publicly funded schools that are similar to traditional schools in that they must employ state‑certified teachers, teach the same state academic standards, and administer the same state assessments. They differ from district‑operated schools, however, in that they are exempt from certain state laws. In exchange for these exemptions, they must adhere to locally developed, approved, and periodically renewed charters. These local charters are intended to give schools more flexibility over the design of their education programs. While the total number of K‑12 students declined slightly over the past decade, charter school attendance nearly tripled, growing at an average annual rate of 11 percent. In 2016‑17, charter schools served 580,000 students (10 percent of the statewide total), up from 210,000 students (3 percent of the statewide total) in 2006‑07. In 2016‑17, charter schools ranged in size from 5 students to more than 5,000 students, with an average school size of 473.
COEs Typically Provide Countywide Support Services. In addition to providing some specialized forms of direct student instruction, COEs offer a variety of services to school districts. Many COEs, for example, operate countywide payroll systems and provide professional development for teachers and administrators. COEs also are required to review and approve school districts’ annual budgets, monitor the fiscal health of districts several times per year, and review districts’ strategic academic plans, known as Local Control and Accountability Plans (LCAPs). The COEs also will have a support role in helping school districts that do not meet performance standards, but this system remains in development.
State Education Agencies
California Department of Education (CDE) Administers Education Programs. The department monitors compliance with state education laws and regulations, collects and compiles education data, allocates funding, and provides support to LEAs. The department has an annual budget of around $270 million and about 1,600 employees—rendering it midsized compared with other departments within California state government. More than two‑thirds of CDE’s funding comes from federal funds, as many of CDE’s activities are associated with federal programs. The Superintendent of Public Instruction (SPI)—a nonpartisan position elected by the voters—oversees the department.
A Few Other State Agencies Involved in Major Aspects of K‑12 Education. In addition to CDE, the following state entities are involved in major aspects of K‑12 education:
- The State Board of Education (SBE) adopts regulations to implement certain state laws and reviews LEA waiver requests. In recent years, the board’s most significant decisions have related to LCAPs. The board has an annual budget of $2.6 million (state General Fund) and about ten employees.
- The Commission on Teacher Credentialing (CTC) is responsible for accrediting teacher preparation institutions, credentialing teachers, and investigating allegations of teacher misconduct. CTC has an annual budget of around $25 million (special fund) and about 140 employees.
- The Office of Public School Construction (OPSC), an office within the Department of General Services, reviews school facility projects to determine if they qualify for state bond funding. OPSC has an annual budget of around $9 million (bond funding) and about 50 employees.
State Contracts With Some COEs to Perform Statewide Functions. In addition to these state entities, the state contracts with some COEs to undertake activities that have statewide benefits. The Fiscal Crisis and Management Assistance Team (affiliated with the Kern COE) provides fiscal advice, management assistance, and other budget‑related training to school districts across the state. California School Information Services (also affiliated with the Kern COE) helps LEAs across the state with data management issues. The K‑12 High Speed Network (affiliated with the Imperial COE) assists schools with Internet connectivity. The California Collaborative for Educational Excellence or CCEE (affiliated with the Riverside COE), assists certain LEAs with improving their student outcomes. The state also contracts with the San Joaquin COE to maintain two websites (the California School Dashboard and the School Accountability Report Card) that make school district performance data publicly available. Additionally, the state sometimes competitively bids limited‑term contracts with select COEs to administer special initiatives, such as conducting statewide teacher recruitment campaigns and providing statewide training on salient issues.
Accountability
Below, we describe the state’s current academic standards and student assessments. We next review trends in student performance. We then explain how the state supports LEAs identified as underperforming.
Academic Standards
Like Most States, California’s Instruction Is Based on Common Core State Standards. In 2010, at the direction of the Legislature, SBE adopted the Common Core State Standards (with the addition of a few California‑specific standards) as the foundation for what students should know and be able to do in English language arts and math. In 2012, the state adopted standards aligned to the Common Core for English Learners. Forty‑two states and the District of Columbia have adopted the Common Core State Standards.
State Is Implementing New Science Standards. In 2013, California adopted the nationally developed Next Generation Science Standards (NGSS). California was a lead state partner in the development of these new standards. SBE adopted initial guidance on how to teach the new science standards in 2016. Some schools currently are field testing the new guidance and implementing the new science standards, with the plan to have all schools teach the new standards beginning in 2018‑19.
Student Assessments
Federal Law Requires States to Administer Standardized Tests. As a condition of receiving federal education funding, federal law requires states to assess students in English language arts and math in grades 3 through 8 and at least once from grades 10 through 12. In addition, federal law requires states to assess students in science at least once during: (1) grades 3 through 5, (2) grades 6 through 9, and (3) grades 10 through 12. States also are required to assess the English proficiency of English learners each year.
First Exams Aligned to Common Core State Standards Administered in Spring 2015. Although SBE adopted the Common Core State Standards in 2010, schools were not expected to have their instruction aligned with the new standards until 2014‑15. In spring 2015, the state replaced its previous testing program with new assessments aligned to the Common Core standards. The new assessments were developed by the Smarter Balanced Assessment Consortium (SBAC), a group of 17 states, with California a lead member. The SBAC assessments measure proficiency in reading, writing, and mathematics and are administered online using a computer or tablet. As an alternative to the Common Core assessments, students with the most severe disabilities take the California Alternate Assessments (CAAs)—first implemented in 2016‑17.
State Is Developing Several Other Exams. The state is in the final stages of developing the California Science Test (CAST). It plans to field test CAST in 2017‑18, with all districts administering CAST in 2018‑19. The state also recently created the English Language Proficiency Assessments for California (ELPAC). The ELPAC assesses the English proficiency of English learners. Districts are to administer the annual end‑of‑year ELPAC exams beginning in the spring of 2018 and the diagnostic component of ELPAC beginning in July 2018. The state is in the early stages of developing a Spanish language assessment aligned to the Common Core. Schools could use this optional exam for students receiving instruction in Spanish, English learners enrolled in school for less than 12 months, or other students interested in assessing their proficiency in Spanish.
Student Performance
Performance on New Assessments Improved in 2016, Remained Flat in 2017. In 2017, 49 percent of California students met or exceeded standards in English language arts. This rate was essentially unchanged compared with the 2016 exams but better than the first administration of the exams in 2015—when 44 percent of students met or exceeded standards. Performance on math followed a similar trajectory, with 38 percent of students meeting or exceeding standards in 2017, essentially unchanged from 2016, but higher than 2015 (33 percent).
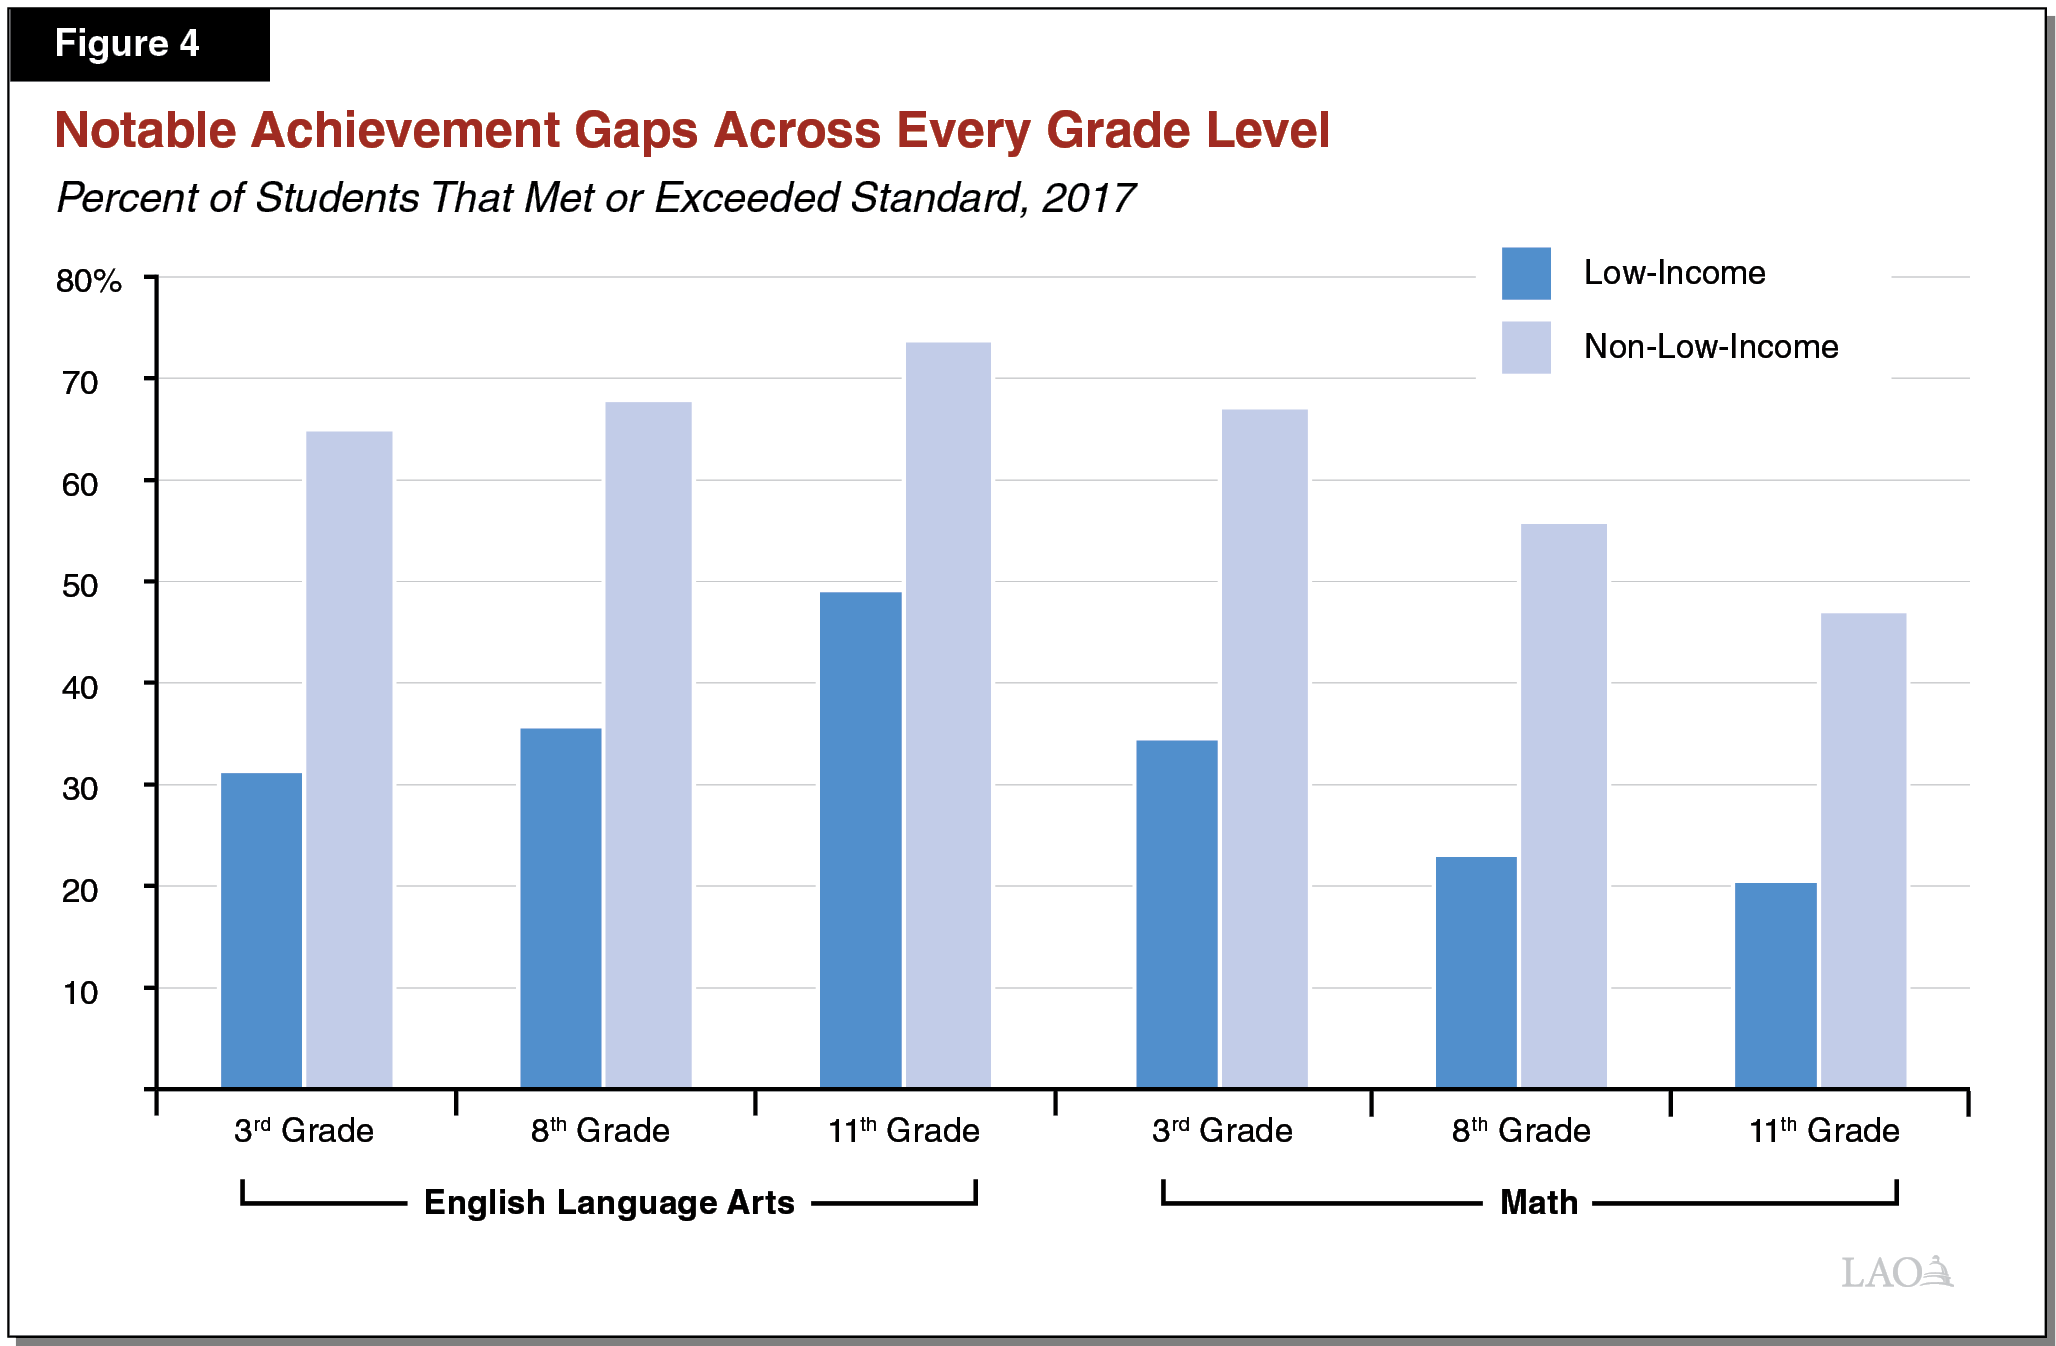
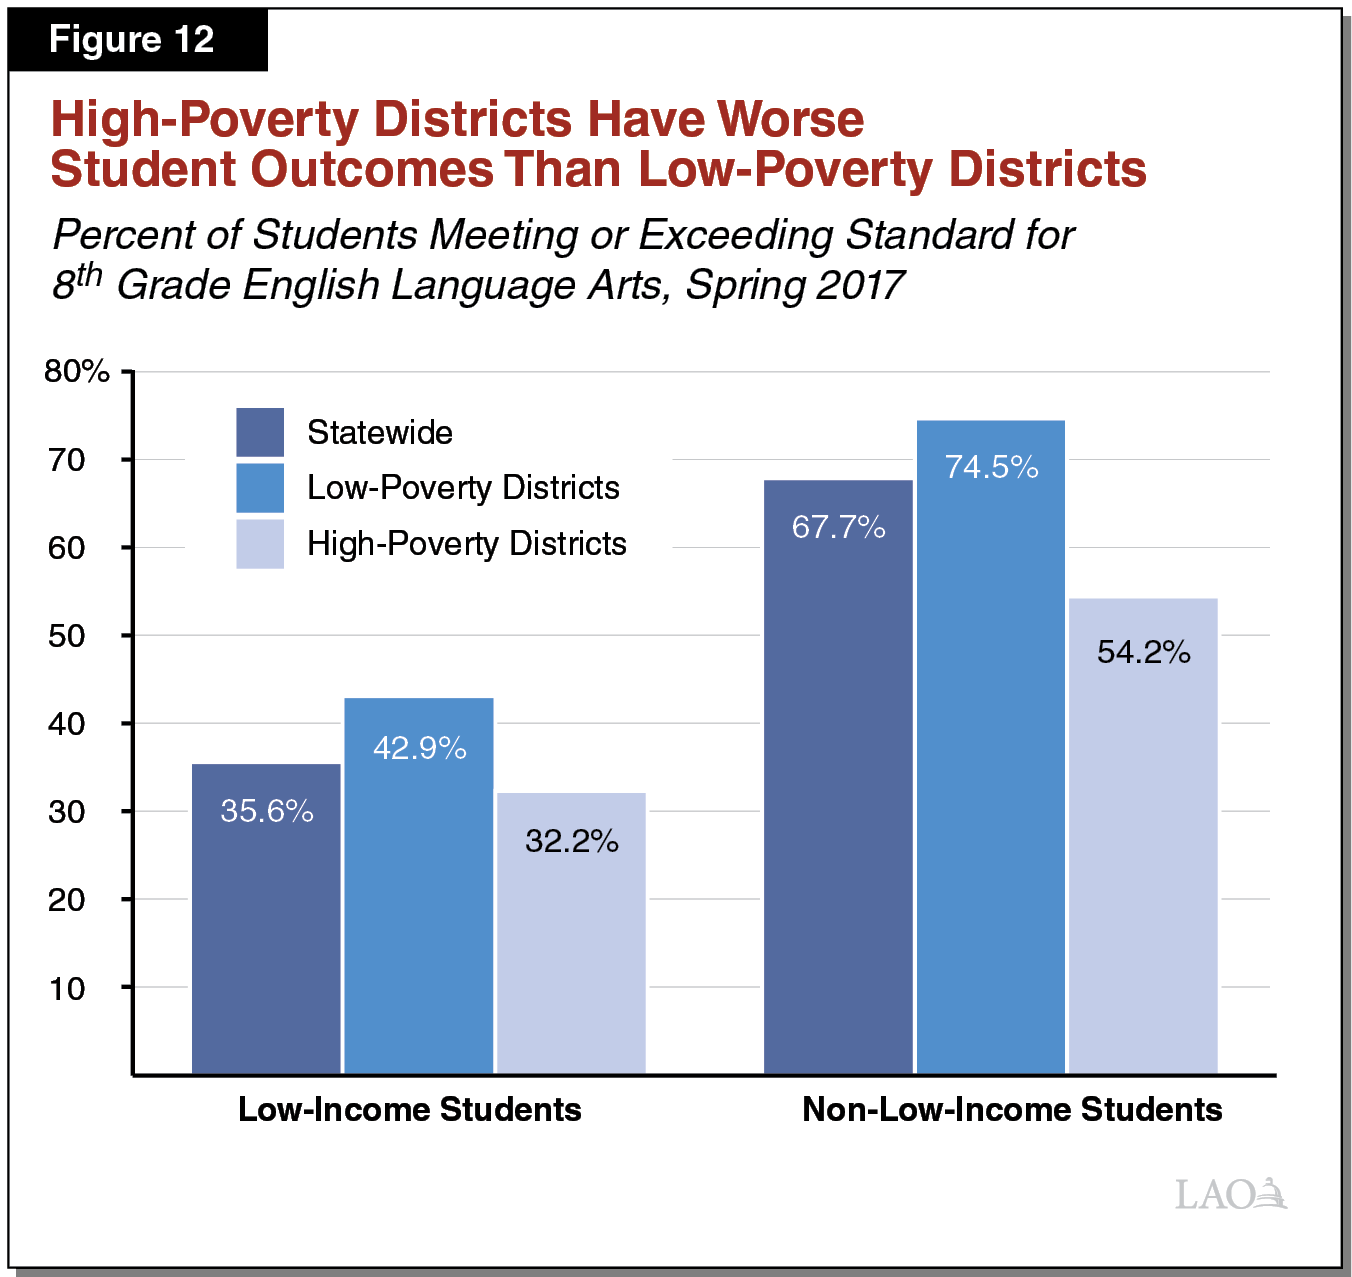
Large Achievement Gaps Exist. Results on the exams show significant achievement gaps between the scores of low‑income and non‑low‑income students. As Figure 4 shows, 36 percent of low‑income students met or exceeded the state standards in eighth grade English language arts, compared with 68 percent of non‑low‑income students. The gaps are similar at other grade levels and for math.
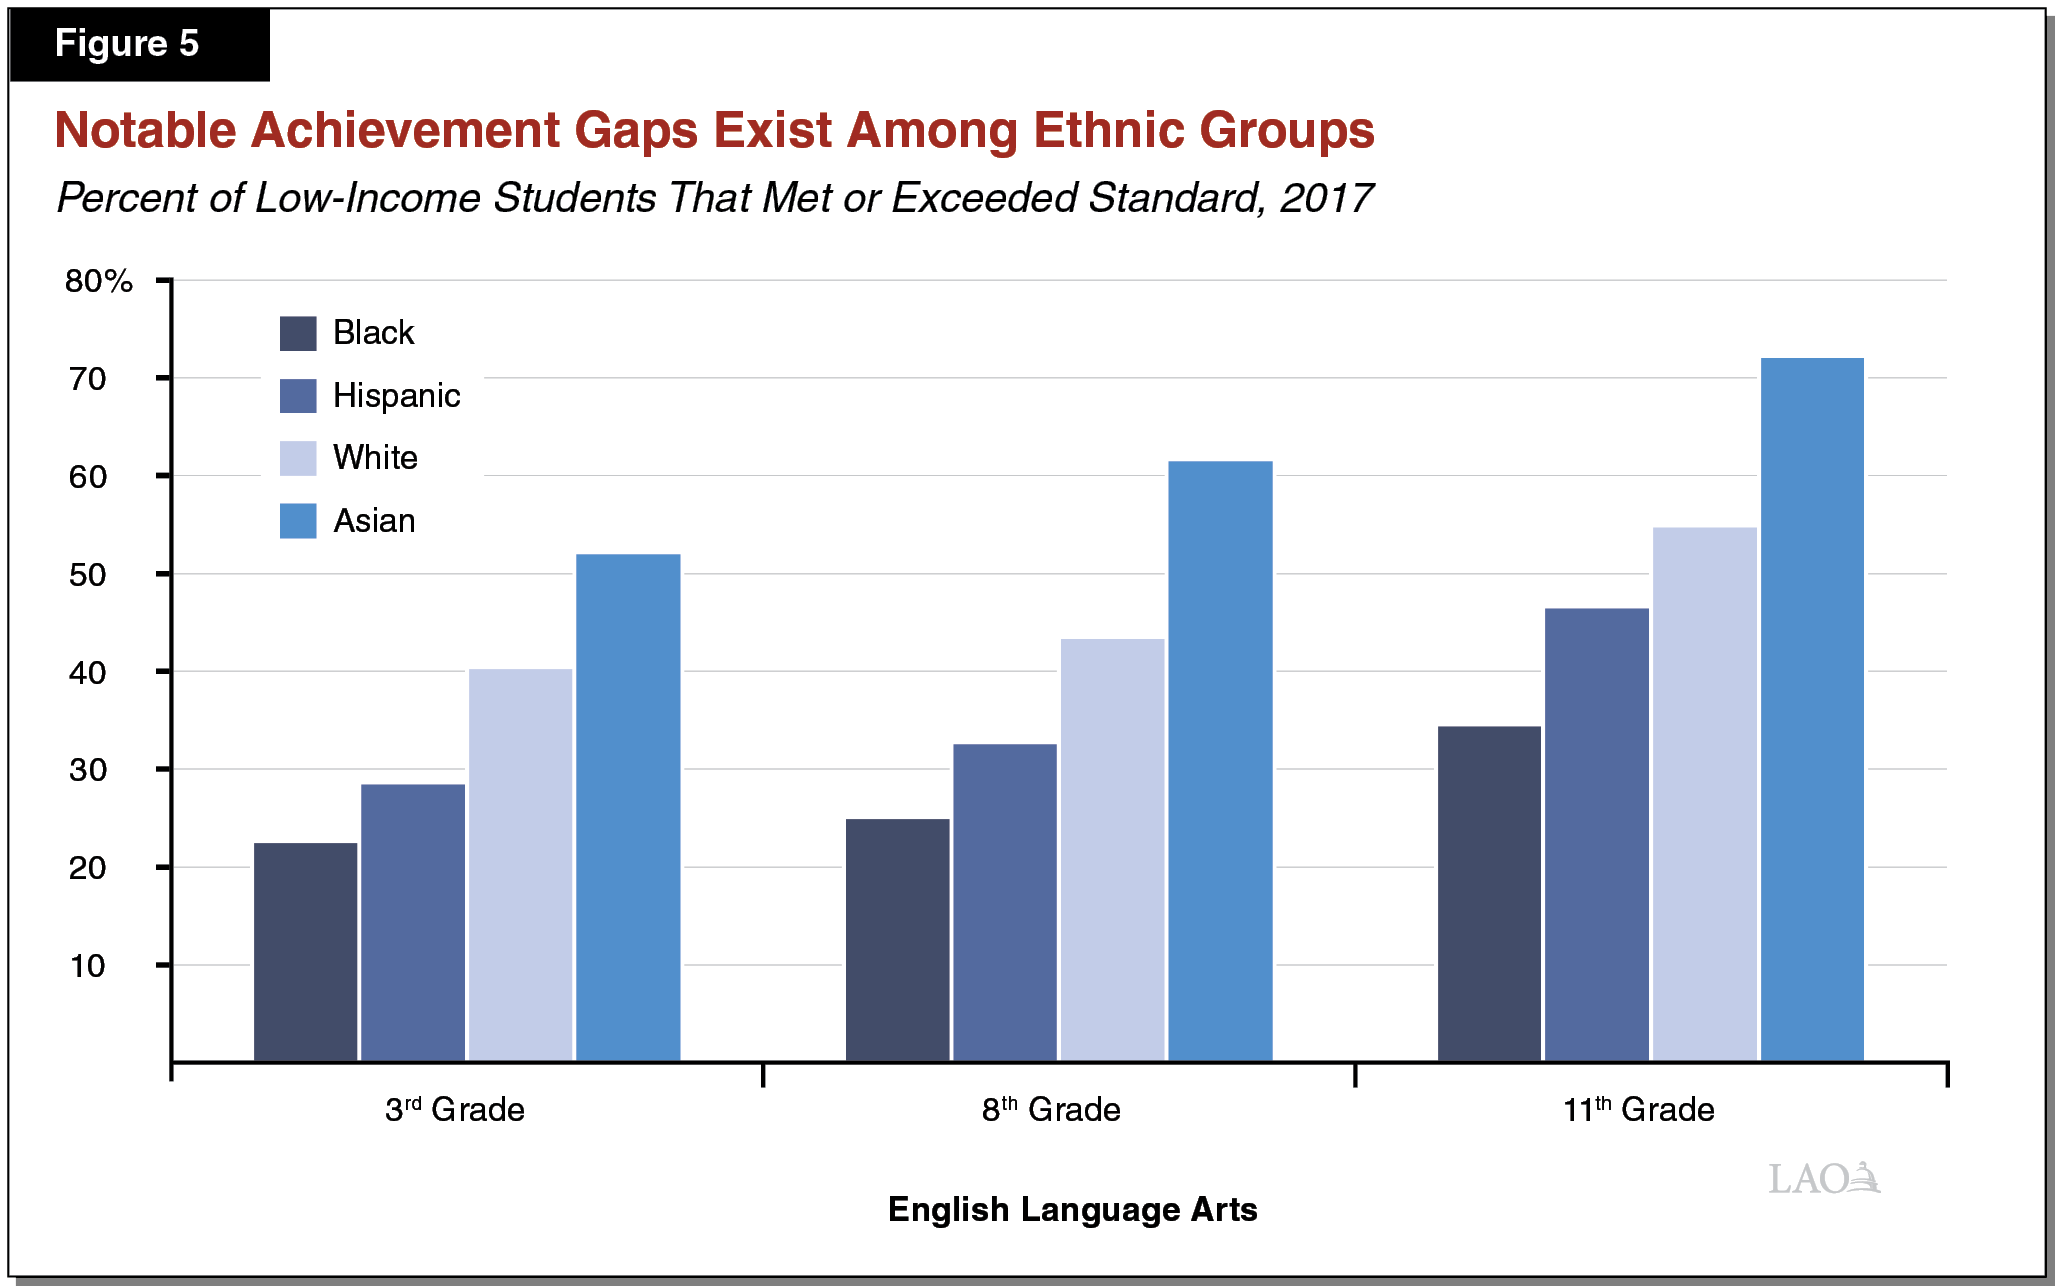
Outcomes Also Vary by Ethnicity. Results on statewide exams show significant achievement gaps among California’s four largest ethnic groups. These gaps persist even after controlling for income. As Figure 5 shows, low‑income black and Hispanic students have lower proficiency rates on eighth grade English language arts exams (25 percent and 33 percent, respectively) than low‑income white and Asian students (44 percent and 62 percent, respectively). Similar differences among groups exist in third and eleventh grade.
California Ranks Near the Bottom on National Tests. The federal government administers the National Assessment of Educational Progress every two years. The most recent assessment results (2015) show that California performs near the bottom in reading and math for fourth and eighth grades. The performance of non‑low‑income students in California (39th in eighth grade reading) ranks a little bit higher than the performance of low‑income students (45th in eighth grade reading). California’s performance compared to other states has not changed significantly in the past ten years. In addition to having lower performance compared to other states, California has among the largest achievement gaps between low‑income and non‑low‑income students. In fourth grade reading, for example, California’s achievement gap ranked 49th in the country (that is, 48 states had achievement gaps smaller than California).
Five in Six Students Graduate High School Within Four Years. Of the cohort of students that entered ninth grade in the 2012‑13 school year, 84 percent graduated within four years. Of the same cohort, 10 percent dropped out of school, 6 percent returned to school for a fifth year, and less than 1 percent received either a High School Equivalency Certificate (if they passed the General Educational Development Test) or a special education certificate of completion.
More Students Are Completing Coursework Required for University Eligibility. In 2016, 45 percent of California students graduated high school having completed the coursework required to be eligible for admission to the California State University and University of California. This proportion has been gradually increasing over the last 20 years. In 1996, 35 percent of California high school graduates completed such coursework. (To be eligible for university admission, students also must meet certain grade point average requirements and take college entrance exams.)
LEA Support
California in Midst of Developing a New Accountability System. The past few years the state has been developing a new system for measuring district performance and supporting districts identified as having poor performance. The state recently decided to use outcome data from the School Dashboard to identify school districts in need of support. Districts are identified when the School Dashboard data reveals poor performance for one or more student subgroups. To measure performance, the state currently looks at student test scores, English learner progress, graduation rates, and suspension rates. Beginning next year, the state also will look at chronic absenteeism and the rate of high school graduates prepared for college/career. In fall 2017, a total of 228 districts were identified for support. Of these districts, 164 (72 percent) were identified solely for poor performance of their students with disabilities.
California in Midst of Aligning Accountability System With New Federal Rules. Whereas the state’s new accountability system identifies districts in need of support, the federal Every Student Succeeds Act (2015) requires states to provide extra support to the lowest performing 5 percent of schools. Sometime in 2018, the state expects to have developed its methodology for identifying these schools.
Underperforming LEAs Are to Receive Extra Support. The state is in the process of determining how to support districts and schools identified as needing support. In developing the system of support, the state is considering the roles of districts, COEs, regional COE hubs, and CCEE. Many key decisions regarding this new system likely will be made in 2018.
Finance
Below, we describe how California funds its schools, explain its ranking on measures of per‑pupil spending, and describe how districts typically use their funding.
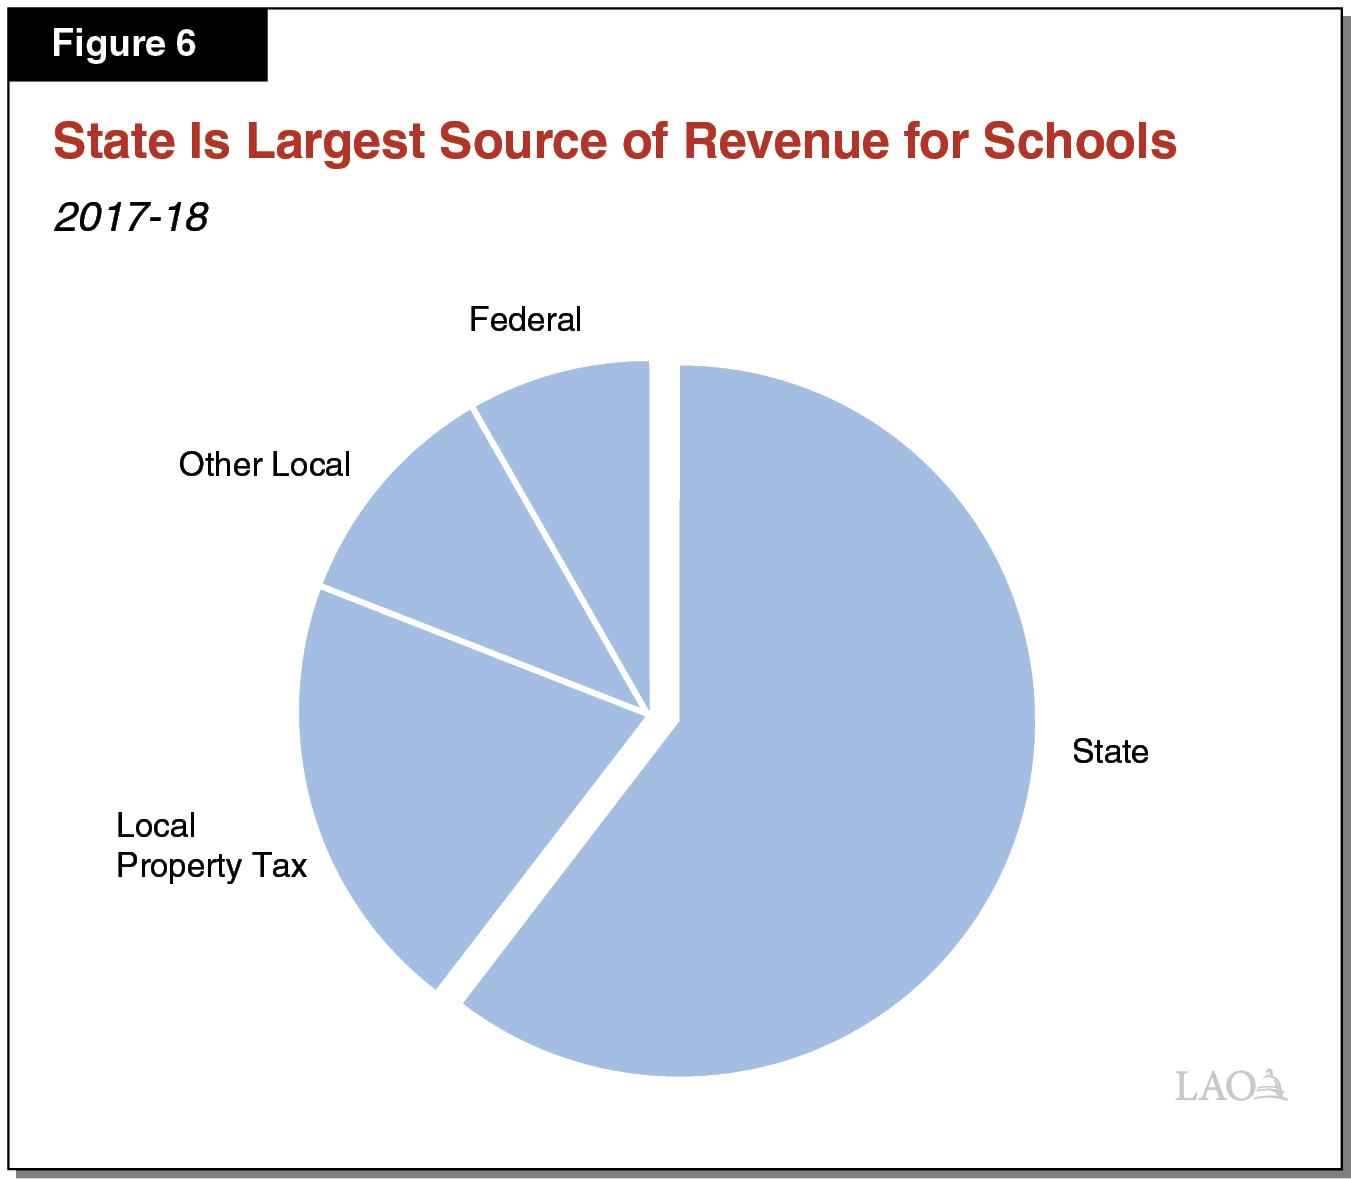
State Is Primary Source of Funding for Schools. In 2017‑18, schools received $93 billion in total funding from all sources. As Figure 6 shows, the largest share of school funding comes from the state, with smaller shares coming from local sources (primarily local property tax revenue) and the federal government. (Revenues from the state lottery account for 1 percent of all revenue.) These proportions differ from many other states, where local property tax revenue covers a much larger share of school funding. Unlike most other states, California’s State Constitution limits local property tax rates.
Per‑Pupil Funding Has Risen Notably in Recent Years. Most comparisons of school funding focus on state General Fund and local property tax revenue, the two revenue sources over which the state has the greatest control. The 2017‑18 Budget Act provided schools with $11,067 per student from these sources, an increase of about $2,400 (28 percent) over the level provided five years ago. Adjusted for inflation, per‑pupil funding is at its highest level in three decades (since the enactment of Proposition 98 in 1988).
California Per‑Pupil Spending Ranks in the Middle Among the States. Based on spending data from 2014‑15 (the most recent year for which national data are available), California ranked 29th in per‑pupil spending among the 50 states and the District of Columbia. Over the past decade, California has ranked as high as 23rd (in 2007‑08) and as low as 36th (from 2010‑11 through 2012‑13). Because California’s revenues are highly sensitive to changes in the economy, school spending tends to be more sensitive to recessions and recoveries than most other states. Given California has increased school funding significantly since 2014‑15, its ranking likely will increase as new data are released over the next few years. (Some organizations calculate per‑pupil spending with adjustments for regional costs. In these rankings, California typically ranks much lower.)
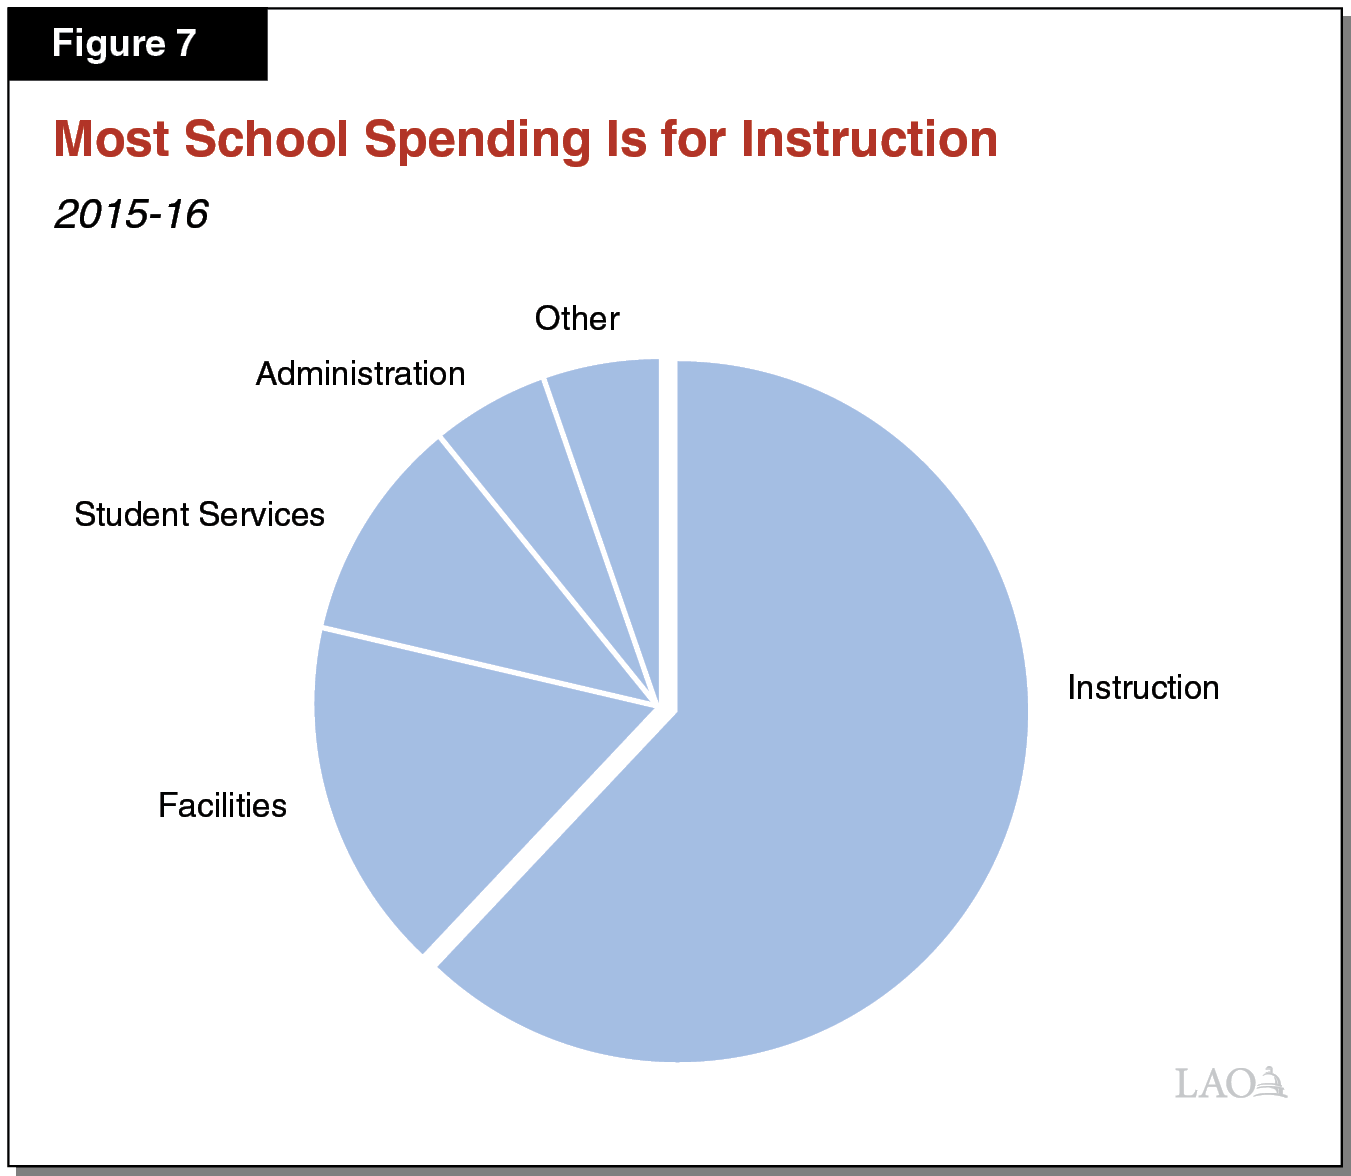
Most School Spending Is for Instruction. As Figure 7 shows, 62 percent of school expenditures in 2015‑16 related to instruction and instructional support—largely paying teacher salaries and benefits. Schools spent 17 percent of their funds on facilities, including land acquisition, construction, and maintenance. Schools spent 11 percent on student services, including school meals, pupil transportation, counseling, and health services. The remaining funds were spent on central administration, including the compensation of district superintendents; central business, legal, and human resource functions; and other expenses, including printing.
State Has Longstanding System for Monitoring Districts’ Fiscal Health. In 1991, the state established a fiscal oversight system requiring COEs to review the financial condition of their school districts at various points during the year. If a COE determines that a district is in fiscal distress, it can undertake additional oversight, such as assigning a fiscal expert or requiring more frequent financial reports from the district. If the district’s financial condition does not improve, the COE can take stronger action, such as rescinding the actions of the district’s governing board. When a district gets to the point of being unable to pay its bills, the state provides an emergency loan so that the district can continue to operate and appoints an administrator to manage the district while it implements a recovery plan. This fiscal oversight system generally has been effective, with only eight districts requiring emergency state loans since 1991. (By comparison, 27 districts required such assistance over the ten years preceding the adoption of the 1991 system.)
Overview of Governor’s Proposition 98 Budget
In this section, we provide a high‑level overview and assessment of the Governor’s Proposition 98 budget package. The first part analyzes the major spending proposals in the package and the second part analyzes the administration’s estimates of the Proposition 98 minimum guarantee.
Major Spending Proposals
Below, we describe the Governor’s Proposition 98 spending package and highlight his major proposals for K‑12 education and preschool. We also provide our assessment of the Governor’s overall spending approach.
Overview
Across Three Years, $6.3 Billion in Proposition 98 Spending Proposals. The Governor’s budget contains a total of $6.3 billion in new Proposition 98 spending proposals (see Figure 8). Of the new spending, almost $5 billion (78 percent) is for K‑12 education, $1.2 billion (19 percent) is for the California Community Colleges (CCC), and $193 million (3 percent) is for the California State Preschool Program. As the figure shows, the spending package consists of a mix of ongoing and one‑time proposals. Across the three segments, $3.9 billion is for ongoing programs and $2.4 billion is for one‑time activities.
Figure 8
Governor’s Budget Contains $6.3 Billion in Proposition 98 Spending Proposals
(In Millions)
|
K‑12 Education |
|
|
Ongoing |
|
|
Fund full implementation of LCFF |
$2,883 |
|
Provide 2.51 percent COLA for select categorical programsa |
106 |
|
Provide county and regional support for low‑performing districts |
76 |
|
Make other ongoing augmentations |
29 |
|
Subtotal |
($3,095) |
|
One Time |
|
|
Provide per‑student discretionary grants |
$1,757 |
|
Establish special education teacher residency program |
50 |
|
Provide grants for addressing special education teacher shortage |
50 |
|
Support Southern California Regional Occupational Center |
3 |
|
Subtotal |
($1,860) |
|
Total |
$4,954 |
|
California Community Colleges |
|
|
Ongoing |
|
|
Increase apportionment funding and implement new allocation formula |
$396 |
|
Fund high school CTE initiative through Strong Workforce Program |
212 |
|
Fund AB 19 fee waiver program and consolidated financial aid program |
79 |
|
Provide ongoing support for new online college |
20 |
|
Make other ongoing augmentations |
51 |
|
Subtotal |
($759) |
|
One Time |
|
|
Fund deferred maintenance and instructional materials |
$275 |
|
Provide one‑time support for new online college |
100 |
|
Fund other one‑time activities |
53 |
|
Subtotal |
($428) |
|
Total |
$1,186 |
|
Preschool |
|
|
Ongoing |
|
|
Increase Standard Reimbursement Rate by 2.8 percent |
$32 |
|
Provide 2.51 percent COLA |
28 |
|
Add 2,959 full‑day slots starting April 1, 2019 |
8 |
|
Subtotal |
($68) |
|
One Time |
|
|
Fund early education expansion |
$125 |
|
Total |
$193 |
|
Grand Total of All Spending Proposals |
$6,333 |
|
aApplies to special education, child nutrition, mandates block grant, services for foster youth, adults in correctional facilities, and American Indian education. LCFF = Local Control Funding Formula; COLA = cost‑of‑living adjustment; and CTE = career technical education. |
|
Per Student Funding Increases Notably. Figure 9 shows the distribution of Proposition 98 funding by segment across the period. Under the Governor’s budget, overall K‑12 funding per student (including preschool and other agencies) increases from the revised 2017‑18 level of $11,165 to $11,628 in 2018‑19, an increase of $463 (4.1 percent).
Figure 9
Proposition 98 Funding by Segment
(Dollars in Millions, Except Funding Per Student)
|
2016‑17 Revised |
2017‑18 Revised |
2018‑19 Proposed |
Change From 2017‑18 |
||
|
Amount |
Percent |
||||
|
Segment |
|||||
|
K‑12 education |
$62,048 |
$65,340 |
$67,695 |
$2,355 |
3.6% |
|
California Community Colleges |
8,283 |
8,654 |
9,207 |
553 |
6.4 |
|
Preschool |
975 |
1,122 |
1,338a |
216 |
19.2 |
|
Other agencies |
85 |
95 |
85 |
‑10 |
‑10.7 |
|
Totals |
$71,390 |
$75,211 |
$78,324 |
$3,114 |
4.1% |
|
Enrollment |
|||||
|
K‑12 average daily attendance |
5,960,037 |
5,961,253 |
5,944,090 |
‑17,163 |
‑0.3% |
|
Community college FTE students |
1,134,809 |
1,135,081 |
1,136,813 |
1,733 |
0.2 |
|
Funding Per Student |
|||||
|
K‑12 educationb |
$10,588 |
$11,165 |
$11,628 |
$463 |
4.1% |
|
California Community Colleges |
7,299 |
7,624 |
8,099 |
475 |
6.2 |
|
aIncludes $125 million for one‑time grants to fund the expansion of early education programs, including preschool. Excluding this amount, the increase from 2017‑18 is $91 million (8.1 percent). bPer‑pupil amount combines funding for K‑12 education, preschool, and other agencies. FTE = full‑time equivalent. |
|||||
K‑12 Education
Funds Full Implementation of LCFF. The Governor proposes a $2.9 billion increase for LCFF to close the remaining gap to the formula targets and provide a 2.51 percent cost‑of‑living adjustment (COLA). Reaching full implementation in 2018‑19 would be two years ahead of schedule. The budget also includes $106 million to provide a 2.51 percent COLA for several categorical programs that remain outside LCFF (most notably special education).
Funds New High School Career Technical Education (CTE) Program Through CCC Budget. The Governor proposes a new $212 million high school career technical education program funded through the existing Strong Workforce Program administered by the community colleges. Of this amount, $200 million is for existing Strong Workforce consortia consisting of colleges, school districts, and industry partners. The consortia, in turn, would allocate the new funds to school districts through competitive grants. The remaining $12 million would fund local industry experts who would provide technical assistance to school districts with CTE programs.
Funds New System of Support for School Districts. The Governor proposes a $76 million package of initiatives to support districts with performance issues. Of this amount, the majority ($55 million) would fund COEs to support districts identified for improvement under the state’s new accountability system. The package also includes $10 million for special education agencies to support districts identified for improvement due to special education performance issues, $7 million for CCEE to provide statewide assistance, and $4 million for selected COEs to serve as regional support leads.
Allocates $1.8 Billion for One‑Time Discretionary Grants. The Governor’s budget includes $1.8 billion for K‑12 discretionary grants. Similar to previous years, funds would be allocated to school districts, COEs, and charter schools on a per‑student basis. The $1.8 billion equates to about $300 per student. From each school district’s discretionary grant amount, the Governor proposes to deduct any outstanding obligations resulting from a settlement agreement over Medi‑Cal billing practices (see the nearby box). The remainder of each district’s discretionary grant amount would be attributed to any outstanding mandate claims. About one‑third of districts have such claims.
Medi‑Cal Billing Settlement
School Districts Are Eligible for Certain Medi‑Cal Reimbursements. Since the mid‑1990s, school districts in California have been eligible to receive a 50 percent federal reimbursement for the cost of administrative activities they perform in support of the Medi‑Cal program. Qualifying activities include outreach and referrals, facilitating Medi‑Cal applications, and arranging transportation to Medi‑Cal service providers. The California Department of Health Care Services (DHCS) administers these reimbursements in association with consortia of local education agencies and other entities.
One‑Time Discretionary Grants Reduced to Pay for Medi‑Cal Billing Settlement. In 2013, the federal government completed a review of the reimbursement program and concluded districts were submitting inflated claims. The DHCS agreed to implement a new reimbursement methodology starting in January 2015. It also agreed to use the claims data collected under the new methodology to adjust previously submitted claims from 2009‑10 through 2014. Any difference between a district’s original claims and the adjusted amounts are to be repaid to the federal government. Developing the procedures for this adjustment and collecting the necessary claims data has taken several years. The Governor’s budget estimates the associated statewide obligation is $222 million. To retire the obligation, the Governor proposes to deduct each district’s individual obligation from its one‑time discretionary grant allocation.
Funds Two One‑Time Initiatives Focused on Special Education Staffing Challenges. The budget funds two initiatives ($50 million each) to improve the recruitment and retention of special education teachers. The first initiative would fund teacher residency programs that pair new special education teachers with experienced mentor teachers. The second initiative would provide grants for locally developed efforts to address special education staffing challenges. The CTC would administer both initiatives as competitive grants.
Preschool
Funds Additional Rate and Slot Increases Consistent With Multiyear Budget Agreement. The Governor’s budget includes $32 million Proposition 98 (and an additional $16 million non‑Proposition 98 General Fund) for a 2.8 percent rate increase. It also provides $8 million for an additional 2,959 full‑day State Preschool slots at school districts and COEs starting April 1, 2019. These increases represent the final augmentations associated with a multiyear child care and preschool budget agreement made by the Legislature and the Governor in 2016‑17. In addition, the budget allocates $28 million in Proposition 98 funding (and $22 million non‑Proposition 98 General Fund) to provide a statutory 2.51 percent COLA for certain preschool and child care programs.
Provides One‑Time Funding for Early Education Expansion. The Governor’s budget provides $125 million in Proposition 98 funding (and $42 million from the federal Temporary Assistance for Needy Families program) for a competitive grant to increase the availability of mainstream early education opportunities for children with disabilities from birth through age 5. The one‑time grant, open to school districts as well as other providers, could be used for a variety of purposes, including staff training and facility renovations.
Comments
Split Between Ongoing and One‑Time Initiatives Is Reasonable. We recommend the Legislature adopt a final budget plan that continues to rely upon a mix of ongoing and one‑time spending. The state has taken such an approach the past several years. Setting aside some funds for one‑time purposes helps the state avoid overcommitting to programs it might be unable to sustain during tighter fiscal times. If school funding were to drop in 2019‑20, the expiration of one‑time initiatives would provide a buffer mitigating reductions to ongoing programs such as LCFF and community college apportionments.
Governor Has Reasonable Set of Priorities, but Some Proposals Are Not Well Targeted. Many of the Governor’s proposals relate to issues of longstanding interest to the Legislature, including implementing LCFF, expanding CTE, improving support for low‑performing districts, addressing special education staffing challenges, and expanding early education. Many of the Governor’s proposals, however, would not address the root problems in the areas. For example, special education teacher shortages stem from several longstanding issues, ranging from a lack of pay differentials to overly restrictive education and credentialing requirements. One‑time grants for a specific type of teacher training program or discretionary local solutions are unlikely to resolve these issues. In response to many of the Governor’s proposals, we offer the Legislature alternatives designed to address root issues. In many cases, these alternatives can be structured to cost less than the funding levels proposed by the Governor.
K‑12 Discretionary Grants Continue an Inefficient Approach to Retiring the Mandate Backlog. We are concerned that the Governor’s per‑student funding approach likely will never eliminate the mandate backlog. With two‑thirds of districts having no claims, the bulk of the $1.8 billion included in the Governor’s budget would have no effect on the backlog. We estimate that the state would need to provide around $200 billion to eliminate the backlog using the Governor’s approach. Moreover, the remaining backlog does not reflect the average district’s claiming practices, but those of an increasingly small number of exceedingly high claimers. As an alternative to the Governor’s approach, we recommend the Legislature identify an amount equal to or in excess of the remaining backlog and distribute funds on a per‑student basis, but require districts receiving funds to write off all remaining claims. This approach would make substantially more progress toward eliminating the backlog without rewarding districts that have unusually costly claims.
Minimum Guarantee
Below, we provide background on the Proposition 98 minimum guarantee. We then explain the major drivers underlying the administration’s estimates of the minimum guarantee and discuss a few other adjustments that free‑up Proposition 98 funding. We conclude by offering high‑level comments about the calculation of the guarantee.
Background on Calculating Minimum Guarantee
Minimum Guarantee Calculation Depends on Various Inputs and Formulas. The Constitution sets forth three main tests for calculating the minimum guarantee. These tests depend upon several inputs, including K‑12 average daily attendance, per capita personal income, and per capita General Fund revenue (see Figure 10). Depending on these inputs, one of these tests will be “operative” and determine the minimum guarantee for that year. In most years, Test 2 or Test 3 is operative and the guarantee builds upon the level of funding provided the previous year. The state meets the guarantee through a combination of General Fund and local property tax revenue, with increases in property tax revenue usually reducing General Fund costs dollar for dollar. Although the state can provide more funding than required, in practice it usually funds at the guarantee. With a two‑thirds vote of each house of the Legislature, the state can suspend the guarantee and provide less funding than the formulas require that year.
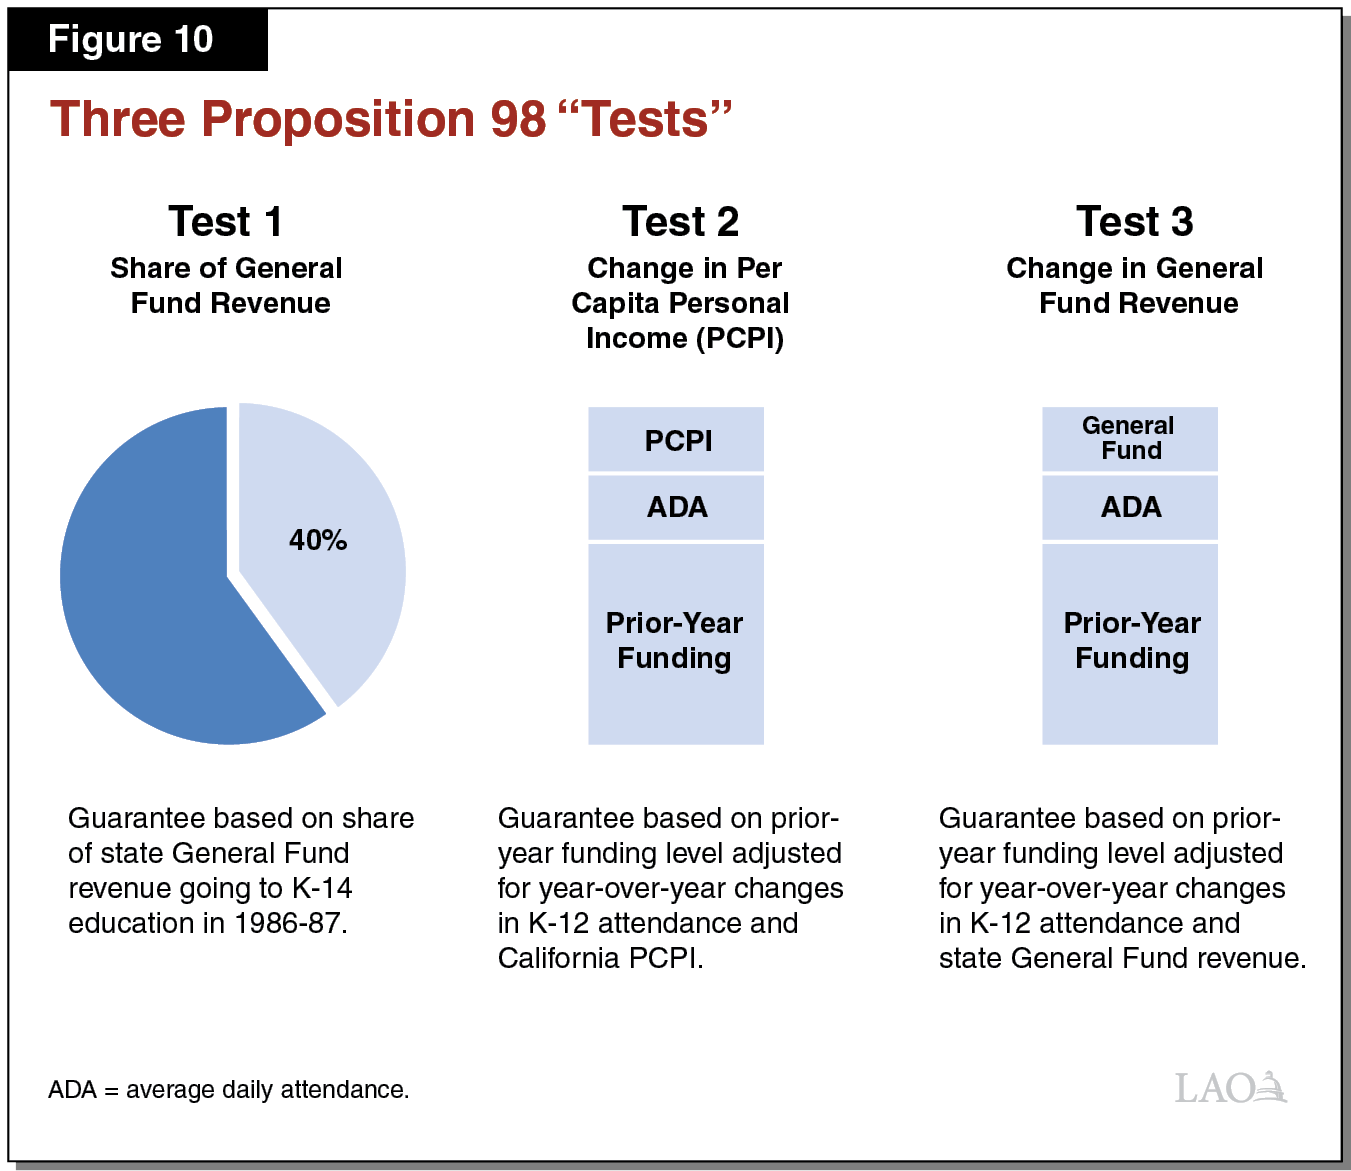
“Maintenance Factor” Payments Required in Certain Years. In addition to the three main tests, the Constitution requires the state to track an obligation known as maintenance factor. The state creates a maintenance factor obligation when Test 3 is operative or when it suspends the guarantee. The obligation equals the difference between the actual level of funding provided and the Test 1 or Test 2 level (generally whichever is higher). Moving forward, the state tracks and adjusts the maintenance factor obligation each year for changes in K‑12 attendance and per capita personal income. In subsequent years, when General Fund revenue is growing relatively quickly, the Constitution requires the state to make maintenance factor payments until it has paid off the obligation. The magnitude of these payments is determined by formula, with stronger revenue growth generally requiring larger payments.
Estimates of the Guarantee Can Change After the Adoption of the Budget. The state does not finalize the minimum guarantee until the fiscal year is over. When the state updates the relevant inputs, the guarantee can change from the level initially assumed in the budget act. If the revised guarantee exceeds the initial estimate, the state makes a one‑time payment to “settle up” the difference for that year and uses the higher base for calculating the guarantee the following year. If the revised guarantee is below the initial estimate, the state can allow funding to remain at the higher level or make midyear adjustments to reduce funding to the lower guarantee. Typically, the state makes downward midyear adjustments, as the decision affects the ongoing level of the minimum guarantee moving forward.
Governor’s Estimates Of the Guarantee
2016‑17 Guarantee Down Slightly but Proposition 98 Funding Level Unchanged. Compared with estimates made in June 2017, the 2016‑17 minimum guarantee has dropped $63 million due to slightly lower estimates of K‑12 attendance and General Fund revenue. Despite this decrease, the Governor proposes to maintain Proposition 98 funding at $71.4 billion—the same level the state approved in the June budget plan. This proposed funding level is $542 million more than required to meet the revised estimate of the minimum guarantee. The budget also recognizes various minor adjustments—primarily lower LCFF costs—that reduce funding by $43 million. To offset these reductions and maintain funding at $71.4 billion, the Governor proposes to count $43 million of the funds associated with the K‑12 discretionary grants toward 2016‑17.
2017‑18 Guarantee Up $687 Million From Budget Act Estimates. The administration’s revised estimate of the 2017‑18 guarantee is $75.2 billion, an increase of $687 million compared with the June budget plan. This increase is mainly the result of an increase in General Fund tax revenue. This faster revenue growth requires the state to make an additional maintenance factor payment of $636 million (on top of the $536 million payment already included in the June budget plan). After making the $1.2 billion total maintenance factor payment, the state’s outstanding maintenance factor obligation at the end of 2017‑18 would be $228 million. The rest of the increase in the guarantee is attributable to a small increase in attendance. Whereas the June budget plan assumed 2017‑18 attendance would decline by 2,900 students (a 0.05 percent decline), the Governor’s budget estimates that attendance will grow by 1,200 students (a 0.02 percent increase).
2018‑19 Guarantee Up $3.1 Billion Over Revised 2017‑18 Level. The administration estimates that the 2018‑19 guarantee is $78.3 billion, an increase of 4.1 percent over the revised 2017‑18 level (see Figure 11). Test 3 is operative, with the increase in the guarantee attributable to growth in state General Fund revenue. The administration also estimates that K‑12 attendance will decline by 0.3 percent. Although the minimum guarantee usually is adjusted for changes in attendance, the Constitution contains a two‑year hold harmless provision that deems any decline in attendance to be zero unless attendance also declined during the two preceding years. Data from CDE show that attendance declined each year from 2014‑15 through 2016‑17. The administration’s estimate of a small attendance increase in 2017‑18, however, restarts the hold harmless provision and prevents any downward adjustment to the 2018‑19 guarantee. The administration also estimates that the state creates a new $83 million maintenance factor obligation in 2018‑19. This additional maintenance factor brings the state’s total outstanding obligation to $320 million by the end of 2018‑19.
Figure 11
Proposition 98 Key Inputs and Outcomes Under Governor’s Budget
(Dollars in Millions)
|
2016‑17 |
2017‑18 |
2018‑19 |
|
|
Minimum Guarantee |
|||
|
General Fund |
$49,993a |
$52,741 |
$54,564 |
|
Local property tax |
21,397 |
22,470 |
23,761 |
|
Totals |
$71,390 |
$75,211 |
$78,324 |
|
Change From Prior Year |
|||
|
General Fund |
$568 |
$2,747 |
$1,823 |
|
Percent change |
1.1% |
5.5% |
3.5% |
|
Local property tax |
$1,718 |
$1,074 |
$1,291 |
|
Percent change |
8.7% |
5.0% |
5.7% |
|
Total funding |
$2,287 |
$3,821 |
$3,114 |
|
Percent change |
3.3% |
5.4% |
4.1% |
|
Operative Test |
3 |
2 |
3 |
|
Maintenance Factor |
|||
|
Amount created (+) or paid (‑) |
$1,279 |
‑$1,172 |
$83 |
|
Total outstandingb |
1,350 |
228 |
320 |
|
Growth Rates |
|||
|
K‑12 average daily attendance |
‑0.2% |
0.02% |
‑0.3%c |
|
Per capita personal income (Test 2) |
5.4 |
3.7 |
4.3 |
|
Per capita General Fund (Test 3)d |
2.7 |
6.0 |
4.1 |
|
aIncludes General Fund provided on top of the minimum guarantee. bOutstanding maintenance factor is adjusted annually for changes in K‑12 attendance and per capita personal income. cUnder the two‑year hold harmless provision in the State Constitution, the 2018‑19 guarantee is calculated as though attendance is flat in 2018‑19. dAs set forth in the State Constitution, reflects change in per capita General Fund plus 0.5 percent. |
|||
Higher Local Property Tax Revenue Over the Period Reduces General Fund Cost Pressure. For 2016‑17, the administration revises its property tax estimate upward by $495 million to reflect updated data reported by county auditor‑controllers. For 2017‑18, the administration revises its property tax estimate upward by $578 million. The bulk of this increase reflects the prior‑year increase carrying forward. The administration also assumes assessed property values will grow slightly faster than 2017‑18 Budget Act estimates (rising 6 percent rather than the earlier estimate of 5.3 percent). For both 2016‑17 and 2017‑18, the upward revisions result in a dollar‑for‑dollar reduction in General Fund spending. For 2018‑19, the administration estimates property tax revenue will increase $1.3 billion from the revised 2017‑18 level (see Figure 11). This increase mainly reflects a 5.6 percent increase in assessed property values. The higher property tax revenue in 2018‑19 covers about 40 percent of the estimated increase in the minimum guarantee that year.
Additional Proposition 98‑Related Funding
Budget Includes $2.5 Billion in Additional One‑Time Funding. Separate from the increases in the 2017‑18 and 2018‑19 minimum guarantees, the Governor’s budget contains $2.5 billion in Proposition 98 funding attributable to other adjustments. The largest of these adjustments is the expiration of $2.2 billion in one‑time initiatives funded in 2017‑18, with the associated funding repurposed for new commitments in 2018‑19. In addition, the budget identifies and repurposes $214 million in unspent funds associated with previous years (primarily 2015‑16 and 2016‑17). The Governor also proposes to make a $100 million settle‑up payment related to meeting the 2009‑10 guarantee (scored as a Proposition 2 debt payment). This payment would reduce the state’s outstanding settle‑up obligation to $340 million. Finally, the budget recognizes various technical adjustments (primarily lower‑than‑expected costs for community college apportionments) that free up a net total of $37 million. The $2.5 billion associated with all these adjustments, combined with the $687 million increase in the 2017‑18 guarantee and $3.1 billion increase in the 2018‑19 guarantee, accounts for the $6.3 billion total spending included in the Governor’s Proposition 98 package.
Comments
2017‑18 Attendance Assumptions Have Significant Implications. The administration’s assumption of attendance growth in 2017‑18 is a significant development because it restarts the hold harmless provision and prevents a $230 million decline in the 2018‑19 guarantee that otherwise would occur. Under our November outlook, we projected that attendance would decline even faster than the administration assumes in 2018‑19, with the potential associated reduction in the guarantee equating to more than $400 million. We recommend the Legislature carefully scrutinize preliminary 2017‑18 attendance data—likely available in March—to determine whether growth is likely to materialize in 2017‑18. If growth does not materialize, the 2018‑19 guarantee could be several hundred million dollars below the level the administration currently assumes. The assumption about growth in 2017‑18 also has significant implications for estimates of the 2019‑20 guarantee, given that the hold harmless provision applies for two years and both our office and the administration assume attendance declines in 2019‑20.
Administration’s Property Tax Estimates Appear Reasonable. The administration’s property tax estimates for 2016‑17 generally reflect the latest available data and are likely close to the final amounts for the year. For 2017‑18 and 2018‑19, the administration’s estimated growth in assessed property values seems consistent with the continued strength of the state’s real estate market. Over the three‑year period, the administration’s estimates are $248 million above our November 2017 estimates, though this difference amounts to less than 0.4 percent of all property tax revenue collected during the period.
Further Upward Revisions to General Fund Revenue Unlikely to Increase Minimum Guarantee Significantly. In most years, increases in General Fund revenue lead to increases in the Proposition 98 minimum guarantee. These increases often reflect higher required Proposition 98 maintenance factor payments. The Governor’s budget, however, already assumes the state pays off most of its maintenance factor obligation by the end of 2017‑18. The Governor’s budget also assumes the guarantee is already growing at the same rate as per capita personal income in 2017‑18 and only slightly below this rate in 2018‑19. Under these conditions, increases in General Fund revenue tend to have only modest effects on the minimum guarantee. Given these factors, we estimate the 2017‑18 and 2018‑19 guarantees likely would not increase more than a few hundred million dollars even if revenues increased several billion dollars from the Governor’s January budget level.
Local Control Funding Formula
In this section, we focus on LCFF. The section has three parts. We first look at issues relating to the full implementation of LCFF. We then present data on how high‑poverty and low‑poverty schools have spent their LCFF funding increases in recent years. We end by discussing several options for allocating any Proposition 98 funding above the full implementation cost of LCFF.
Full Implementation
Below, we provide background on LCFF and analyze the Governor’s proposal to fully fund the formula in 2018‑19.
Background
State Enacted New School Funding Formula in 2013‑14. Five years ago, the state enacted major changes to the way it funds school districts and charter schools. Previously, the state allocated school funding through a combination of general purpose grants (called “revenue limits”) and more than 40 state categorical programs. Districts could use general purpose grants for any educational purpose but had to spend categorical funding on state‑prescribed activities. In 2013‑14, the state eliminated most categorical programs, replacing all the previous program‑specific funding formulas with one new formula.
LCFF Formula Has a Per‑Student Base Grant. The largest component of LCFF (accounting for about 80 percent of the formula’s total cost) is a base grant generated by each student. Base rates vary across four grade spans, with students in higher grades generally generating more funding than those in lower grades. In establishing the base rate for high school, the state built in an amount to recognize the shift of responsibility for career technical education from regional entities to school districts. In establishing the K‑3 base grant, the state built in an amount to recognize the desire for smaller class sizes in the early grades. In setting the initial target base rates for each grade span, the state increased funding over existing average levels by about $500 per student.
Formula Allocates Additional Funding for English Learners and Low‑Income (EL/LI) Students. In addition to the base grant, districts receive funding for serving EL/LI students. Under LCFF rules, a student who is only EL or only LI generates the same amount of funding as a student who is both EL and LI. For each EL/LI student, a district receives a supplemental grant equal to 20 percent of the base grant. This funding largely is intended to address the individual challenges EL/LI students face—for example, needing to learn English or having access to few learning materials at home. Districts serving a student population more than 55 percent EL/LI also receive a concentration grant funding equal to 50 percent of the base grant for each EL/LI student above the 55 percent threshold. This funding largely is intended to address broader challenges affecting higher‑poverty communities.
Both Individual and Community Factors Contribute to Achievement Gap. Figure 12 shows how both individual‑ and district‑level challenges contribute to the achievement gap. Although low‑income students perform worse than non‑low‑income students regardless of which districts they attend, both student groups in high‑poverty districts perform notably worse than peers in low‑poverty districts. (Throughout this section, we define high‑poverty districts as those serving more than 80 percent EL/LI students, and low‑poverty districts as those serving less than 50 percent EL/LI students. To isolate the effects of LCFF in our later analysis, we also exclude basic aid districts.) The relatively poor performance of high‑poverty districts widens the statewide achievement gap because low‑income students are disproportionately likely to attend such districts. An important caveat is that the state’s method for identifying low‑income students is broad and includes students of varied backgrounds. Low‑income students attending high‑poverty districts may face more individual‑level challenges than their peers attending low‑poverty districts. The same could be true for the non‑low‑income students attending these districts.
An Illustration of Two Districts’ LCFF Calculations. Figure 13 shows the LCFF calculation for two equally sized elementary school districts. Both districts serve the same number of students in each of the K‑3 and 4‑6 grade spans, so they generate the same amount of base funding. District A serves a notably higher share of EL/LI students than District B (91 percent compared to 50 percent) and thus generates more supplemental funding. District A also has a student population that is more than 55 percent EL/LI and thus generates concentration funding. Given these differences in student demographics, District A receives a total of $449,000 more than District B—$2,041 (24 percent) more per student.
Figure 13
Illustration of LCFF Calculation for Two Elementary Districts
Underlying Funding Rates Based on 2018‑19 Governor’s Budget
|
District A |
District B |
Difference |
|||
|
District Characteristics |
|||||
|
Grade K‑3 attendance |
100 students |
100 students |
— |
||
|
Grade 4‑6 attendance |
120 students |
120 students |
— |
||
|
EL/LI percentagea |
91% |
50% |
41% |
||
|
LCFF Funding |
|||||
|
Base funding |
$1,712,000 |
$1,712,000 |
— |
||
|
Supplemental funding |
312,000 |
171,000 |
$141,000 |
||
|
Concentration funding |
308,000 |
— |
308,000 |
||
|
Totals |
$2,332,000 |
$1,883,000 |
$449,000 |
||
|
aEL/LI students as a share of total enrollment. LCFF = Local Control Funding Formula and EL/LI = English learner/low‑income students. |
|||||
Regulations Restrict the Use of EL/LI Funding. State law directed SBE to develop specific regulations guiding the use of supplemental and concentration grant funding. These regulations require districts to use these funds for the benefit of EL/LI students. Districts could use the funds for supplemental services, such as counseling or after school programs for these populations. They also could use these funds on districtwide purposes (including across‑the‑board teacher salary increases) if they can document how these districtwide expenditures will benefit their EL/LI students. State law requires each district and charter school to document their use of supplemental and concentration grant funding in their LCAPs, which are reviewed by COEs to ensure the plans comply with state spending restrictions.
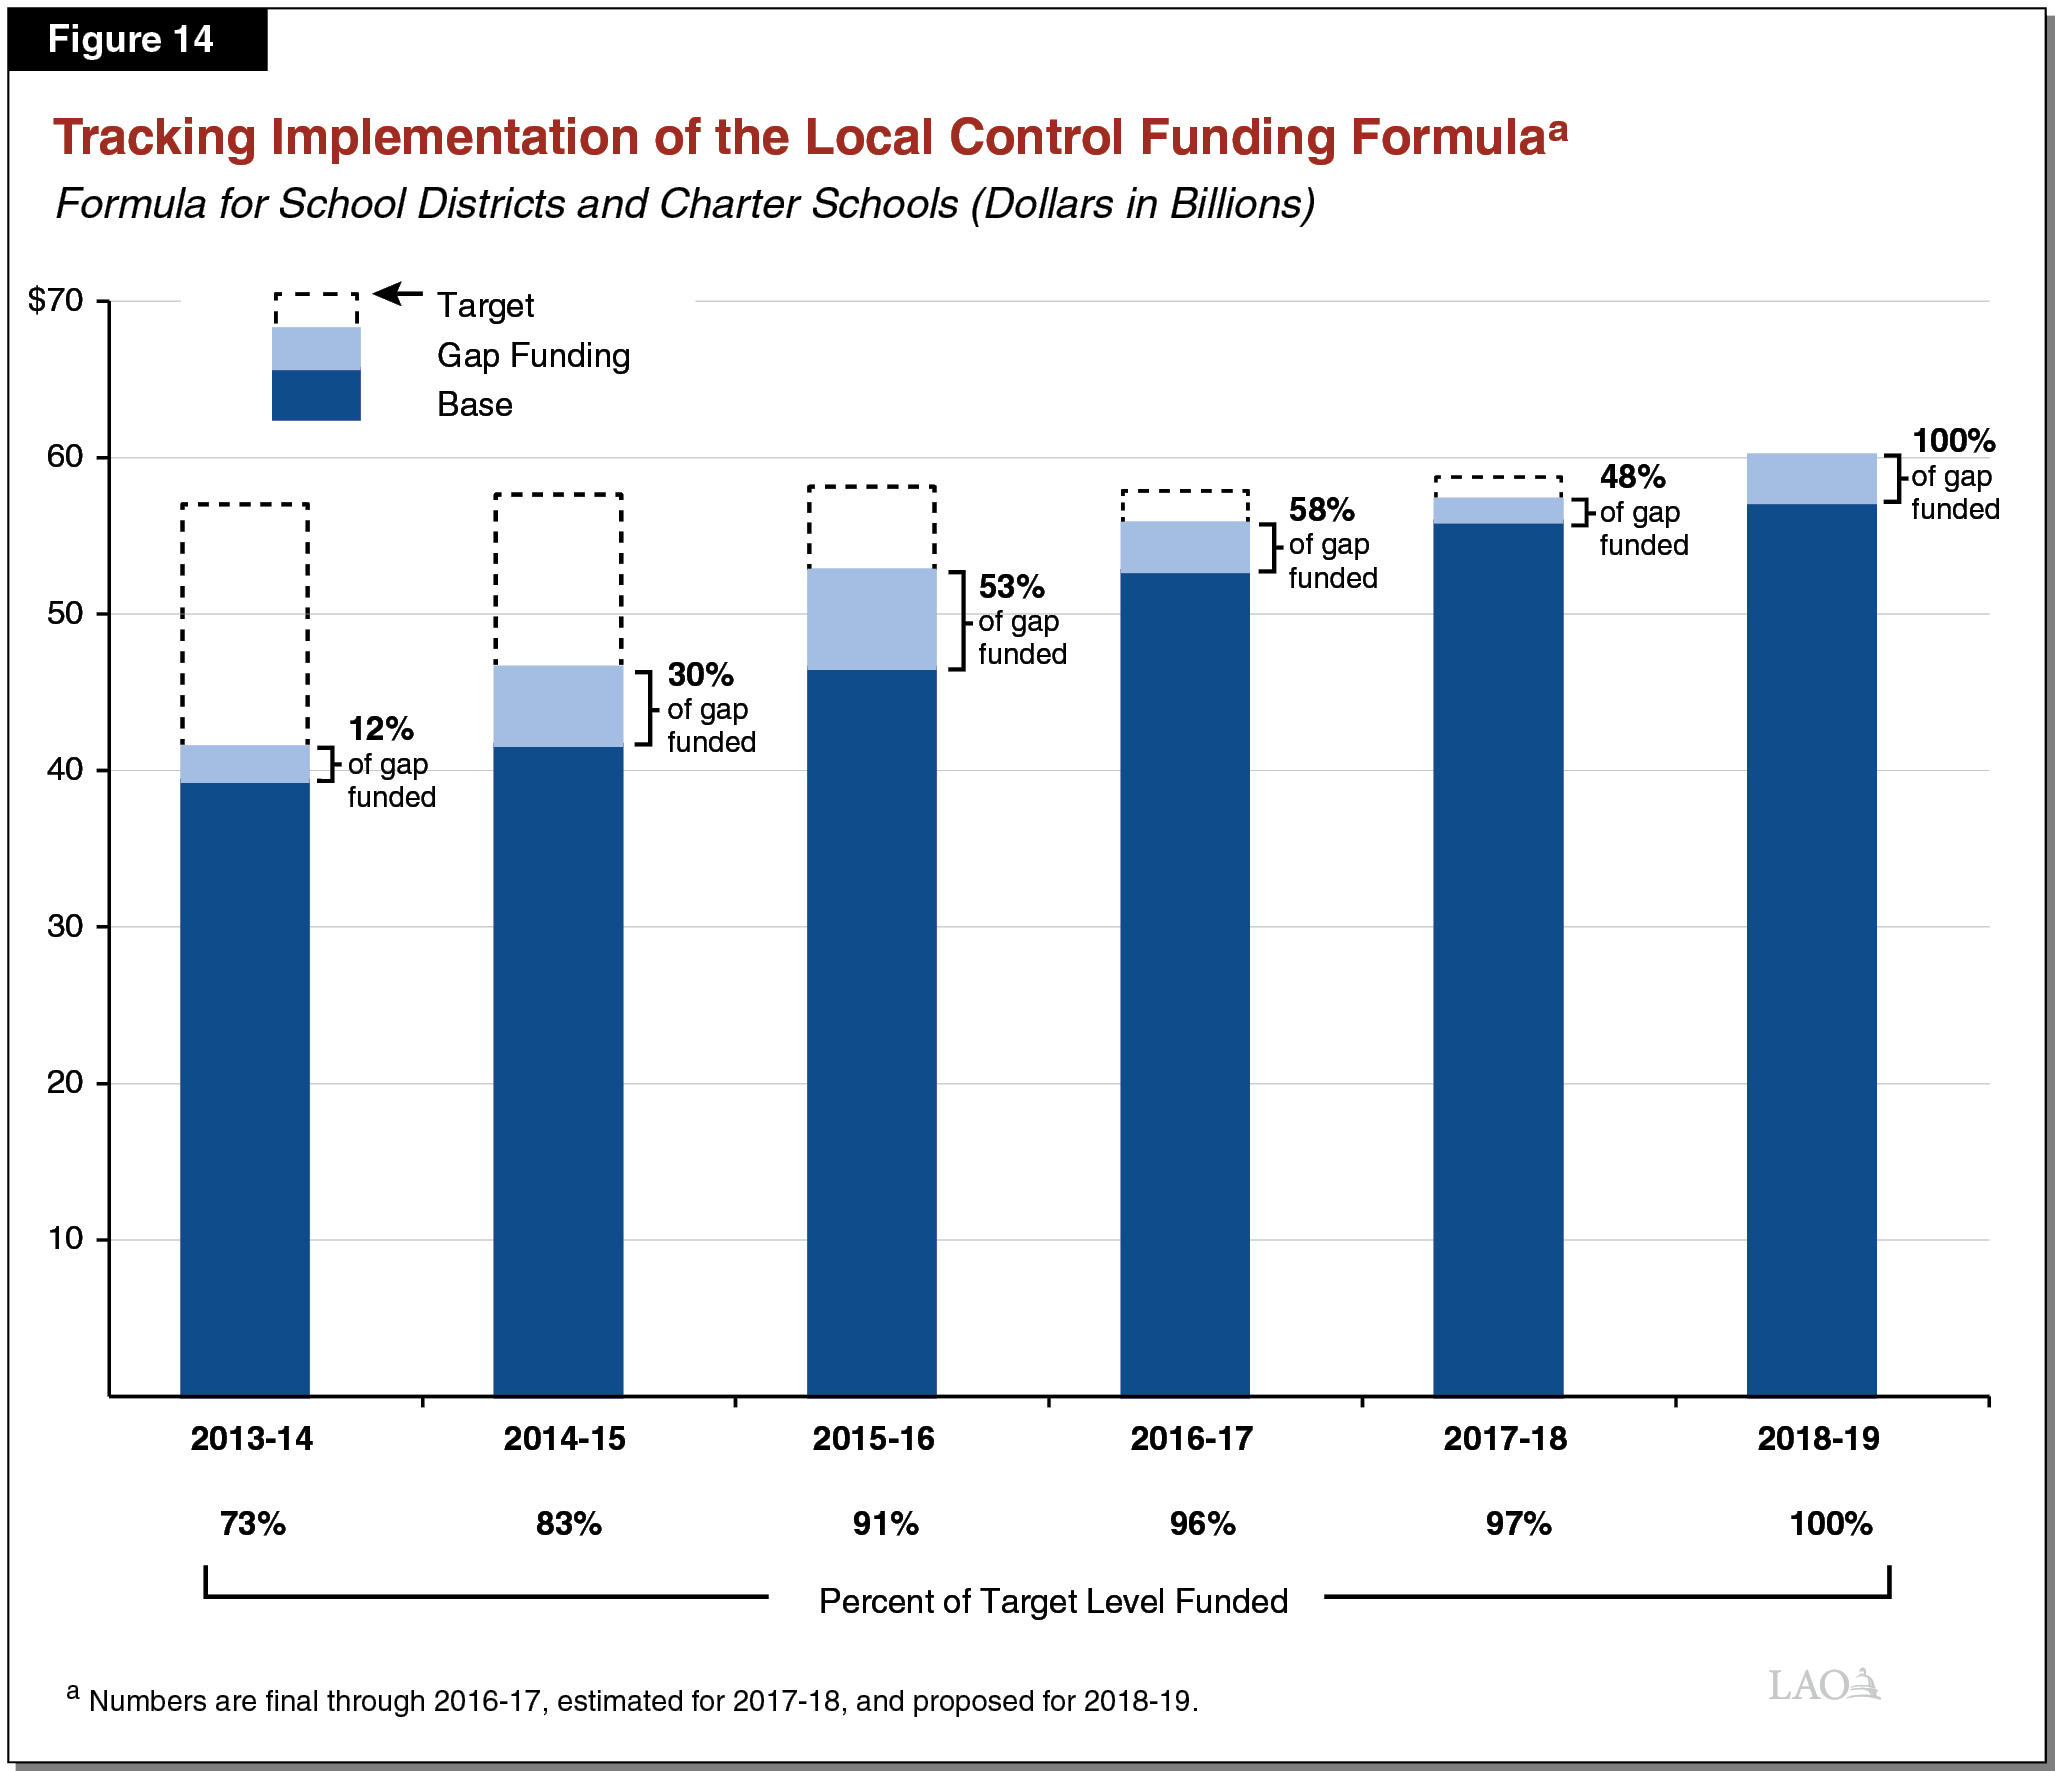
Full Implementation Was Expected to Take Several Years. Given the higher target funding rates under LCFF compared to the state’s former school funding system, full LCFF implementation initially was estimated to cost $18 billion more than the previous system. Starting in 2013‑14, the state augmented LCFF funding to close the difference (or gap) between prior‑year funding levels and the formula’s full implementation cost. Based on projections of growth in Proposition 98 funding, the administration estimated the state would reach full LCFF implementation in 2020‑21. Over the past five years, the state has provided $17.1 billion towards implementing the formula. As Figure 14 shows, LCFF was 73 percent‑funded in 2013‑14 and is 97 percent‑funded in 2017‑18.
Governor’s Proposal
Fully Implements LCFF. The Governor proposes a $2.9 billion (5.4 percent) augmentation in 2018‑19—bringing total LCFF funding to $60.3 billion. Of the $2.9 billion augmentation, we estimate $1.2 billion is necessary to cover a 2.51 percent COLA to the formula’s target rates. The remaining $1.7 billion covers 100 percent of the “gap” between last year’s funding level and the formula’s full implementation cost.
Proposes Addendum to District Budgets. The administration indicates it would like districts to improve how they show alignment between their budgets and their LCAP goals. Specifically, the administration proposes trailer bill language directing SBE to design a template for an addendum to district budgets. Districts would need to begin using the template starting in 2019‑20.
Assessment
Prioritizing LCFF Implementation Consistent With State’s Prior‑Year Actions. The Governor’s plan to dedicate most new ongoing K‑12 funding to LCFF implementation is consistent with the Legislature’s approach over the past five years. By continuing to prioritize LCFF implementation, both the Governor and the Legislature would be fostering greater local control and flexibility while simultaneously providing more funding for disadvantaged students.
Proposed Budget Addendum Adds Work but Little Value. State law already requires districts to align their budgets with their LCAP goals, and districts’ LCAPs already document how these goals are linked to specific expenditures. Although we agree with the administration that current LCAPs are difficult for most parents to digest, this is primarily because of their length (often running over 100 pages) and complexity. Adding an addendum to district budgets—another long and complex document—seems counterproductive. Consequently, we recommend the Legislature reject the Governor’s proposal and focus instead on simplifying LCAPs.
At Full Implementation, Districts Are Required to Show How All EL/LI Funds Benefit EL/LI Students. Prior to full implementation, regulations do not require districts to spend their entire supplemental and concentration grant allotments on EL/LI services. Rather, the regulations require districts to spend a growing portion of this funding on EL/LI services. At full implementation, the regulations no longer focus on incremental increases but on districts’ entire EL/LI allotments. Some school districts have expressed concern that at full implementation they will need to make major budget adjustments to ensure they are meeting the higher spending requirement.
At Full Implementation, Districts Unlikely to Have to Change EL/LI Spending Significantly. To evaluate these concerns, we reviewed approximately 100 LCAPs for the 2016‑17 school year. Specifically, for each LCAP, we identified the amount the district reported spending for EL/LI students. Although current regulations allow districts to spend less than their total EL/LI allotment on supplemental services, we found the average district already spent 84 percent of its entire supplemental and concentration grants on such services. To reach 100 percent at full implementation, districts statewide would have to increase spending on EL/LI students by about $1.5 billion over two years—2017‑18 and 2018‑19. This is a notable but seemingly manageable increase, as districts increased spending on these students by about $6 billion from 2013‑14 through 2016‑17—or about $1.5 billion per year.
Going Forward, Legislature Has Many Options for Allocating Additional Funding. In recent years, the Legislature has dedicated most new Proposition 98 funding to implementing LCFF. In 2018‑19, the Legislature has about $1 billion in new Proposition 98 funding above the cost of fully implementing LCFF. In some future years, the state likely will face a similar scenario, with growth in Proposition 98 funding outpacing growth in LCFF costs. In allocating additional funds, the Legislature will have many options to weigh. In the remaining two parts of this section, we provide context to inform these decisions—first providing a high‑level review of how LCFF affected school spending the past few years and then discussing various options for allocating additional funding moving forward.
A Look Back: School Spending Decisions
Legislators and advocates both have expressed interest in understanding how schools have spent the billions of dollars in new funding they have received under LCFF. In particular, many have asked to what extent the supplemental and concentration dollars generated by EL/LI students have been spent on supplemental services versus across‑the‑board increases in teacher salaries. Relatedly, many have asked whether and to what extent LCFF has helped close the achievement gap between EL/LI and non‑EL/LI students. Below, we address these questions by providing a high‑level comparison of how LCFF funding increases were spent by low‑poverty and high‑poverty districts and tracking the achievement gap over the past few years.
Findings
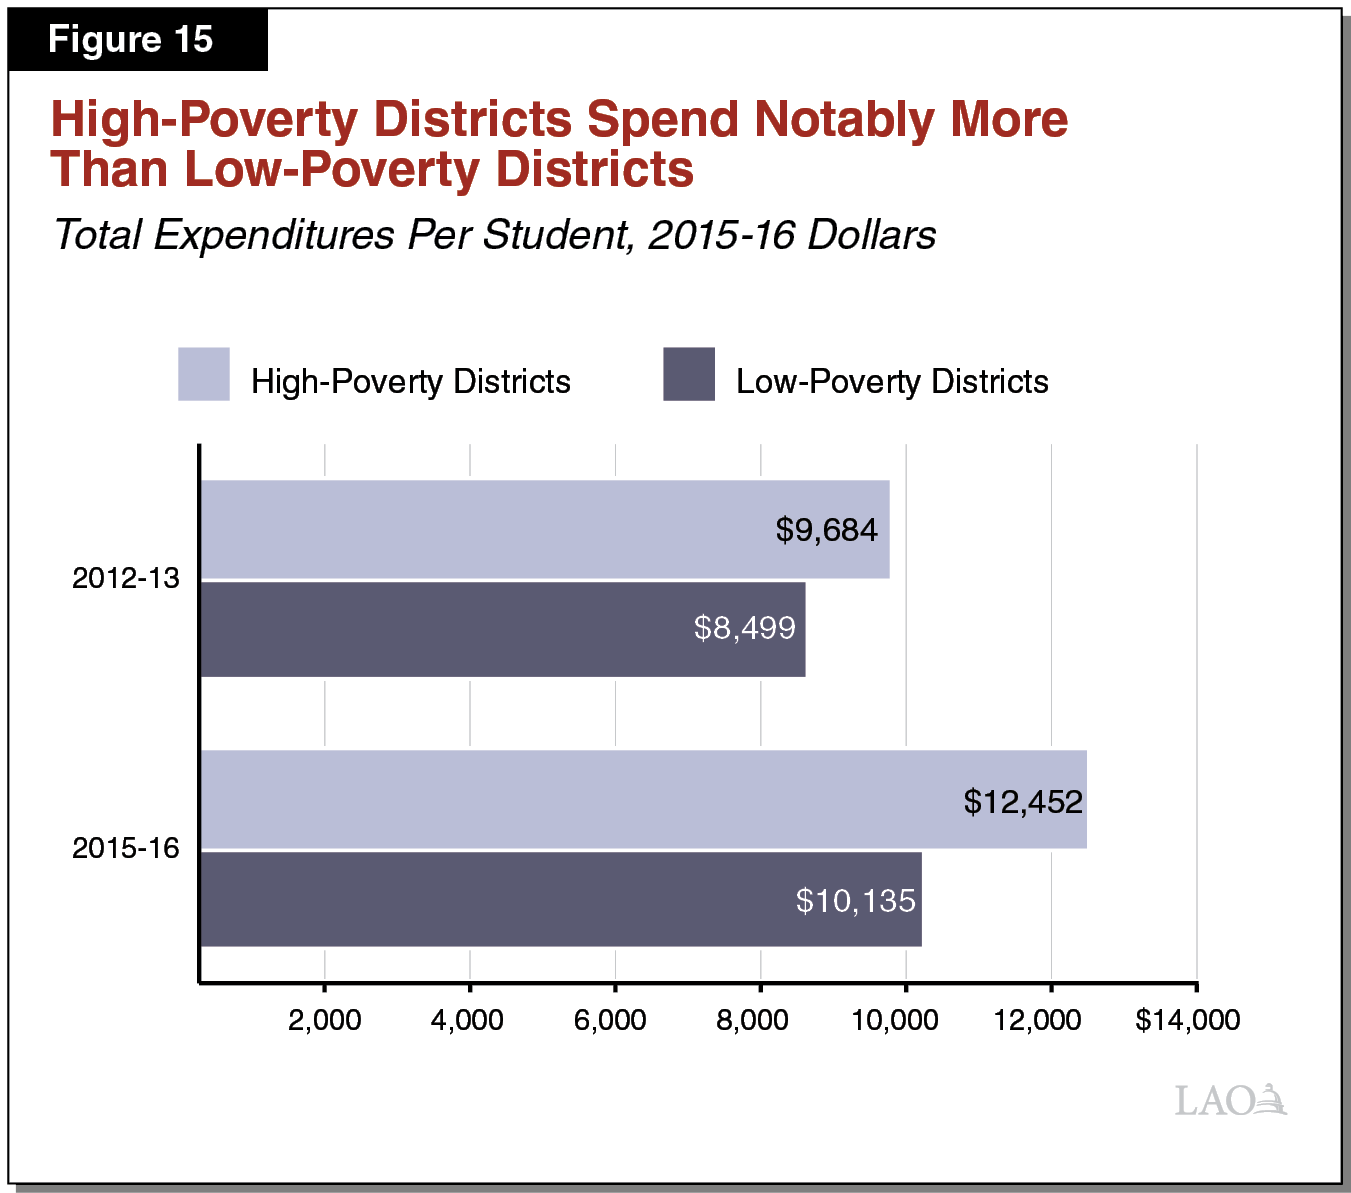
High‑Poverty Districts Have Seen Particularly Large Revenue Increases Since LCFF Was Enacted. Figure 15 compares the inflation‑adjusted, per‑student expenditures for low‑poverty and high‑poverty districts in 2012‑13 and 2015‑16, the most recent year for which LCFF expenditure data are available. Even before LCFF, high‑poverty districts spent on average 14 percent more than low‑poverty districts, primarily because they received state and federal categorical funding for serving EL/LI students. The LCFF directed even more state funding for EL/LI students such that, in 2015‑16, high‑poverty districts spent on average 23 percent more than low‑poverty districts.
Spending Decisions Differ Notably Between Low‑Poverty and High‑Poverty Districts. Figure 16 shows how low‑poverty and high‑poverty districts spent their LCFF funding increases. Notably, whereas low‑poverty districts spent 63 percent of their increased funding on teachers, high‑poverty districts spent 49 percent of their increased funding on teachers. Low‑poverty districts also spent a notably smaller share of their funding increases on materials and other expenses (16 percent) than high‑poverty districts (28 percent).
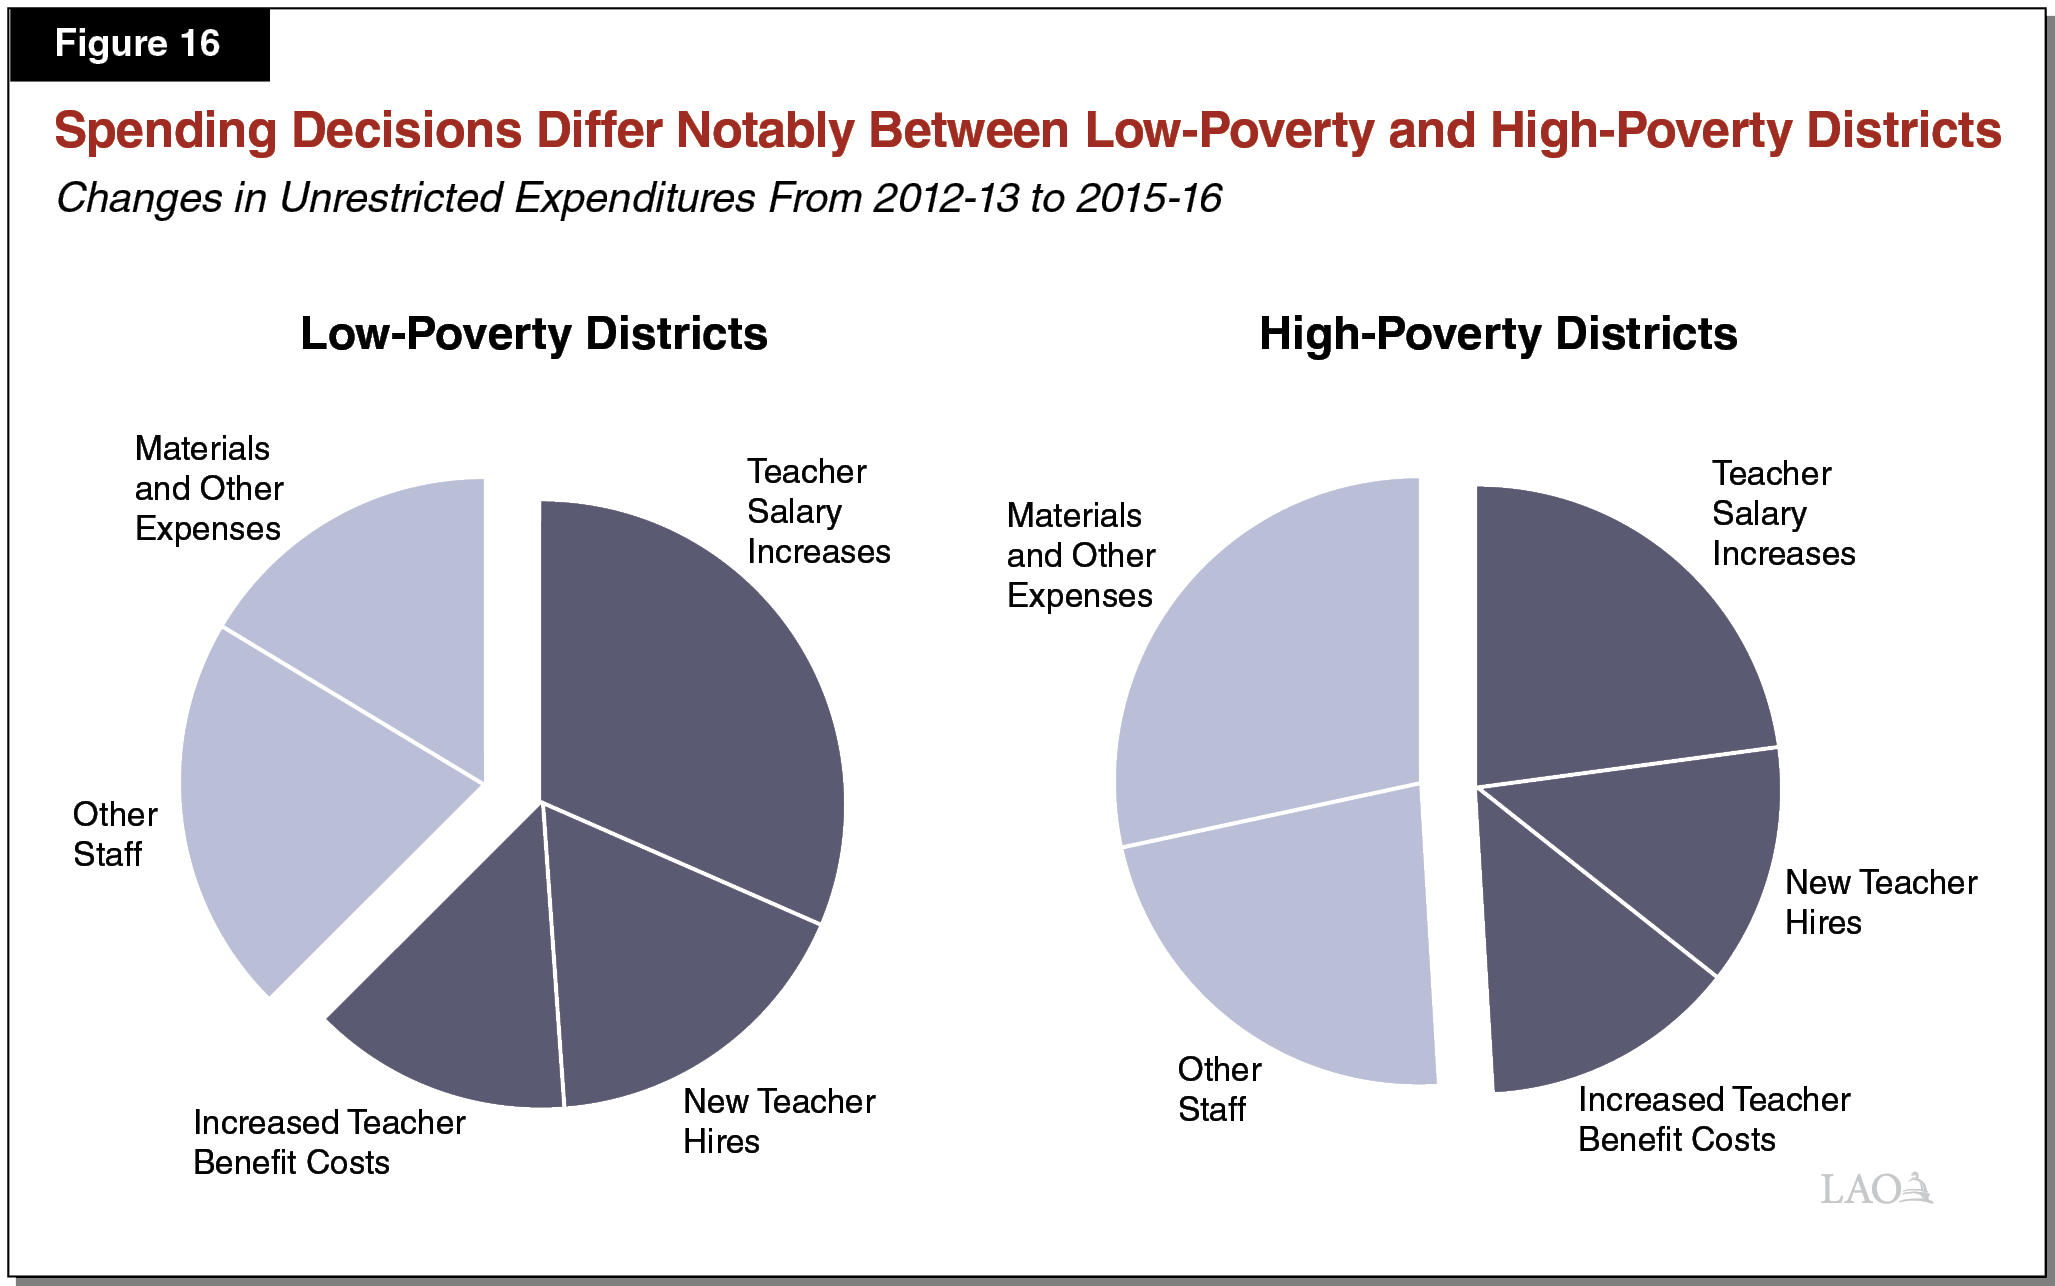
LCAPs Indicate EL/LI Funding Primarily Funds Supplemental Services. The statewide expenditure data discussed above suggest high‑poverty districts have in many cases used supplemental and concentration grant funding for targeted EL/LI services rather than teacher salaries. Our review of the approximately 100 district LCAPs supports this finding. We found most LCAPs detailed using supplemental and concentration grant funding to purchase instructional materials for English learners, provide additional student support staff (such as counselors) for high‑poverty schools, and develop professional development for teachers serving EL/LI students, among similar uses.
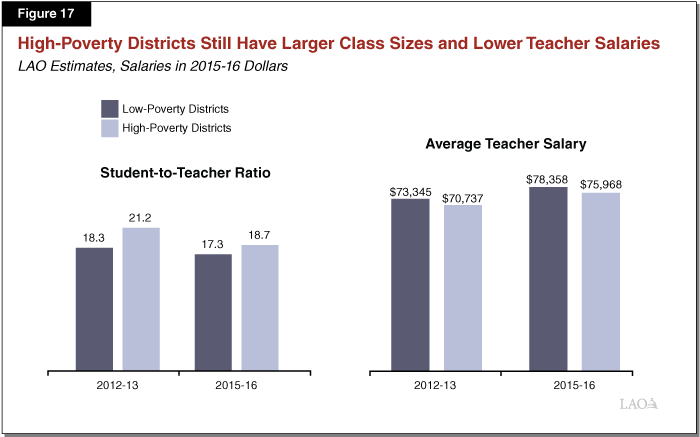
High‑Poverty Districts Continue to Have Larger Classes, Pay Lower Teacher Salaries. Despite having long received more funding per student than low‑poverty districts, high‑poverty districts traditionally have had both larger class sizes and less competitive teacher pay. Figure 17 shows these gaps persist despite the large funding increases high‑poverty districts have received under LCFF. The gaps, however, have narrowed somewhat. Though the student‑to‑teacher ratio declined for both groups of districts from 2012‑13 to 2015‑16, the percentage decline was greater for high‑poverty districts (12 percent) than low‑poverty districts (5 percent). Similarly, the average teacher salary increased for both groups of districts, but the percentage increase was slightly greater for high‑poverty districts (7.4 percent) than low‑poverty districts (6.8 percent).
Achievement Gap Persists Under First Few Years of LCFF. Despite relatively large funding increases for high‑poverty districts, EL/LI students continue to trail their non‑EL/LI peers on statewide assessments. For example, 36 percent of low‑income students met or exceeded state standards in eighth grade English language arts in 2017, compared with 68 percent of non‑low‑income students. The gaps are similar at other grade levels, for math, and also between English learners and non‑English learners. Achievement gaps have remained largely unchanged since the current statewide assessments were introduced in 2015‑16. California’s achievement gap between low‑income and non‑low‑income students also remained largely unchanged on the National Assessment of Educational Progress between 2012‑13 and 2015‑16.
A Look Ahead: Future Funding Decisions
Below, we briefly discuss some of the options the Legislature has for allocating additional Proposition 98 funding once full LCFF implementation is reached. Specifically, we focus on six possible options: (1) increasing base rates, (2) increasing supplemental/concentration rates, (3) changing rules for how districts generate EL/LI funding, (4) focusing concentration funding on the highest‑poverty districts, (5) providing clearer guidance and/or more flexibility for how high‑poverty districts may use EL/LI funding, and (6) creating new categorical programs.
Options for Legislative Consideration
Increased Base Rates Would Help All Districts on Multiple Fronts. In particular, all districts are facing significant pressures related to increased pension costs. Additionally, nearly all districts have experienced notable increases in special education expenditures in recent years and have redirected a growing share of their LCFF dollars to special education. (These latter pressures appear to be driven by a notable increase in the number of students diagnosed with autism.) Increased base rates would provide both high‑ and low‑poverty districts additional general purpose funding to accommodate these cost pressures. We estimate a 1 percent increase in LCFF base rates would cost about $600 million. Because supplemental and concentration grants are calculated as a percentage of base rates, an increase in base rates also would increase EL/LI funding. Specifically, of the $600 million needed to increase base rates by 1 percent, we estimate about $100 million would go towards increased supplemental and concentration grants.
Increased Supplemental and Concentration Rates Would Signal Greater Focus on EL/LI Students. In setting the supplemental and concentration rates, the state considered the additional cost of educating EL/LI students, including the cost of supplemental services like English language instruction and counseling. Current research, however, offers no consensus on exactly how much more it costs to educate an EL/LI student effectively compared to a non‑EL/LI student. Given that high‑poverty districts continue to have larger class sizes and less competitive teacher pay, coupled with the size and persistence of California’s achievement gap, policymakers might reasonably conclude that existing EL/LI funding rates are insufficient to compensate for the many socioeconomic factors contributing to poor student outcomes. We estimate a 1 percentage point increase in the supplemental rate (from 20 percent to 21 percent) would cost about $200 million, whereas a 1 percentage point increase in the concentration rate (from 50 percent to 51 percent) would cost about $60 million.
Changing Rules for Generating EL/LI Funding Could Help Students With the Greatest Challenges. Currently, the state treats a student with one identified cost factor (for example, being an English learner) the same as a student with multiple identified cost factors (for example, being an English learner, low‑income, and in the foster system). Policymakers could reasonably question this policy, as students with a greater number of risk factors might be more costly to educate and support. Whereas low‑income students tend to benefit from counseling, tutoring, after school programs, and other wraparound support, a low‑income English learner likely could benefit from these types of services as well as specific support in learning English. In the same vein, a foster youth lacking any family support might benefit from more intensive counseling and wraparound support than other low‑income students. To address these cost differences, the state could change the rules for generating EL/LI funding such that a student with multiple identified cost factors counted multiple times. At current LCFF rates, we estimate it would cost about $2 billion to allocate supplemental funding based on duplicated EL/LI student counts.
Raising Concentration Threshold Would Target Funding to Highest‑Poverty Districts. Under LCFF, 58 percent of districts receive concentration funding. This suggests EL/LI funding is not particularly targeted to the state’s highest‑poverty districts. If the Legislature wished to increase funding for these districts, it could raise the threshold for generating concentration grant funding above 55 percent EL/LI while also increasing the concentration funding rate. For example, we estimate setting the concentration threshold at 80 percent EL/LI while holding overall concentration spending constant would increase per‑student funding by $750 in the 25 percent of districts serving the state’s highest‑poverty communities.
Providing More Flexibility to High‑Poverty Districts Could Help Them Improve Core Programs. Our findings regarding how high‑poverty districts are using their LCFF funding increases suggest districts generally have followed a narrow interpretation of state spending restrictions (for example, purchasing supplemental instructional materials). They have largely not taken advantage of regulatory provisions that would allow them to spend EL/LI funding on districtwide purposes (for example, improving the competitiveness of teacher salaries). If the Legislature were to provide clearer guidance and/or relax existing spending restrictions for high‑poverty districts, those districts might begin improving their core services—hiring more teachers, reducing class size, and paying teachers more—which, in turn, could have greater benefit for EL/LI students than additional supplemental services.
New Categorical Programs Would Ensure Spending on Legislative Priorities. Some policymakers have expressed concern that under LCFF districts have insufficiently prioritized programs such as after school activities or CTE. One way to ensure increased expenditures on legislative priorities is to introduce or augment funding for categorical programs. This approach, however, has the same drawbacks as the state’s previous school finance system—namely increased complexity, greater administrative burden, and an emphasis on siloed, compliance‑based school budgeting as opposed to a coordinated focus on student outcomes.
Important to Decide Core Policy Objectives. In considering these options, we recommend the Legislature first decide which policy objectives to prioritize. Among the potentially competing objectives are: helping districts accommodate broad‑based cost increases, mitigating socioeconomic factors contributing to the achievement gap, improving the educational resources and core programs offered by high‑poverty districts, increasing spending on certain legislative priorities, and allowing local leaders the flexibility to develop budgets responsive to local needs. The Legislature has options for achieving each of these objectives and could address several simultaneously by combining some of the options discussed above. For example, by increasing the threshold for generating concentration funding from 55 percent to 80 percent EL/LI and increasing concentration rates while also eliminating any restrictions on the use of this funding, the Legislature could enable high‑poverty districts to improve their core educational programs while still ensuring EL/LI funding is used primarily for the benefit of disadvantaged students.
Statewide System of Support
In this section, we first provide an overview of California’s system for supporting districts with identified performance issues. We then describe and assess the Governor’s package of support proposals and end by offering associated recommendations.
Background
For Decades, California Has Supported LEAs Identified With Poor Performance. Since 1977, the state has spent billions of dollars to improve outcomes in schools and school districts. These programs typically have had some methodology for identifying schools and districts in need of support and a requirement that schools and districts create improvement plans. Some of the programs have been optional, others mandatory. The most recent programs have focused at the district level and tailored support depending on the severity and persistence of a district’s problems. The programs have tended to rely heavily on COEs to provide support.
LCFF Legislation Includes New Framework for Measuring LEA Performance . . . Chapter 47 of 2013 (AB 97, Committee on Budget) specifies eight state priority areas intended to encompass the key ingredients of high‑quality educational programs. For each of these priority areas, Chapter 47 lists specific performance measures. In the spring of 2017, SBE released the School Dashboard, a website that displays school and district performance measures. The Dashboard currently displays results on four measures—student test scores, English learner progress, graduation rates, and suspension rates. Over the next couple of years, as data becomes available, the Dashboard also will include chronic absenteeism rates and a college and career indicator.
. . .And New Framework for Supporting LEAs Identified as Having Poor Performance. Under the new framework, results on the above performance measures are used to identify LEAs that have poor performance. Similar to former state approaches, state law sets forth levels of support depending on the severity and persistence of a district’s performance problems. Although statute sets forth the framework for this system, the details of how support will be provided have yet to be developed.
Framework Includes Three Levels of Support. In developing the new framework, SBE has identified three levels of support:
- Support for All LEAs (Level 1). All LEAs have access to a variety of support intended to help them access information on best practices and improve their student performance. For example, COEs provide support to districts in developing their LCAPs.
- Individually Tailored Support (Level 2). A district that is identified as having poor performance for at least one student group in two or more state priority areas is to receive individually tailored assistance. Under current law, identified districts must receive assistance from their COE. The COE is to do one of three things: (1) conduct a “root cause” analysis to assess a district’s strengths and weaknesses and identify the primary causes of its performance issues, (2) assign an academic expert, or (3) ask for assistance from CCEE (an agency created in 2013‑14 to support districts in improving outcomes).
- Intensive Intervention (Level 3). Level 3 support is intended for districts with pervasive performance issues that persist over several years. Specifically, the SPI may intervene in a school district if it has poor performance for three or more student groups in two or more state priority areas for three out of four years. Intervention may only occur if CCEE has determined that the problems in the district are so severe that intervention is necessary. If the SPI chooses to intervene, he or she can modify an LCAP, impose budget revisions aligned with the revised LCAP, or stay or rescind a school board action that would prevent a district from improving student outcomes.
First Round of Districts Recently Identified for Level 2 Support. In December 2017, the state identified the first set of districts in need of Level 2 support. In total, 228 districts were identified for Level 2 support. Of these 228 districts, 164 (72 percent) were identified because of the performance of their special education students. Most commonly, districts were identified because their special education students had low test scores and high suspension rates.
Under New Framework, Many Entities Funded to Support Districts. Under current law, several entities are involved in supporting districts. Many of these entities are entrusted with providing multiple levels of support. In the nearby box, we discuss other entities that also support districts but are not explicitly part of the LCFF framework.
- COEs. The state’s 58 COEs provide a variety of Level 1 support to their districts, including reviewing LCAPs, providing professional development, and monitoring fiscal health. COEs also are tasked with providing Level 2 support to identified districts.
- CCEE. Currently, CCEE conducts a variety of Level 1 statewide trainings and organizes professional learning networks intended to support all interested districts. In addition, CCEE is operating a Level 2 pilot program for a small number of LEAs. The pilot is intended to help inform improvement efforts moving forward. As envisioned under state law, CCEE also would be responsible for making a determination whether a district requires Level 3 support.
- SPI. Upon making such a determination, the SPI can provide Level 3 support and intervene in a district that has a record of persistent performance issues.
Other Funds Used to Support Districts
State Supports Districts Using a Variety of Other Funding Streams. These streams primarily go to a few select COEs that serve as either statewide or regional hubs of expertise on select topics. Although the support provided by these COEs resemble Level 1 and Level 2 support, the state has not integrated these funding streams and activities explicitly into the LCFF framework.
Federal Funds Are Used for Level 2‑Type Support. For many years, the state has used federal Title I funding to support LEAs with performance issues. Most notably, 11 COEs receive $10 million annually to run the Regional System of District and School Support (RSDSS). COEs receiving this funding have long supported districts and schools within their region that have identified performance issues. For many years, the state also has used $3 million annually in Title I funds for the California Comprehensive Center, which serves as a statewide center of expertise on district and school improvement issues. Additionally, the state provides $2 million in federal Title III funding for 11 COEs to support programs for English learners (5 of these COEs also serve as RSDSS COEs).
Recently, Additional State Funds Allocated for Level 1‑Type Support. In recent years, the state has provided funding for additional support to districts. In 2015‑16 and 2016‑17, the state provided a total of $30 million in one‑time funding for a COE to develop statewide resources, provide training, and allocate subgrants to districts to implement an improvement strategy known as a multi‑tiered system of support. From 2015‑16 through 2017‑18, a total of $9 million in CTE Incentive Grant funding went to seven COEs to serve as regional hubs of expertise on CTE issues. Additionally, the 2017‑18 budget provided $2.5 million in one‑time funding for at least two COEs to identify and provide resources to support LEAs in promoting student equity. CDE is currently requesting applications from interested COEs to use this funding.
Governor’s Proposals
Introduces Package of Support Proposals. As Figure 18 shows, the Governor’s budget package includes four proposals relating to LEA support. The package of proposals totals $76 million. The following paragraphs describe each of these proposals in more detail.
Figure 18
Governor’s Budget Contains Package of Support Proposals
(In Millions)
|
Entity |
Description |
Amount |
|
County Offices of Education (COE) |
Directly support identified districts or assign an academic expert. |
$55.2 |
|
SELPA Regional Leads |
Work with COEs to directly support identified districts. |
10.0 |
|
California Collaborative for Educational Excellence (CCEE) |
Provide statewide training, collaborate with COE Regional Leads, and directly support identified districts. |
6.5 |
|
COE Regional Leads |
Help build COE capacity, develop resources in collaboration with CDE and CCEE, and directly support identified districts. |
4.0 |
|
Total |
$75.7 |
|
|
SELPA = Special Education Local Plan Area. |
||
Increases COE Funding for Level 2 Support Activities. The Governor provides a $55 million ongoing augmentation to COEs to provide districts with Level 2 support. From the $55 million, each COE would receive a base amount, with additional funding to be distributed based on the number of districts identified for support within the county. COEs could provide support in a number of ways generally consistent with current law, including conducting a root cause analysis, assigning an academic expert, or asking CCEE to provide assistance. In most cases, districts would be required to accept the assistance of their COE. The one exception is if the district can demonstrate that it already conducted a root cause analysis and is working with an academic expert or undertaking substantially similar activities (all using district funding). In this instance, the COE only would be required to keep apprised of the district’s efforts to improve outcomes. COEs also would have to report to the state the major performance issues of each identified district and what each identified district is doing to improve its performance.
Establishes COE Regional Leads to Support COEs With Less Capacity. The Governor also provides $4 million ongoing for select COEs to serve as regional leads. Through a competitive process, CDE and CCEE would identify six to ten COEs across the state to serve as the lead COE within its region. Each regional lead would assist COEs in the region to better support districts, work with CDE and CCEE to develop resources, and provide direct Level 2 support when requested by a COE in its region.
Establishes SELPA Regional Leads to Work With COEs. The Governor’s proposal also includes $10 million ongoing to fund six to ten SELPA regional leads. As with the COE regional leads, the SELPA leads would be chosen by CDE and CCEE through a competitive process. The SELPA leads would help COEs support identified districts.
Provides Ongoing Funding to CCEE to Support COEs and Districts. The Governor provides $6.5 million ongoing to CCEE. Of this amount, $3.2 million is for supporting COEs and regional leads and $2.5 million is for directly supporting identified districts. The Governor also provides $500,000 for CCEE statewide trainings and $310,000 for base administrative costs. In addition, the Governor proposes to carry forward $4.8 million in prior‑year funding for 2018‑19 statewide training and administrative costs. In 2019‑20, the administration expects to increase CCEE ongoing funding from $6.5 million to $11.3 million to reflect the loss of these one‑time funds.
Assessment
Serious Overriding Concerns With Governor’s Approach. We believe the attention the Governor is giving to the state’s new system of support is warranted. The state is at the key stage of refining the details of the system and figuring out what activities, if any, require additional funding. We think the Governor’s overall approach, however, has significant shortcomings.
- First, the Governor’s approach minimizes district choice, as an identified district is required to receive Level 2 support from its COE (unless it uses district funding to purchase such support). This limited choice, in turn, could reduce the quality and timeliness with which a district receives tailored support, as a COE might not have in‑house expertise to address a particular district’s particular performance issues.
- Second, by creating two sets of new regional leads, the Governor’s approach includes too many actors with unclear and potentially duplicative roles.
- Third, the approach creates a multilayered system that focuses on supporting COEs (through regional leads and the CCEE), rather than focusing on districts with identified performance issues.
Serious Concerns With Specific Support Proposals. In addition to our overriding concerns with the Governor’s approach, we have notable concerns with each of his four specific support proposals, which we discuss below.
COEs Already Funded Through LCFF to Offer Support. The bulk of new funding provided in the Governor’s package of proposals is allocated to COEs to provide Level 2 support. COEs, however, already receive funding for these types of activities through their LCFF allocations. As we discuss in our 2017 report, Re‑Envisioning County Offices of Education: A Study of Their Mission and Funding, COEs’ existing funding is more than sufficient to conduct their statutorily required support activities, including helping districts that have been identified with performance issues.
Regional Lead Roles Appear Duplicative, Likely Unnecessary. The proposal to create two sets of COE regional leads appears duplicative not only of existing regional leads but also of other entities (COEs and CCEE) included in the Governor’s package of proposals. Under current law, 11 COEs already receive a total of $10 million to serve as regional leads to support low‑performing districts and schools. The administration’s proposal does not integrate these existing leads into the new support system. The distinction between the roles and responsibilities of all COEs, the regional leads, and CCEE also is not entirely clear. Without clarity on who is supposed to be doing what, setting expectations for each entity and holding each accountable for achieving its objectives is virtually impossible. Perhaps of even greater concern, the administration has not convincingly demonstrated that a regional approach is the best approach to take in building a new system. Given advances in technology and the increasing use of virtual support networks, the Legislature likely would want to undertake serious deliberation before pursuing a regional approach.
SELPA Proposal Has Added Problem of Working Counter to Rest of LCAP Approach. Aside from the SELPA regional leads’ roles being unclear and likely duplicative of the other regional COE leads, pulling in SELPAs to address only special education issues silos support and disconnects special education performance issues from other student performance issues. It also works counter to fostering better communication and planning between special education and general education. LEAs and states, including California, have spent many years moving away from the silo approach to a more holistic, coordinated approach. Moving forward, the state presumably wants to avoid having a SELPA help a district with a special education performance issue, only to make an EL issue worse, for example, or to overlook an intertwined performance issue stemming from a district’s general education practices.
Most of CCEE Funding Does Not Directly Support Districts With Performance Issues. Under the Governor’s CCEE proposal, more funding goes to supporting regional entities than districts with performance problems. As mentioned above, we are not convinced that such an indirect approach is warranted given modern advances in communication and support. Additionally, by involving such a large number of actors in the system of support, the Governor makes the CCEE’s job of communicating with COE regional leads, SELPA regional leads, and COEs particularly challenging. Though we are concerned about the relatively large amount designated for supporting regional hubs, we have less concern with the remainder of proposed CCEE funding, as it goes for direct district support or statewide trainings. These funds could be tailored to addressing statewide performance issues (such as poor special education performance).
Recommendations
Recommend Alternative Approach to System of Support. Given the above concerns, we recommend the Legislature reject the Governor’s package of support proposals and consider an alternative approach. Below, we sketch an alternative system of support for school districts that addresses the shortcomings identified in the Governor’s proposal and gives districts greater choice of support providers, clearly defines each agency’s roles, and establishes clear lines of accountability. Compared to the Governor’s $76 million system, the alternative would cost $30 million (60 percent less). Figure 19 shows the major advantages of this alternative. We describe the alternative approach in greater detail below.
Figure 19
Major Advantages of Alternative Approach to District Support
|
|
|
|
|
|
|
Require COEs to Work With Identified Districts to Do Root Cause Analyses. To assist districts in identifying their root performance issues, we recommend that all COEs be required to work with identified districts to conduct root cause analyses. As with the Governor’s proposal, we recommend exempting COEs from the requirement if a district already has conducted the analysis. Given the state already tasks all COEs with approving district LCAPs and budgets, we think COEs are positioned to examine root performance issues. Given COE’s current level of LCFF funding already is more than sufficient to provide district support, we recommend not augmenting their funding for these activities.
Allow Districts to Access Support From Experts Contracted Through CCEE. Rather than funding Level 2 support services through a combination of COEs, COE regional leads, and SELPA regional leads, we recommend providing funding to CCEE to contract with entities interested and expert in providing such support. Under this alternative, CCEE would use a competitive grant process to select numerous support teams with the appropriate expertise. Grants would be open to COEs, districts, other providers of education services, and education consultants. Districts would work with CCEE to choose contracted experts best suited to help address their key performance issues. (As specified under current law, a district at any time may use its LCFF funding to access other support.) The contracted experts would help districts with their improvement efforts. Support might come in the form of helping a district select an improvement strategy, align its budget with this strategy, and reprioritize professional development efforts. We recommend providing CCEE initially with a total of $30 million annually. The CCEE could use the funding to award the limited‑term grants, oversee contracts, monitor identified districts, and conduct statewide trainings. This alternative approach would provide districts with greater choice, allow the state to be more nimble in responding to emerging performance issues, and rely on the best expertise available from anywhere in the state.
Monitor New System Before Funding Level 3 Support. Prior to fully developing and funding Level 3 support, we recommend the state monitor the number of identified districts and track improvement trends over the next few years. At that time, the state could identify whether changes should be made to Level 2 support and whether Level 3 funding is needed.
Career Technical Education
In this section, we provide background on high school CTE. We then describe and assess the Governor’s proposal to create a new high school CTE program funded through the CCC Strong Workforce Program. We end by offering associated recommendations.
Background
High School CTE Has Various Objectives. High schools’ main CTE objectives are to: (1) promote student engagement by teaching academic subjects in a hands‑on way; (2) teach students technical skills that can lead to further postsecondary education or employment; (3) teach soft skills, such as teamwork and communication that can better prepare students for additional education or the workplace; and (4) help the state meet its workforce goal of producing more middle‑skilled workers.
Schools Organize CTE Around 15 Industry Sectors. The CDE defines CTE as sequenced coursework in one of 15 industry sectors. Figure 20 lists these sectors. CDE has developed curriculum standards for each of the sectors. These CTE standards are aligned with the Common Core State Standards.
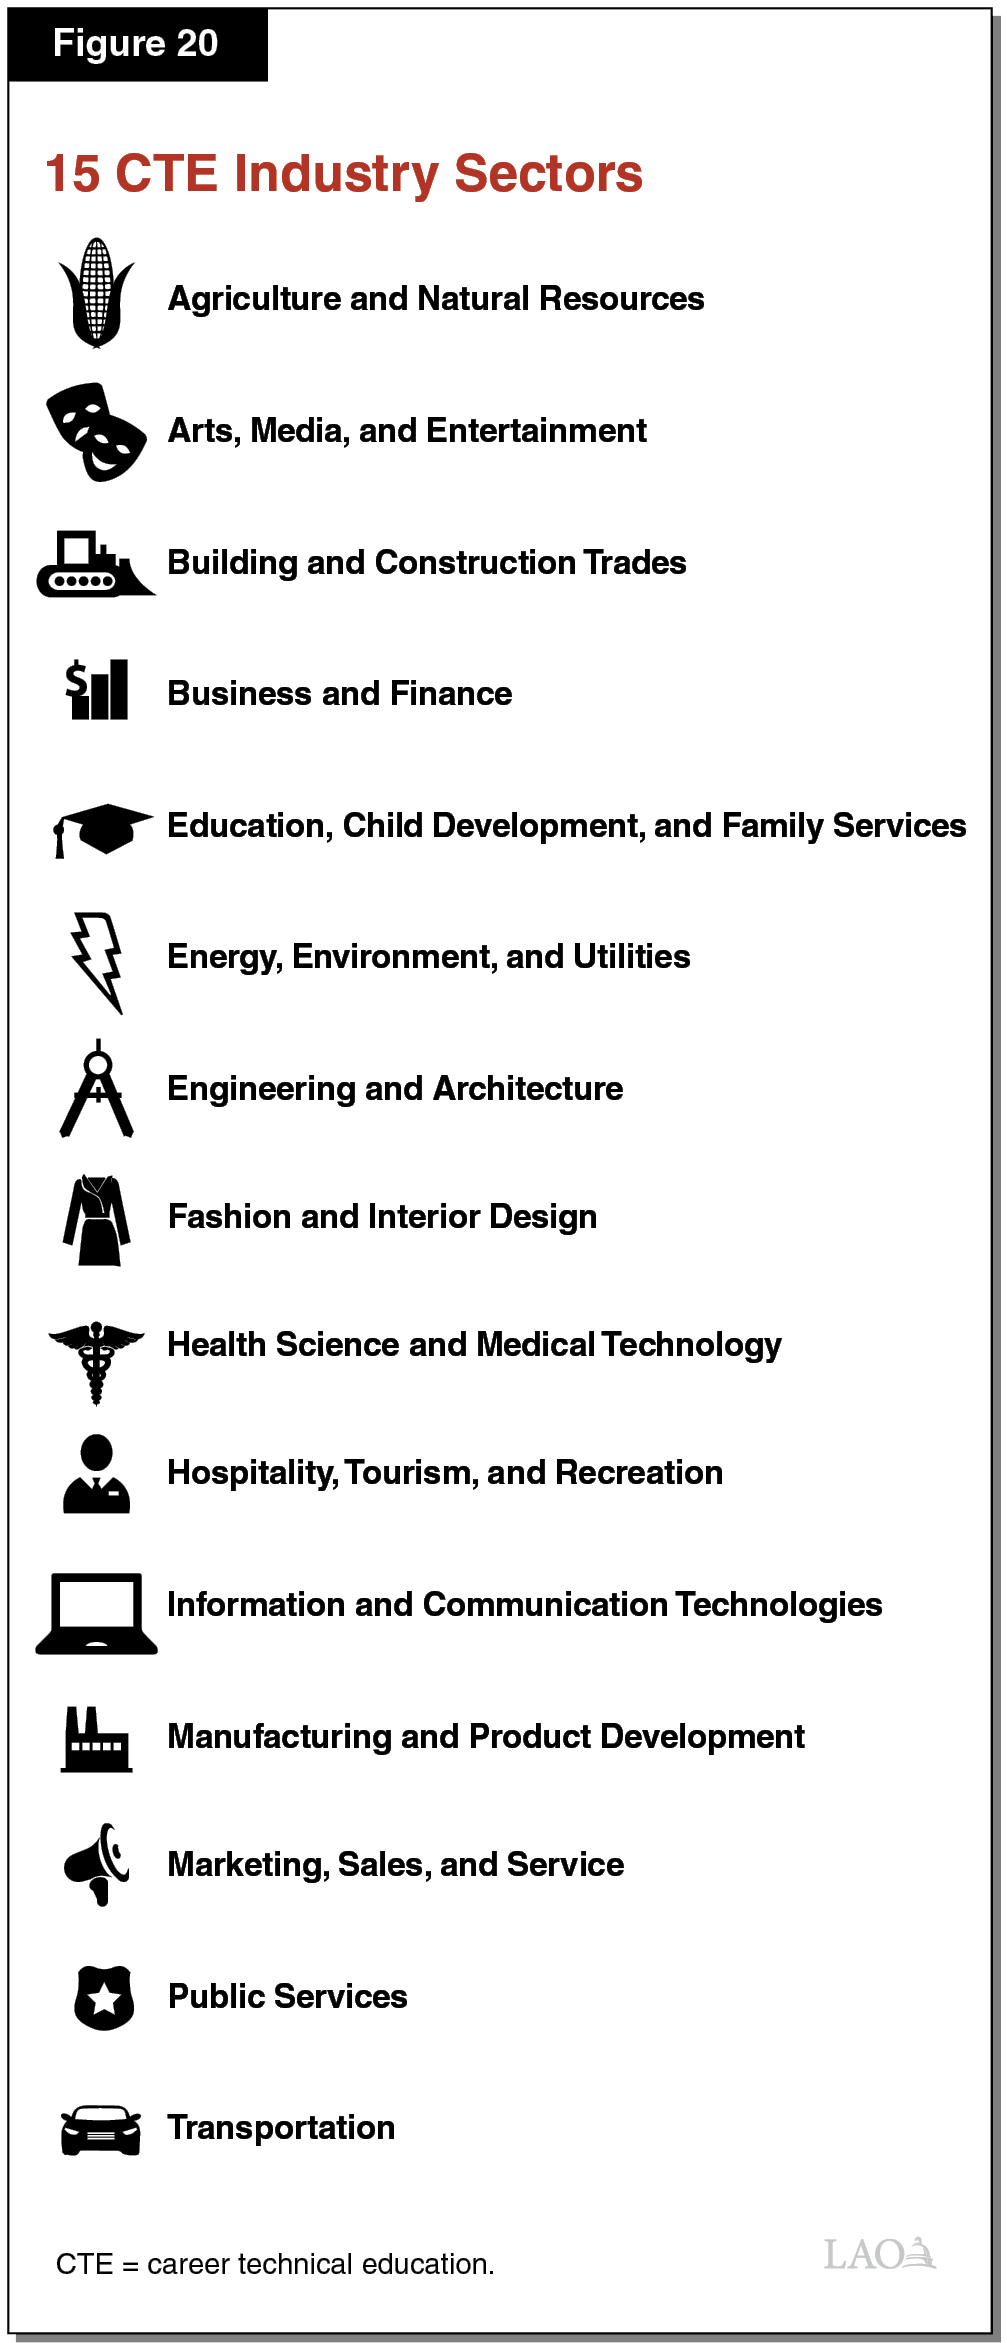
Historically, State Supported CTE Through Many Categorical Programs. Prior to the adoption of LCFF, the state funded several high school CTE categorical programs. Each of these categorical programs had specific spending and reporting requirements. The largest CTE categorical program was Regional Occupational Centers and Programs (ROCP). ROCP provided regional CTE training to adults and high school students age 16 and older. The state also supported several smaller CTE categorical programs. These programs generally focused on a particular CTE industry sector, as with the Agricultural Incentive Grant, or a specific CTE delivery model, as with the cohort approach of the California Partnership Academies. The state also funded the CTE Pathways Program, an initiative to better align high school CTE with community college CTE. The categorical approach to CTE was similar to the state’s approach at this time to funding various other areas of education, including programs for low‑income students. By 2008‑09, the state funded more than 50 categorical programs.
Largest CTE Program Was Eliminated and Replaced With LCFF Five Years Ago. As with most categorical programs, ROCP became discretionary in 2009, with the state allowing school districts to use ROCP funds for any educational purpose. In 2013‑14, the state adopted the LCFF, which permanently eliminated about two‑thirds of state‑funded categorical programs and rolled their associated funding into one new student‑based funding formula. Under the formula, the state set a base per‑student rate for high schools that is notably higher than the rates set for the lower grade spans (K‑3, 4‑6, 7‑8). On top of the already higher base rate, the state folded an amount equivalent to ROCP (roughly $400 million at the time) into the new formula. This action further increased the high school base rate by an additional 2.6 percent, resulting in a total base rate 16 percent higher than the middle school rate. The state then set target funding rates. The state intended to ramp up LCFF funding gradually, reaching the target rates by 2020‑21.
Several Programs Not Replaced by LCFF. Some categorical programs were not included in LCFF and still have their own spending and reporting requirements. The four CTE programs excluded from LCFF are the California Partnership Academies ($21 million), the CTE Pathways Program ($15 million), Specialized Secondary Programs ($4.9 million), and the Agricultural Incentive Grant ($4.1 million). School districts must apply to each of these programs if interested in receiving funding. The programs benefit few schools overall, but some programs benefit more than others. For example, half of funding for Specialized Secondary Programs currently goes to two high schools whereas funding for California Partnership Academies goes to roughly 200 (of the state’s approximately 1,300) high schools. The programs are mostly compliance oriented, but they tend to require grant recipients to report on some short‑term student outcomes (such as high school graduation rates). The programs, however, do not tend to have explicit performance expectations or repercussions for poor performance.
During LCFF Phase In, State Funded Transitional CTE Grant Programs. In addition to folding an amount equivalent to ROCP into LCFF, the state required school districts to continue spending about $400 million on ROCP annually in 2013‑14 and 2014‑15, as the state ramped up LCFF funding amounts. During this early transition period, the state also funded two major limited‑term CTE initiatives. The first was the California Career Pathways Trust, which provided a total of $500 million over 2013‑14 and 2014‑15 for high schools and community colleges to develop consortia to align their CTE coursework with each other and with regional workforce needs. In 2015‑16, the state then created the CTE Incentive Grant initiative. The expressed intent of this initiative was to help districts cover the costs of CTE over the LCFF phase‑in period, before the target rates were reached. The program ramped state funding down over a three‑year period ($400 million, $300 million, $200 million). The total local match requirement was $400 million in year one, $450 million in year two, and $400 million in year three.
Transitional Funding Linked With Districts Fulfilling Certain Input‑Oriented Requirements. The state’s CTE transition programs mostly relied on compliance‑based accountability that required school districts to fulfill certain programmatic requirements as a condition of receiving funds. Though mostly compliance oriented, some of the programs required grant recipients to report some student performance data. For example, the Career Pathways Trust required consortia to report on the number of courses they articulated and enrollment in their programs, as well as high school graduation rates. (The program also required consortia to report longer‑term student outcome data, like transitions from high school to college, but CDE indicated that the data was too preliminary to report to the state.) For the CTE Incentive Grant initiative, grantees also had to meet certain CTE input‑requirements, such as adhering to the CTE curriculum standards. Neither the Career Pathways Trust nor the CTE Incentive Grant initiative set specific performance expectations, required school districts to establish CTE goals, or included repercussions for poor performance.
LCFF Requires All School Districts to Prepare Students for College and Career. LCFF was intended to be a significant departure from the state’s former categorical approach. Under LCFF, every school district is required to develop a strategic plan to guide how they spend their LCFF dollars to meet student needs. To hold schools accountable for serving students, school districts report various student outcome data to the state, which is then displayed on a public website known as the School Dashboard. The Dashboard data currently includes test scores, graduation rates, and suspension rates. It also includes a college and career readiness indicator. As Figure 21 shows, the indicator allows districts multiple options for demonstrating their students are “prepared” or “approaching prepared” for college and career. Under the state’s accountability system, if a school district does not do well on Dashboard indicators, it must examine its root issues and access support to help it improve.
Figure 21
College and Career Readiness Indicator Gives Districts Optionsa
|
Prepared |
|
High school diploma + any one of the following measures: |
|
|
|
|
|
|
Approaching Prepared |
|
High school diploma + any one of the following measures: |
|
|
|
|
|
Not Prepared |
|
No high school diploma or high school diploma but no measures metb |
|
aApplied to every student in a district. The State Board of Education over the next three years plans to develop a “well prepared” category. That category is to include information about the number of students that earned certificates and participated in internships and other work‑based learning in high school. bStudent has not met any of the measures required to be deemed approaching prepared. CTE = career technical education; UC = University of California; and CSU = California State University. |
CTE Data Not Comprehensive and Generally Does Not Measure Longer‑Term Outcomes. In 2016‑17, the first year the state calculated college and career readiness as part of the Dashboard, about 50 percent of students were deemed prepared, about 25 percent were deemed approaching prepared, and the remainder were deemed not prepared. Though the state has collected information about how many students participated in CTE for many years, older data generally is not comparable to this newer data because data definitions and collection methods have changed. In addition, the state does not have data on longer‑term outcomes, such as the number of students enrolling in college or entering the workforce. The state generally is unable to track longer‑term outcomes because school districts and colleges do not systematically share their data.
Governor’s Proposals
Provides $212 Million for New High School CTE Program Within CCC’s Strong Workforce Program. The Governor allows the CTE Incentive Grant to expire in 2017‑18, as currently scheduled in statute. In its stead, he provides funding to the CCC Chancellor’s Office for a new high school CTE program that would be operated as part of the Strong Workforce Program. The nearby box provides more information about the Strong Workforce Program.
CCC Strong Workforce Program
State Created Strong Workforce Program in 2016‑17. The 2016‑17 budget provided $200 million in ongoing funding to the California Community Colleges (CCC) Chancellor’s Office to create a new career technical education (CTE) program. The purpose of the program is to improve the availability and quality of CTE programs leading to certificates, degrees, and credentials. In 2017‑18, the state folded in a former CTE initiative, increasing Strong Workforce funding to $248 million.
Program Emphasizes Regional Planning. The Strong Workforce Program requires community colleges to coordinate their CTE activities within eight regional consortia. Each consortium, consisting of all community colleges in the region, is to ensure that its offerings are responsive to the needs of employers and students. To this end, each consortium must collaborate with various local stakeholders, including local workforce development boards, industry leaders, and local education agencies, to develop a four‑year plan for how they will address regional workforce needs. Colleges receive Strong Workforce funding to align their programs with the plan. Program funds are distributed to consortia based on demographic variables and performance in meeting regional workforce needs.
Provides Technical Assistance to Help Regional Consortia Work With Industry. The CCC’s Economic Workforce Development program supports Strong Workforce Program efforts. Specifically, the Economic Workforce Development program provides funding for industry area experts at the Chancellor’s Office (known as Sector Navigators) and at community college districts (known as Deputy Sector Navigators). The Navigators connect community college CTE administrators and faculty with regional industry and labor leaders to help them align their CTE programs with workforce needs.
$200 Million Ongoing for CTE Aligned With Regional Workforce Plans. Of the $212 million, $200 million would go to the eight Strong Workforce regional consortia. Consortia would receive funding based on a formula that considers each region’s statewide share of grade 7‑12 average daily attendance, job openings, and unemployment. Once consortia receive funding, they would distribute it to school districts in their region on a competitive basis. To be eligible for grant funding, a school district would need to commit to using its grant funds for aligning its CTE with the Strong Workforce plan for its region. The program also would require most grant recipients to provide a match of two local dollars for every one dollar of Strong Workforce funding.
$12 Million Ongoing for Technical Assistance. The remaining $12 million would go to hire 72 high school Workforce Pathway coordinators—one for each of the 72 community college districts. Each employee would work with school districts in their community college district boundaries to help them coordinate their CTE programs with their region’s Strong Workforce plan.
Assessment
Many Benefits to LCFF Approach. The passage of LCFF was the culmination of more than a decade of research and policy work on California’s school funding system. The state decided that rather than managing school district budgets through dozens of categorical programs, it would provide more flexible funding tied to student needs. In addition, school districts would have performance expectations and need to seek support if they failed to meet those expectations. With regard to the delivery of CTE specifically, the LCFF approach has notable advantages over the old categorical approach. Under the categorical approach, CTE was viewed as an add‑on to the core high school experience, and only those schools that received funding for a certain CTE program were expected to offer a particular corresponding type of CTE. Under LCFF, every school district is expected to prepare their students for college and career as part of their core high school program. To do this, all school districts are required to develop strategic plans for how they will meet their students’ needs, including how they will prepare them for college and career. If a school district does poorly in preparing their students, they are identified for support.
LCFF High School Funding Much Higher Today Than in Year 1 of Implementation. In 2017‑18, high schools are receiving a base LCFF rate of $8,700 per student—$2,400 more than the 2013‑14 rate (the first year of LCFF implementation). In 2017‑18, the LCFF target rates are 97 percent funded. Under the Governor’s budget, LCFF would be fully implemented in 2018‑19. If approved, the base high school rate in 2018‑19 would increase to $9,200. Although the initial 2.6 percent bump to the high school rate was associated with ROCP, the state set no expectation that high schools were to spend only 2.6 percent of their LCFF funding on CTE. Nonetheless, the 2.6 percent bump in 2013‑14 equated to about $400 million, whereas today it equates to over $500 million.
Governor Takes Categorical Approach to Funding High School CTE. Despite five years of CTE transitional funding, the development of a college and career readiness indicator, and full implementation of LCFF, the Governor proposes a new categorical program for high school CTE. He also maintains several smaller categorical CTE programs. Such an approach—layered on top of LCFF—blurs lines of accountability, splinters districts’ academic planning efforts, sends mixed messages about whether CTE is core or an add on, and increases administrative burden for districts.
New Program Is Not Coordinated With Existing High School CTE Programs. Though the Governor’s proposal seeks to improve coordination among high schools and community colleges, it does nothing to improve coordination among existing high school CTE efforts. That is, the Governor continues to require high schools to apply separately for five CTE programs, each of which has different rules and requirements and is not integrated into high schools’ core academic planning and accountability system. Continuing four small CTE programs, in addition to a new larger CTE program, works at cross‑purposes to the goal of better coordination.
Proposals Also Have Potential to Focus High School CTE Too Narrowly. Under the Governor’s proposals, high school CTE funding could be used only for courses that meet regional workforce needs. Placing this restriction on Strong Workforce funding for community colleges is reasonable because the primary goal of their CTE programs is to transition students into jobs in their regional labor market. High school CTE programs differ from community college CTE programs in that they have additional goals, most notably student engagement and career exploration. If funding can only be used on CTE courses that meet regional workforce needs, these other important goals could be neglected.
When Compared to Governor’s Proposals, CTE Incentive Grants Have Several Advantages. Unlike the Governor’s proposals, the CTE Incentive Grant initiative allows high schools to offer any high‑quality CTE program, including ones that promote student engagement even if not directly tied to local labor market needs. The initiative also is overseen by CDE, which has expertise in helping high schools understand CTE curriculum standards and build them into their CTE programs. Additionally, CDE already leads a network of regional CTE technical assistance centers designed to help high schools in designing and implementing their CTE programs. Neither the expertise of CDE nor these technical assistance centers are leveraged under the Governor’s proposals. Moreover, the Governor’s proposals appear to give primary decision‑making authority for high school CTE to community colleges, which could lead to unnecessary tension between the two agencies.
Recommendations
Recommend State Use LCFF Approach to Fund High School CTE. We recommend the Legislature use the LCFF approach to fund and support high school CTE. The LCFF approach focuses on student outcomes while also promoting local flexibility and control. If the Legislature has concerns with the LCFF formula or associated accountability system, we recommend modifying the existing formula or accountability provisions rather than creating new categorical programs. For example, if the Legislature believes that school districts need more funding to offer CTE, it could increase the LCFF funding rate for high school students. If the Legislature believes that the state’s accountability system does not sufficiently incentivize schools to prepare their students for college and career, it could strengthen the college and career indicator. If concerned with the indicator, the Legislature, for example, might (1) split the indicator into separate college and career indicators and/or (2) require districts to describe their CTE offerings and partnerships in their strategic plans.
If Legislature Wishes to Pursue Categorical Approach, Recommend Adding Coordination Requirements to CTE Incentive Grants. Should the Legislature decide to take a categorical approach to high school CTE, we recommend it reject the Governor’s Strong Workforce approach. We think the Legislature can meet the Governor’s primary objective of improving coordination by modifying existing CTE program requirements. Specifically, we recommend the Legislature build off the CTE Incentive Grant program but add three new components (explained in the three paragraphs below) that would encourage better coordination between high school and community college CTE.
Align a Portion of High School CTE Courses With Regional Workforce Needs. Although the CTE Incentive Grant program already requires school districts to coordinate with community colleges and align their CTE course offerings with regional market needs, we believe the program could go further in these areas. Specifically, as a condition of receiving CTE Incentive Grant funding, we recommend the Legislature require high schools to align a minimum proportion of their CTE course offerings with regional workforce needs. The exact threshold set would depend upon how the Legislature weighs the relative benefits of workforce preparation compared to student engagement and exploration. Having some minimum threshold would acknowledge that many high school CTE students likely will enter their local community college and/or the local workforce while still allowing high schools some flexibility to meet their other CTE goals.
Require School Districts and Community Colleges to Share Data and Accountability for Student Outcomes. We recommend the Legislature require high schools and community colleges to share data with each other on a statewide basis. This data sharing would allow for longer‑term student outcomes to be tracked. If this data were to become available, we recommend both segments add the longer‑term outcomes to their accountability systems. For high schools, this would mean incorporating the new outcomes (such as how many students enroll and complete community college training programs) into the Dashboard’s college and career indicator. For community colleges, this would mean linking the Strong Workforce performance funding component in part to colleges’ ability to enroll students transitioning from high school CTE programs.
Fold the Remaining High School CTE Programs Into CTE Incentive Grant Program. Eliminating other high school CTE programs and folding their associated funding into the CTE Incentive Grant program would increase Grant funding by about $40 million. Compared to having five CTE programs, the one consolidated statewide CTE program would promote better CTE coordination. Specifically, having only the one rather than five CTE categorical programs on top of LCFF would help streamline districts’ strategic planning and program offerings while reducing administrative burden.
Set Clear Objective for Program and Require Explicit Reporting Requirements. We recommend the state set a clear objective of what it would like any new or modified CTE categorical program to achieve over the next few years. To ensure the state can determine whether the objective of the categorical program is being achieved, we recommend the Legislature enact clear data collection and reporting requirements as well as set specific performance targets. We recommend the data tracked include a mix of short‑term and longer‑term outcomes. We also recommend the requirements apply to high schools giving data to CDE, as well as CDE giving data to the Legislature. To maximize the value of this data and reporting, the Legislature could ask CDE to provide annual performance updates during spring hearings.
Recommend Making Program Limited‑Term. We recommend the state only extend the new program for a few years. It could use the data collected across the period to evaluate how best to move forward once the program sunsets.
Weigh Trade‑Offs When Determining Program Funding Level. In deciding how much to appropriate for any new or modified CTE program, the Legislature faces a basic trade‑off. The greater the amount provided for the CTE categorical program, the less available for LCFF. That is, providing more categorical funding for CTE would guarantee that schools offer more CTE programs but potentially come at the expense of local priorities, flexibility, and control. Additionally, the more provided through the CTE categorical program, the more confusion districts might have regarding whether LCFF or the categorical program is to be the primary vehicle for CTE planning and accountability. Keeping the CTE Incentive Grant program at its current funding level could signal to districts that the program still is intended as supplemental to LCFF, rather than the primary fund source for CTE. If the Legislature wished to signal in this way, it could consider setting funding for the Grant program at its 2017‑18 spending level ($200 million in state funding plus district matching of $400 million). By comparison, high schools statewide received a total of $19 billion in LCFF funding that year.
Special Education Teacher Proposals
In this section, we provide background on special education staffing in California, describe and assess the Governor’s two proposals relating to special education teachers, and offer associated recommendations.
Background
Two Types of Special Education Staff—Teachers and Specialists. Special education teachers provide instruction to students with disabilities and help coordinate other special education services that students receive. State law generally requires special education teachers to hold a teaching credential that is aligned with the types of disabilities of the students they teach. Figure 22 shows the seven types of special education credentials the state currently authorizes. In addition to teachers, specialists provide a range of direct services to students with disabilities. Services can include providing a student who has a speech impediment with speech therapy and providing sign language interpretation for a student who is deaf. Specialists typically hold a license from a national professional organization, which establishes profession‑specific training requirements. According to CDE, 48,000 special education teachers and 24,000 specialists were working in California schools in 2015‑16.
Figure 22
Seven Types of Special Education Teaching Credentials
|
Credential |
Focus of Credential |
|
Mild/Moderate Disabilities |
Teacher instructs students with specific learning disabilities, mild/moderate intellectual disabilities, other health impairments, and serious emotional disturbances. |
|
Moderate/Severe Disabilities |
Teacher instructs students with autism, moderate/severe intellectual disabilities, multiple disabilities, and serious emotional disturbances. |
|
Early Childhood Education |
Teacher instructs children up to five years old with mild/moderate and moderate/severe intellectual disabilities and traumatic brain injuries. |
|
Deaf and Hard of Hearing |
Teacher instructs students with deafness, hearing impairments, and deaf‑blindness. |
|
Visually Impaired |
Teacher instructs students with blindness, visual impairments, and deaf‑blindness. |
|
Physical and Health |
Teacher instructs students with orthopedic impairments, other health impairments, multiple disabilities, and traumatic brain injuries. |
|
Language and Academic Development |
Teacher instructs students with communication and language needs. |
Schools Report Longstanding Shortage of Special Education Staff. To comply with a federal requirement, each year California identifies areas of school staffing shortages. Since the state began reporting in the early 1980s, it has identified shortages of special education teachers and specialists nearly every year. Shortages of special education staff, however, are not unique to California. In 2017‑18, all but three states (Alaska, Georgia, and New Mexico) reported special education shortages. Districts respond to special education staffing shortages in various ways, including recruiting teachers internationally, hiring staff without required credentials on a waiver basis, and delaying services (such as therapy sessions) for students.
Shortages Are Particularly Acute for Certain Types of Teachers and Specialists. Although the state faces shortages of all types of special education teachers, these shortages are particularly acute for teachers of students with moderate/severe disabilities. In 2015‑16, 40 percent of new teachers of students with moderate/severe disabilities lacked the required credential. By comparison, 25 percent of new teachers of students with mild/moderate disabilities lacked the required credential. Similarly, certain types of specialists are in particularly short supply. Most districts try to hire specialists that work exclusively for the district, but they typically contract with third party staffing agencies when unable to hire their own specialists. Contract specialists are generally more expensive than district staff and typically work on one‑year contracts. In 2015‑16, 23 percent of all occupational therapists working in schools were employed through third party staffing agencies, as were 16 percent of all speech and language pathologists. By comparison, 5 percent of all psychologists working in schools were employed through staffing agencies.
Special Education Teacher Shortage Attributable in Large Part to Pay That Does Not Reflect Unique Demands of the Job. School districts generally do not differentiate pay levels between special education and general education teachers. Special education teachers, however, typically have additional responsibilities, such as developing detailed and time‑consuming individual education plans for each of their students. They also typically oversee and coordinate teams of specialists who work with students. Based on our discussions with school administrators, special education teachers also tend to spend much more of their time involved in litigation and legal challenges brought by dissatisfied parents. In many other professions, employees tasked with greater responsibilities and challenges receive higher pay than their colleagues with fewer responsibilities and challenges. As this pay differential does not exist in schools, it can result in special education teachers leaving the profession or moving into general education assignments when openings arise.
Various Other State and Local Factors Likely Contributing to Staffing Shortages. Through interviews we conducted in 2017 with school districts, SELPAs, and higher education institutions, we identified three primary state‑level issues affecting the supply of special education staff: (1) problematic education and credentialing requirements that necessitate five years rather than four years of postsecondary education to become a special education teacher, (2) overly narrow credential requirements on the types of special education students that teachers can instruct, and (3) graduate‑level preparation programs that limit the number of specialists that can enter the field each year. Various school district policies also contribute to local‑level shortages, including (1) inefficient human resources practices that can result in a district taking over six months to hire special education job applicants, causing them to choose other options; and (2) weak support systems that can contribute to high staff turnover.
Governor’s Proposals
Provides $50 Million in One‑Time Grants for Teacher Residency Programs. To better prepare and retain special education teachers, the Governor proposes $50 million one‑time Proposition 98 funding for schools to start new or expand existing teacher residency programs. The nearby box describes teacher residency programs and compares them with the traditional teacher training pathway. Under the Governor’s proposal, CTC would award competitive grants to schools over several years. Schools could qualify for up to $20,000 per teacher candidate, with a dollar‑for‑dollar local match required. The initiative is intended to support about 2,500 teacher candidates. The funds could be used in a variety of ways, including providing living stipends for teacher candidates, providing stipends for teacher mentors, and covering the cost of tuition at partnering higher education institutions.
Key Differences Between Traditional and Residency Teacher Training Programs
The traditional route into teaching requires individuals to obtain a bachelor’s degree, enter a year‑long credentialing program at a higher education institution, and participate in a certain number of hours of student‑teaching. Typically, student‑teaching occurs toward the end of a candidate’s credentialing program. By contrast, a residency program pairs candidates with teacher mentors at the beginning of the credentialing program and adopts a co‑teaching model whereby the candidate spends many more hours teaching than they otherwise would have in a traditional credentialing program. California currently has at least ten residency programs, which are typically established through partnerships between districts and higher education institutions. Due to the stipends and tuition waivers that residency candidates receive, these programs are much more costly to operate than traditional credentialing programs. Schools sponsoring residency programs can benefit, however, by requiring participants to teach at that school for a number of years after completing the program.
Provides $50 Million in One‑Time Grants to Recruit, Train, or Retain Special Education Teachers. The Governor’s budget also provides $50 million one‑time Proposition 98 funding for a new Local Solutions Grant Program. The proposed program would fund new or existing local efforts to recruit and retain special education teachers. As with the Governor’s teacher residency proposal, schools would apply to CTC for funding, which would award grants on a competitive basis. Successful schools would receive up to $20,000 per teacher, with a dollar‑for‑dollar local match required. The administration intends that districts have broad discretion in how they use the grant funds.
Assessment
Governor’s Focus on Special Education Staffing Shortages Has Merit. California faces a longstanding shortage of special education teachers and specialists. As a result, focusing on how the state could improve policies and practices to better recruit and retain special education staff is warranted. However, we have serious concerns in how the Governor plans to address these staffing issues.
Both Proposals Have Shortcomings. Our biggest concern with the Governor’s proposals is that they fail to address the root causes that have contributed to decades of special education staffing issues in the state. Neither proposal addresses the core local‑level causes of shortages—most notably, the ability to pay special education teachers the ongoing compensation needed to attract and retain the requisite number of staff. Additionally, neither proposal addresses the core state‑level causes of teacher shortages—most notably, overly restrictive education and credentialing requirements. Without addressing these core issues, one‑time funding proposals are highly unlikely to result in sustained, long‑term reductions in the shortage of special education teachers. The Governor’s proposals also fail to address the ongoing and acute shortages of specialists. Without addressing specialist shortages, schools will have to continue to use costly staffing agencies and students likely will continue to experience delays in receiving services. In addition to these overarching concerns, we have specific concerns with each of the Governor’s proposals, as discussed below.
Teacher Residency Proposal Would Have Limited Impact, Need for State Grant Funding Is Unclear. At a high cost per teacher ($20,000), the Governor’s teacher residency proposal would produce a relatively small number of teachers, some of whom would otherwise have gone into teaching. Also, relatively few districts likely would benefit from this proposed grant program. Moreover, some districts already view residency programs as valuable and fund them using their LCFF funding. This indicates those districts that find the strategy worthwhile are willing to spend resources to implement it. Additionally, the Governor’s budget contains $1.8 billion in one‑time discretionary grants that districts could use to start up these types of programs if they desired.
Local Solutions Initiative Is Too Broadly Defined. In our view, the Governor’s one‑time local solutions proposal gives districts too much discretion, without requiring them to pursue the difficult strategies likely required to address root causes on an ongoing basis. As a result, the funding is unlikely to produce a notable, lasting statewide reduction in staffing shortages. Moreover, the longstanding local issues driving special education shortages are unlikely to be solved through one‑time state grants. Rather, these issues require a selective set of ongoing reforms at both the state and local level.
Recommendations
Reject Governor’s Special Education Teacher Proposals. Given that the Governor’s proposals provide one‑time funds for activities that likely would result in little, if any, lasting reduction in special education staffing shortages, we recommend the Legislature reject both of the proposals. Instead, as described below, we recommend the Legislature pursue strategies that address the more fundamental issues underlying special education staffing shortages.
Paying Special Education Teachers More Is the Most Important Way to Address the Shortage. Though the state’s special education teacher shortage has a number of causes, we believe lack of ongoing differential pay is the most significant. Higher pay would encourage more teachers to pursue special education over general education by acknowledging and compensating them for the additional responsibilities they perform. Providing differential pay is fundamentally a local decision and the collective responsibility of districts and teacher unions through the bargaining process. In support of this objective, the Legislature, however, might consider repealing an existing statutory provision that sets a uniform salary schedule as the default district policy.
A Variety of Other State Actions Can Help Address Special Education Staffing Problems. Below, we make four recommendations. The first two recommendations likely would not require additional state funding, whereas the other two likely would involve relatively minor state costs.
Consolidate Two Special Education Credentials. We recommend the Legislature amend state law to reduce the types of special education credentials. The main objective of streamlining the credentialing structure would be to allow special education teachers to teach students with more types of disabilities without having to obtain a second teaching credential. Specifically, we recommend the Legislature consolidate the mild/moderate and moderate/severe credentials into one core special education credential. Although students with different kinds of disabilities can require different kinds of support, we think one training program could impart to teacher candidates the range of strategies they likely would need. Moreover, to the extent specific challenges arose while a special education teacher was on the job, a school district could provide tailored professional development for that teacher. We think the small amount of administrative work entailed in consolidating the credentials could be accommodated within CTC’s existing 2018‑19 budget. This is because CTC is already expected on an ongoing basis to perform certain work relating to establishing and maintaining professional teaching standards. Ultimately, a more streamlined credentialing system would reduce CTC’s associated administrative work.
Eliminate Two Special Education Credentials. We also recommend the Legislature eliminate the physical and health impairment credential and the language and academic development credential. These credentials are seldom issued and inconsistently used across districts. Moving forward, teachers interested in these specific areas could obtain the core special education credential and receive personalized professional development as the need arose. The administrative work and state cost associated with eliminating these credentials likely would be negligible.
Provide One‑Time Funding to Create Four‑Year Credentialing Route for Special Education Teachers. We also recommend the Legislature amend state law to create a four‑year degree option for special education teachers—similar to recently enacted legislation providing a four‑year option for general education elementary school teachers. A four‑year degree option would allow students to obtain a bachelor’s degree in special education and a teaching credential in special education within four years of study, reducing the time and cost required to enter the field. Many other states currently offer this route into teaching. To ensure that universities adopt the new model, we recommend that the state provide startup grants for the California State University (CSU) and potentially other teacher preparation institutions to redesign their curriculum and recruit students. We anticipate a one‑time incentive grant of about $250,000 per program likely is sufficient to cover the cost associated with consolidating and revising curriculum. For every $10 million in one‑time state funding, 40 programs could be funded to do such work.
Provide Funding for CSU to Expand Specialist Training Programs. Lastly, we recommend the Legislature provide CSU targeted enrollment funding to admit more qualified students into two of its graduate specialist programs—occupational therapy and speech and language pathology programs. These are the areas that currently have the most acute specialist staffing shortages. We think CSU likely could increase enrollment in these programs by about 5 percent per year (or 45 FTE students in 2018‑19). We estimate the state cost of these additional enrollment slots in 2018‑19 would be approximately $675,000. Were the state to continue funding 5 percent enrollment growth each year for the next ten years, staffing shortages in the two specialist areas very likely would be reduced significantly.
“Inclusive Early Education” Expansion
In this section, we provide background on child care and preschool programs, including programs for children with special needs. We then describe the Governor’s proposal to provide a total of $167 million one‑time funding ($125 million Proposition 98 and $42 million TANF) to expand child care and preschool programs that serve children with disabilities. We end by providing our assessment and making associated recommendations.
Background
State Subsidizes Child Care and Preschool, Primarily for Low‑Income Children. The state subsidizes child care and preschool through nine state programs. As Figure 23 shows, three programs relate to California Work Opportunity and Responsibility to Kids (CalWORKs), focusing on families engaged in or transitioning out of welfare‑to‑work activities. The remaining programs are primarily designed for other low‑income, working families, with the exception of transitional kindergarten (which is age based and has no work requirement) and Care for Children With Severe Disabilities (which serves only children in the Bay Area). The state also administers Early Head Start and Head Start, federal programs that serve children from low‑income families.
Figure 23
State Child Care and Preschool Programs
|
Program |
Description |
|
CalWORKs Child Care |
|
|
Stage 1 |
Child care becomes available when a participant enters the CalWORKs program. |
|
Stage 2 |
Families transition to Stage 2 child care when the county welfare department deems them stable. |
|
Stage 3 |
Families transition to Stage 3 child care two years after they stop receiving cash aid. Families remain in Stage 3 until the child ages out (at 13 years old) or they exceed the income‑eligibility cap. |
|
Non‑CalWORKs Child Care |
|
|
General Child Care |
Program for other low‑income, working families. |
|
Alternative Payment |
Another program for low‑income, working families. |
|
Migrant Child Care |
Program for migrant children from low‑income, working families. |
|
Care for Children with Severe Disabilities |
Program for children with severe disabilities living in the Bay Area. |
|
Preschool |
|
|
State Preschool |
Part‑day, part‑year program for low‑income families. Full‑day, full‑year program for low‑income, working families. |
|
Transitional Kindergarten |
Part‑year program for children who turn five between September 2 and December 2. May run part day or full day. |
Children With Disabilities May Be Served in a Few Ways. Children with disabilities who are from income‑eligible families may participate in state and federally subsidized child care and preschool programs. These programs are mainstream programs—meaning all children tend to participate in the same types of activities at the same time. Children with disabilities upon turning three years of age have the additional option of participating in special day programs run by school districts. Compared with mainstream programs, special day programs tend to serve children with disabilities in separate settings that provide more intensive support. In some cases, preschool‑age children do not attend classroom‑based programs and instead receive targeted services such as speech therapy or are served through home visits. Prior to turning three, children with disabilities can receive developmental support either through regional developmental centers or, in very specific cases, by school districts.
About Half of Preschool‑Age Children With Disabilities Are Not Served in Mainstream Settings. The state collects data on how children ages three through five who have identified disabilities are served. This data shows 39 percent of preschool‑age children with disabilities are served in mainstream programs (such as Head Start, State Preschool, or transitional kindergarten); 34 percent are served in special day classes; 13 percent split their time between mainstream and special day classes; and 14 percent receive targeted therapy or home visits. The state does not collect comparable data on what inclusion means for children with disabilities from birth through age two.
State Funds Many Programs to Improve Quality of Child Care and Preschool. Each year the state allocates funds intended to improve the quality of its child care and preschool system. In 2017‑18, CDE allocated $93 million to about 30 quality improvement programs. Currently, about half of quality improvement funds are used for training activities, financial aid programs for teachers taking additional classes, and supporting community colleges in serving students in their early childhood education programs. Of the funds provided for training activities, the state currently designates some of it for certain activities, including training on infant and toddler care and a mentor program for teachers and directors. Other funding is distributed locally and may be used for high local priorities, including whatever type of professional development is viewed as beneficial to providers. Currently, a small number of quality programs are focused specifically on special education‑related training. One such program, the Map to Inclusive Child Care Project, develops materials and disseminates information about inclusive best practices to child care providers. The state also provides $50 million for the Quality Rating Improvement System each year. These funds are used to evaluate the quality of State Preschool providers and offer additional professional development resources to help providers improve or maintain program quality. Additionally, the state provides $1.6 million annually through the Family Literacy Supplemental Grant program. This program funds certain preschools to provide professional development opportunities on a variety of topics, including resources and services for children with disabilities. Beyond all these efforts, the 2015‑16 Budget Act increased the preschool reimbursement rate by 1 percent to extend more professional development opportunities to all State Preschools.
State Funds Child Care Revolving Loan Program to Help With Facilities. Since 1997, the state has supported child care facilities projects through the Child Care Facilities Revolving Fund (CCFRF). The CCFRF provides child care and preschool providers with interest‑free loans that have a maximum ten year repayment period. Providers may use the loans to (1) purchase new relocatable facilities or (2) renovate existing facilities to make them suitable for child care or preschool. For new facilities, providers can receive loans of up to $420,000 to purchase a single relocatable facility (that has three 12‑by‑40 foot modules) and $140,000 for every additional module. For renovations, providers can receive a loan amount equal to their annual operating contract amount, which is based primarily on the number of children they serve.
Facility Program Has Lacked Demand in Recent Years. Recently, demand from child care and preschool providers for CCFRF loans has been low. In 2016‑17, CDE received no new applicants for CCFRF funds. The CCFRF ended that year with a fund balance of $28.6 million. CDE is in the process of doing more outreach to providers about the program. Some providers, however, have expressed hesitancy to accept a loan out of concern they might not be able to pay it off.
Governor’s Proposal
Provides One‑Time Funding for Early Education Expansion. The Governor’s budget provides $125 million Proposition 98 funding for LEAs and $42 million federal TANF funding for non‑LEAs for a one‑time competitive grant initiative. The initiative is intended to increase the availability of mainstream child care and preschool opportunities for children with disabilities from birth through age 5. Grant recipients must provide a $1 local match for every $3 state grant dollars received. Additionally, recipients must serve children in high‑need communities. The grant proposal is one of many proposals included in the Governor’s budget intended to address poor outcomes for students with disabilities.
Funds Could Be Used for Various Purposes. The one‑time grant, open to school districts and other child care and preschool providers, could be used for a variety of purposes, including training, facility renovations, and equipment. Grant recipients would be required to demonstrate how the funding helped increase access to subsidized care for children with disabilities.
Assessment and Recommendation
One‑Time Funding Unlikely to Improve Program Quality on a Lasting Basis. We believe the Governor’s interest in improving outcomes for students with disabilities is laudable. To date, the administration, however, has provided no evidence demonstrating that one of the main causes of poor performance in this area is due to lack of mainstream opportunities for children birth through age five. We have heard anecdotally that some child care and preschool providers feel ill‑equipped to address the needs of children with disabilities. Such claims indicate an ongoing issue unlikely to be addressed in a sustained way with one‑time funding. This is likely to be particularly the case with child care and preschool staff, who reportedly have high turnover rates. If the Legislature determined existing professional development opportunities in this area were insufficient, it could reallocate existing quality improvement funding to prioritize special education‑related training. Specifically, it could prioritize quality improvement funding for training to providers already serving children with disabilities in mainstream settings or agreeing to increase the number they serve in these settings. In addition to reallocating funding the state already uses for professional development, the Legislature could consider providing more total ongoing funding for these purposes.
Facility Needs Could Be Funded Through Existing Program. Were the Legislature to determine that expanding mainstream opportunities for young children was a priority, the state could use the existing CCFRF program to help expand such opportunities. Given existing lack of demand for CCFRF loans, the Legislature could work with CDE to explore ways to make this program more attractive to providers. For example, it might consider making a portion of the CCFRF available as grants, extending the repayment period, and/or broadening the allowable uses of the funds to ensure providers could make special education‑related renovations, including those renovations that might be required to mainstream children with disabilities.
Reject Proposal, Consider Funding Existing Programs. Given these concerns, we recommend rejecting the Governor’s proposal. If the Legislature wishes to expand the availability of mainstream opportunities for children with special needs, it could do so by reallocating, modifying, or increasing funding for existing programs.
State Preschool
In this section, we first discuss the Governor’s proposals to increase State Preschool rates and slots as part of the final phase of a multiyear budget agreement. We then discuss key issues relating to the state’s decision last year to exempt LEA‑run State Preschool programs from licensing standards.
Rates and Slots
Below, we provide an overview of the State Preschool program, analyze the Governor’s proposals for this program, and offer associated recommendations.
Background
State Preschool Serves Low‑Income Children. State Preschool provides part‑day or full‑day programs to qualifying three‑ and four‑year olds. To qualify for either part‑day or full‑day programs, children must come from families earning below 70 percent of the state median income. In 2017‑18, this threshold equated to $52,076 for a family of three. (The threshold increases as family size increases.) To qualify for full‑day programs, parents have the added requirement that they must be working or in school.
State Preschool Is Offered by LEA and Non‑LEA Providers. Roughly half of State Preschool providers are LEAs (school districts or COEs). LEAs provide about two‑thirds of all State Preschool slots. The remaining half of preschool providers are non‑LEAs, typically nonprofit agencies. These agencies provide about one‑third of State Preschool slots.
Program Length and Funding Rates Differ for Part‑Day and Full‑Day Programs. The rules for the programs are:
- Part‑Day Program. A part‑day program must operate at least 3 hours a day for 175 days of the year. In 2017‑18, providers received $4,956 per child.
- Full‑Day Program. A full‑day program must operate at least 6.5 hours per day for 250 days of the year. In 2017‑18, providers received $11,433 per child.
The difference between the full‑day and part‑day funding rates ($6,477 in 2017‑18) is associated with the “wrap” portion of the full‑day program.
Funding Source for Wrap Portion of Full‑Day Program Varies by Provider Type. State Preschool is funded using a combination of Proposition 98 and non‑Proposition 98 General Fund. All funding for part‑day State Preschool—whether provided by LEAs or non‑LEAs—is provided with Proposition 98 General Fund (see Figure 24). For the wrap portion of full‑day programs, LEAs are funded with Proposition 98 General Fund whereas non‑LEAs are funded with non‑Proposition 98 General Fund.
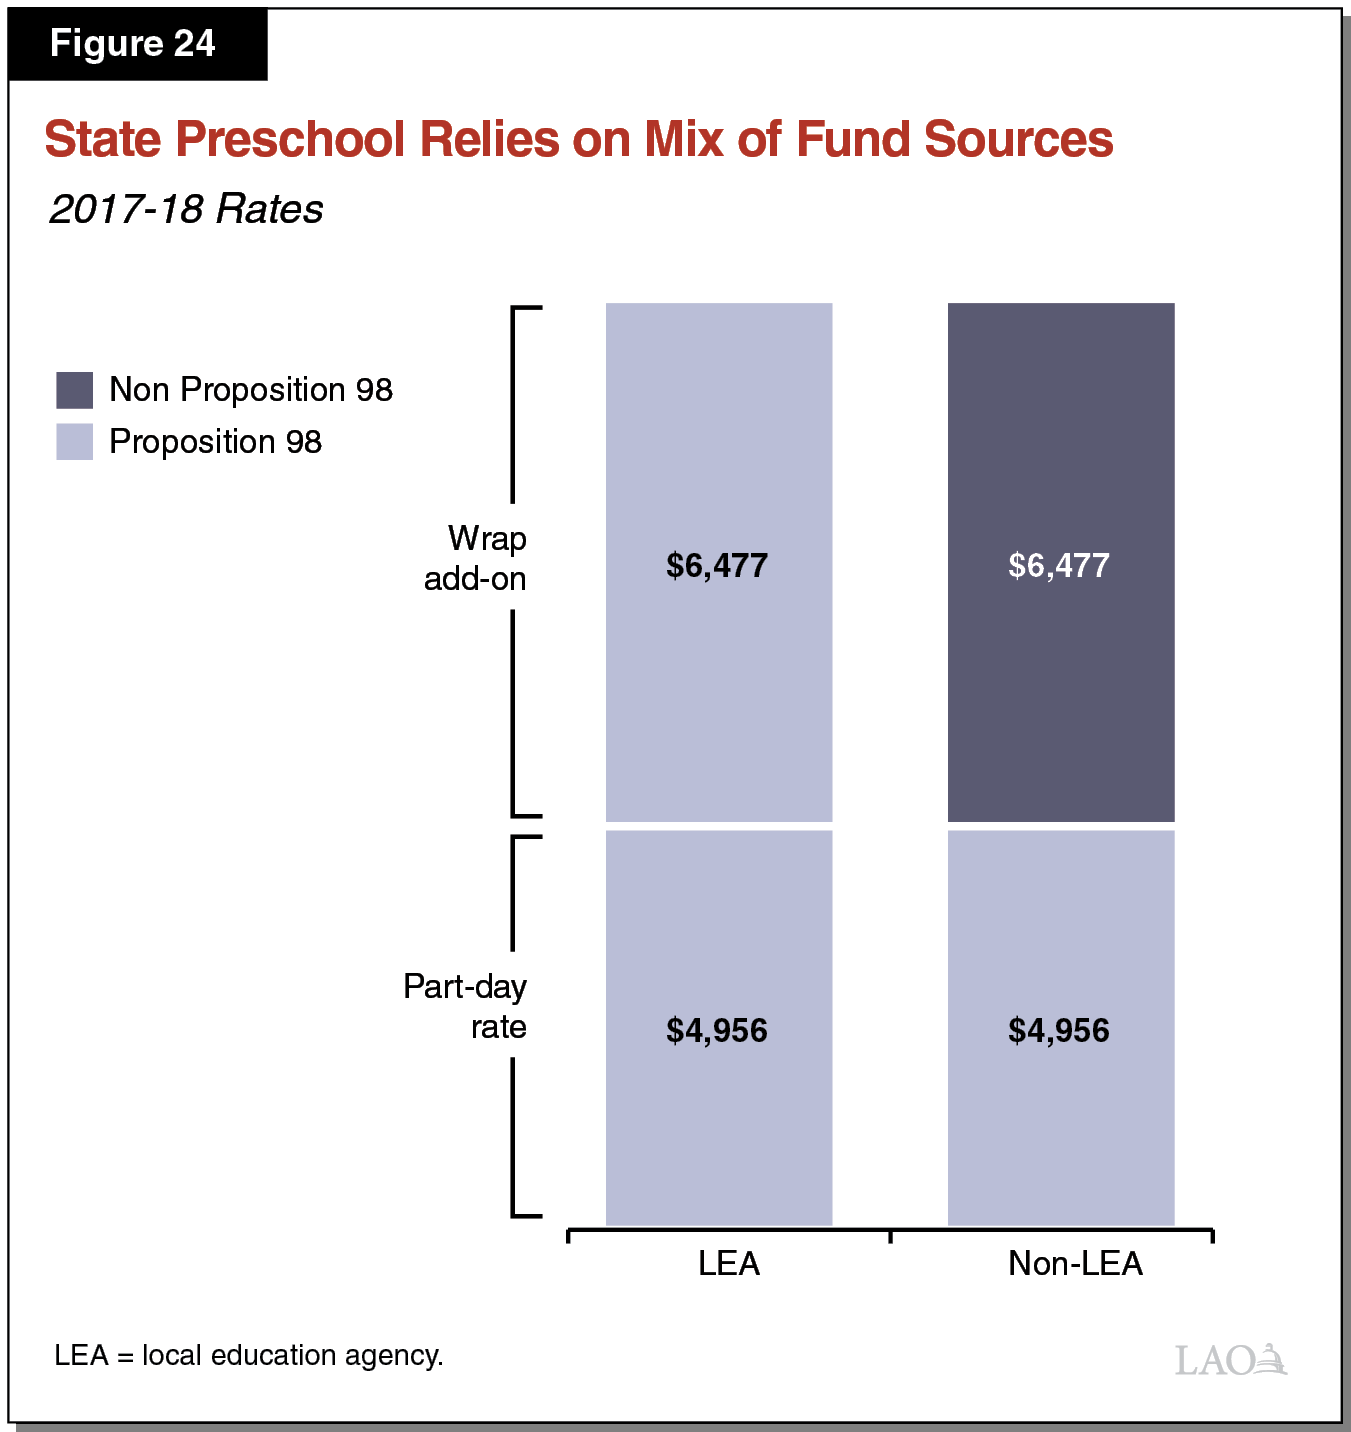
Funding Source for Wrap Has Shifted in Recent Years. Prior to 2011‑12, all State Preschool was funded within Proposition 98. In 2011‑12, the state shifted the wrap portion (as well as all other child care programs) outside of Proposition 98. In 2015‑16, the wrap portion for LEA‑run full‑day programs was shifted back into Proposition 98, while non‑LEA wrap funding remained outside of Proposition 98.
Multiyear Budget Agreement Committed to Rate and Slot Increases. As part of the 2016‑17 budget package, the Legislature and the Governor agreed on a multiyear plan to increase rates and slots for child care and preschool programs. The preschool part of this agreement was to be funded within Proposition 98. In 2016‑17, the state provided Proposition 98 General Fund of $44 million for rate increases and $8 million for an additional 2,959 slots initiated April 1, 2017. In 2017‑18, the state provided Proposition 98 General Fund of $61 million for rate increases and $8 million for an additional 2,959 slots initiated April 1, 2018.
Governor’s Proposal
Increases Funding for Rates. In accordance with the multiyear budget agreement, the Governor’s budget includes $32 million Proposition 98 General Fund (and $16 million non‑Proposition 98 General Fund) for a 2.8 percent rate increase to state preschool and certain child care programs. The budget also includes $28 million Proposition 98 General Fund (and $22 million non‑Proposition 98 General Fund) for a 2.51 percent COLA. In total, the Governor’s budget increases State Preschool rates 5.4 percent, with the part‑day rate rising to $5,222 and the full‑day rate rising to $12,047. We have no concerns with the rate increase proposals.
Provides Funding for Full‑Day LEA Slot Increases. The Governor’s budget includes $19 million to annualize the cost of 2,959 full‑day State Preschool slots for LEAs approved in the 2017‑18 budget and set to be initiated April 1, 2018. The budget also includes $8 million to add 2,959 new full‑day State Preschool slots at LEAs starting April 1, 2019. These increases are in accordance with the final augmentations set forth in the multiyear budget agreement.
Assessment
Recent Slot Increases for LEAs Have Not Been Fully Utilized. To allocate new slots across the state, CDE requests applications from interested entities and awards contracts to those that demonstrate they can meet the minimum program requirements. Of the 2,959 slots funded beginning April 2017, CDE issued 1,768 to interested LEAs in its first‑round application. Due to lack of applicants, CDE used its administrative flexibility to issue the remaining slots in different ways. When CDE ran a second request for applications, it issued 2,799 additional part‑day slots to LEAs. For the new slots to be funded beginning in April 2018, CDE has run a request for applications. It has received applications from 33 LEAs seeking 1,043 full‑day slots and 55 non‑LEAs seeking 2,544 full‑day slots. CDE has not yet made award decisions.
Non‑LEAs Have Utilized Full Day Slots When Given the Opportunity. Data from 2015‑16 shows high utilization of new slots among non‑LEAs. In 2015‑16 non‑LEAs fully utilized 1,200 new State Preschool slots earmarked for them in the budget. Non‑LEAs also utilized much of the funding that had been initially set aside for new slots at LEAs. Of the 5,830 full‑day state preschool slots for LEAs added in 2015‑16, CDE issued only 1,646 of the 5,830 full‑day State Preschool slots for LEAs. To distribute the remaining available funding, the department converted and eventually issued 3,700 part‑day LEA slots, 851 part‑day non‑LEA slots, and 1,490 full‑day non‑LEA slots. As noted above, non‑LEAs continued to show interest in full‑day slots in 2016‑17, and they very likely will end up using some of the 2017‑18 slots that remain after soliciting applications from LEAs.
Different Funding Sources Reduces State Flexibility in Adding Full‑Day Slots. Prior to 2015‑16, the state funded the wrap portion of all full‑day State Preschool slots from the same fund source. As a result, budgeting was more straightforward. Since 2015‑16, splitting the fund source for wrap between Proposition 98 and non‑Proposition 98 General Fund has complicated budgeting and the allocation of slots. The department typically has had to run multiple application rounds and has been unable to offer full‑day slots to interested non‑LEAs until the second or third rounds.
Recommendations
Shift All State Preschool Wrap Into Proposition 98. We recommend the Legislature shift all non‑LEA wrap ($176 million) into Proposition 98. Having all State Preschool programs funded entirely within Proposition 98 provides the state with flexibility to distribute slots to any interested provider.
Moving Forward, Make Any New Slots Available for Both Type of Providers. If the Legislature is interested in supporting more full‑day State Preschool slots either in 2018‑19 or future years, we recommend it make any new slots available to both LEA and non‑LEA providers. Such an approach would ensure that all providers have access to new funding and increase the likelihood that slots will be fully utilized.
Licensing
Below, we provide background on licensing requirements for State Preschool providers and describe recent legislation exempting LEAs from these requirements. We then share the conclusions of a recent stakeholder group we were tasked with convening to ensure LEAs exempt from licensing requirements still have safe and healthy preschool settings. We end by offering a few comments relating to further work the Legislature could consider in this area.
Background
State Preschool Providers Must Meet Health and Safety Standards. These standards are commonly referred to as Title 22 standards—named after the regulations creating them. The standards currently apply to all preschool centers in the state. Title 22 regulations include many requirements. For example, the regulations require that classrooms be clean and sanitary, children be constantly supervised, teachers be trained in first aid, and medication and cleaning supplies be stored out of reach of children. The standards are established and periodically revised by Community Care Licensing (CCL)—a division of the Department of Social Services (DSS).
CCL Is Responsible for Monitoring and Enforcing Title 22 Standards. The CCL processes applications for licenses, conducts regular inspections, responds to public complaints, and maintains a database of licensing violations. The CCL typically visits licensed facilities every three years, with more frequent inspections under certain circumstances. In addition, CCL visits facilities in response to complaints from the public. After receiving a public complaint, CCL is required to visit the facility within 10 days and determine whether a violation has occurred.
State Preschool Providers Also Must Meet Developmental Standards. These standards are commonly referred to as Title 5 standards, after the regulations creating them. The standards include a mix of health, safety, and programmatic requirements. For example, Title 5 regulations require that furniture and toys be clean and classrooms be set up with multiple stations to support different types of learning (for example, classrooms could have separate science and art areas). State Preschool providers also must include cognitive development and an educational component as part of their programs—commonly referred to as “learning foundations.” The learning foundations describe the skills that preschool‑age children should be able to exhibit.
CDE Is Responsible for Monitoring Title 5 Compliance. The CDE monitors and approves all contracts for State Preschool. As part of their contract requirements, providers must conduct annual self‑evaluations and submit the results to CDE. In addition, CDE conducts monitoring visits every three years (or as resources allow). Providers that do not meet Title 5 standards are placed on conditional status and cannot receive additional funds until they address the specific issues identified by CDE.
State Preschool Providers Must Follow Uniform Complaint Procedures. All LEAs are required to respond to certain types of complaints using Uniform Complaint Procedures (UCP). The state’s UCP establish the basic responsibilities of complainants, schools, and CDE in resolving an issue. LEAs must investigate each UCP complaint and issue a written decision within 60 days. LEAs and non‑LEAs receiving State Preschool funding must follow UCP to address complaints involving the developmental aspects of preschool programs. Under current regulations, complaints related to preschool health and safety go directly to CCL for investigation.
Expedited UCP Timelines for Complaints Related to Williams Lawsuit. The state has more expedited timelines for certain categories of complaints relating to a lawsuit filed against the state in 2000 and settled in 2004. Specifically, the Williams case focused on facility conditions that posed a health or safety risk, teacher misassignments or vacancies, and availability of instructional materials. For these issues, LEAs must resolve complaints within 30 days and notify the complainants of their decision within 45 days. Unlike for the general UCP process, members of the public can anonymously submit complaints related to Williams issues.
LEA‑Run State Preschools to Be Exempt From Title 22 Standards. Last year, the budget package included trailer legislation—Chapter 15 of 2017 (AB 99, Committee on Budget)—that affected LEAs operating State Preschool programs. Specifically, beginning July 2019, Chapter 15 exempts LEA‑run State Preschool programs from Title 22 licensing standards if they operate in a facility that meets school building standards.
Prior to Exemption Going Into Effect, State to Consider Whether Standards Should Be Added for LEAs. Chapter 15 required our office to convene a stakeholder group to discuss whether additional statute or regulations should be adopted to ensure LEAs continue to meet basic health and safety standards. As set forth in Chapter 15, the stakeholder group was to include LEA and non‑LEA experts on early childhood health and safety issues, as well as various state‑level representatives. Although not limited in its review, the stakeholder group was specifically required to review standards related to (1) outdoor shade structures, (2) access to age‑appropriate bathroom and drinking water facilities, and (3) processes for parent notification and resolution of violations. Chapter 15 required us to report the group’s findings to the Legislature by March 15, 2018. Below, we fulfill this statutory requirement.
Stakeholder Group
Group Included LEA and Non‑LEA Providers. Our office convened four meetings of the stakeholder group between October and December 2017. The group included three LEA providers, three non‑LEA providers, and representatives from the Legislature, DSS, CDE, and the Department of Finance.
Stakeholder Group Recommends Adding Several Health and Safety Requirements to Title 5. As Figure 25 shows, the stakeholder group recommends adding several new requirements to Title 5 standards. In all cases, the recommendations are very similar to existing Title 22 standards. To assist with monitoring these new health and safety requirements, the group recommends CDE develop a health and safety checklist to be used by CDE staff in its monitoring visits.
Figure 25
Stakeholder Group Proposes Several New Title 5 Requirements
|
|
|
|
|
|
Group Also Recommends Expedited UCP Process for Preschool Health and Safety Issues. With regards to notifying parents and resolving complaints involving preschool health and safety issues, the stakeholder group recommends using the existing UCP process, with timelines similar to those of Williams complaints. This would allow members of the public to submit complaints anonymously, require complaints be resolved within 30 days, and require complainants be notified of a decision within 45 days. The group also recommends requiring LEAs to begin investigating complaints within 10 days of submittal—the same time requirement that currently applies to CCL investigations. In addition, the group recommends requiring LEAs post in each State Preschool classroom information regarding health and safety standards and the process for filing a complaint. This is the same as existing Williams requirements.
Ambiguity Regarding Exemptions for Classrooms With Mixed Funding Sources. In its discussions, the stakeholder group identified ambiguity under the new law with regards to which LEAs may be exempt from licensing requirements. Specifically, state law is not clear on whether preschool classrooms funded through a combination of State Preschool and other sources (for example, federal Head Start or fees from private‑pay families) are exempt from licensing. This lack of clarity may create confusion among providers and the state agencies responsible for monitoring them.
Comments
Stakeholder Recommendations Are Reasonable. The state exempted LEA‑run State Preschools from licensing with the intent of providing greater flexibility to align State Preschool with other LEA‑run programs, including preschool classes for students with disabilities and kindergarten. By adding only a small fraction of existing Title 22 requirements to Title 5, the recommendations of the stakeholder group would continue to provide significant flexibility for LEAs. By using the existing UCP process, the recommendations also allow LEAs to use their existing complaint policy and procedures and avoid creating an entirely new structure solely for State Preschool complaints. Given the recommended new standards focus on health and safety issues, we also think using the expedited Williams‑related UCP timelines is a reasonable approach.
Monitor and Align State Agency Funding Based on Workload. Exempting LEA‑run State Preschool programs from licensing likely will reduce CCL’s associated monitoring and enforcement workload. Adding new requirements to Title 5 regulations, however, could increase workload at CDE. Specifically, CDE could have minor one‑time workload increases related to developing new regulations and guidance, as well as ongoing workload increases if its monitoring visits become more extensive. Over the next few years, we recommend the Legislature monitor workload at both agencies to determine if funding should be shifted to better align with changes in their workload.
Clarify Which Classrooms Are Exempt. To provide clarity and prevent related implementation delays, we recommend the Legislature clarify whether the licensing exemption applies to mix‑funded classrooms. If the Legislature is interested in maximizing flexibility for LEAs, it could apply the exemption broadly to any classroom serving at least one State Preschool student. Such an approach would give LEAs authority to provide preschool to any child without needing to be licensed from CCL. Alternatively, the Legislature could limit the exemption only to classes fully supported by State Preschool funds. This approach would limit LEAs’ flexibility to integrate their State Preschool funds with their other preschool funding. The exemption, however, still would provide districts some additional flexibility relative to the existing licensing rules.
Kindergarten
Chapter 15 of 2017 (AB 99, Committee on Budget) required our office to identify options for incentivizing full‑day kindergarten programs. In particular, we were directed to examine an option that would offer different funding rates for full‑day and part‑day programs. In this section, we provide background on kindergarten programs in California, analyze available data on full‑day and part‑day programs, and fulfill our statutory requirement to identify options for incentivizing full‑day programs.
Background
California Kindergarten Programs Serve About 535,000 Children. Of these children, about 453,000 attend kindergarten, which serves children who turn five before September 2. An additional 82,000 children attend transitional kindergarten, serving those who turn five between September 2 and December 2. (We refer to both kindergarten and transitional kindergarten as “kindergarten” throughout this section.)
Kindergarten Programs Must Satisfy Basic State Requirements. State law requires all elementary and unified districts to offer kindergarten classes that are taught by credentialed teachers and adhere to California’s content standards. Each program must operate for at least 180 minutes (3 hours) a day. Some schools, however, operate longer programs, up to 6.5 hours per day. State law forbids schools from having a single teacher lead two separate kindergarten classes in a single day, such that schools running part‑day kindergarten programs must hire separate teachers for their morning and afternoon classes.
State Funds Both Full‑Day and Part‑Day Kindergarten at Same Rate. Under longstanding budget practice, school districts generate the same amount of state funding for a child enrolled in full‑day kindergarten as one enrolled in part‑day kindergarten. In 2017‑18, school districts are receiving an estimated base rate of $7,700 in LCFF funding per kindergarten student, the same base rate generated by students in grades 1‑3. (State law does not distinguish between full‑day and part‑day kindergarten. In this section, we define part‑day kindergarten as programs operating fewer than 4 hours per day.)
Analysis
Most Districts Already Operate Full‑Day Kindergarten Programs. CDE recently surveyed a random sample of 62 school districts and found about 60 percent operate only full‑day kindergarten programs, 20 percent operate both full‑day and part‑day programs, and about 20 percent operate only part‑day programs. Among survey respondents, the average full‑day kindergarten program lasted 5.6 hours per day, whereas the average part‑day program lasted 3.5 hours per day.
Part‑Day Programs Typically Cost Only Somewhat Less Than Full‑Day Programs. Among the costs associated with kindergarten programs, teacher compensation is by far the largest on a per‑child basis. Importantly, districts hire mostly full‑time teachers, and they pay their kindergarten teachers the same salaries regardless of whether they participate in full‑day or part‑day programs. Whereas a teacher in a full‑day program instructs a certain number of children throughout the day, a teacher in a part‑day program typically instructs about the same number of children in either a morning or afternoon session, while serving in other district capacities throughout the remainder of his or her work day (often as an aide in other classrooms). The associated compensation costs are the same in these two cases. Part‑day kindergarten programs could cut costs by employing part‑time teachers, but it appears that such practice is rare. Theoretically, they also could cut costs by having one teacher lead two separate kindergarten classes—one in the morning and the other in the afternoon—but state law forbids this practice. For most part‑day programs, the only notable savings relative to full‑day programs comes from sharing some instructional materials, equipment, and facilities between two classes.
Districts Cite a Lack of Facilities as Main Impediment to Full‑Day Kindergarten. In its recent survey, CDE found most districts offering part‑day programs were interested in offering full‑day kindergarten but did not have enough facility space. Part‑day kindergarten reduces the need for facility space by allowing one morning and one afternoon class to share the same space. CDE’s findings confirm what we have heard in many interviews with local administrators—facilities are a major impediment to full‑day kindergarten.
Existing State Kindergarten Funding Policies Not Hindering Full‑Day Programs. Given more than half of districts already offer exclusively full‑day programs and another 1 in 5 districts offer a mix of full‑day and part‑day programs, the state’s current funding policies appear sufficient for incentivizing full‑day programs.
Options for Legislative Consideration
Two Options to Consider. If the Legislature were interested in taking additional steps to incentivize full‑day kindergarten, we think the following two options are promising. If desired, the Legislature could implement both of the options simultaneously (using possible savings generated from option two to cover the costs of option one).
State Could Incentivize More Full‑Day Kindergarten Programs by Providing Facility Funding. Given many districts cite a lack of facilities as an impediment to full‑day kindergarten, the Legislature could allocate more facility funding to districts looking to switch from part‑day to full‑day programs. The Legislature would have various options to consider when designing such a facility program, including grant and loan options. Regarding a grant program, the Legislature, for example, could provide one‑time incentive grants equal to a share of the cost of a new kindergarten facility. Similarly, for a possible loan program, the Legislature could allow school districts to qualify for a loan equal to a share of their costs, with specified loan conditions, including certain interest terms and repayment period.
State Could Further Incentivize Full‑Day Kindergarten by Reducing Part‑Day Rates. The Legislature specifically directed us to consider how the state could incentivize full‑day kindergarten by establishing different funding rates for part‑day and full‑day programs. The Legislature could incentivize full‑day kindergarten by reducing part‑day funding rates. For example, it could reduce part‑day funding rates by the difference in hours between the average part‑day and full‑day programs in CDE’s survey sample (about 35 percent). Assuming the 2018‑19 funding rates in the Governor’s budget, this would equate to about $5,300 in base LCFF funding per child in part‑day programs compared to $8,100 per child in full‑day programs. If the change were implemented in 2018‑19, we estimate possible savings of hundreds of millions of dollars statewide, as many districts might not be able to convert immediately to full‑day programs, particularly given their facility constraints. Over the long run, the savings would evaporate if districts found facility solutions and converted to full‑day programs, thereby “earning” back the higher funding level.
Pension Costs
In this section, we provide background on the two state pension systems covering school employees, compare growth in pension costs with growth in districts’ Proposition 98 funding, highlight a few other key pension issues, and make pension‑related budget recommendations.
Background
State Has Two Pension Systems Covering District Employees. Nearly all school and community college employees in California are eligible to receive a pension when they retire. Depending upon their job, they participate in one of two pension systems. The California State Teachers’ Retirement System (CalSTRS) administers pensions for certificated employees, including teachers and administrators. The California Public Employees’ Retirement System (CalPERS) administers pensions for all other employees, including paraprofessionals, office workers, and maintenance staff. Both systems are funded through contributions from districts and employees. In addition, CalSTRS receives a direct appropriation from the state. CalSTRS is the only pension system in California for which the state makes direct contributions on behalf of local agencies. Of all district employees participating in these pension systems, about 60 percent are members of CalSTRS and 40 percent are members of CalPERS.
Unfunded Pension Liabilities Have Been Growing Since Early 2000s. Both CalSTRS and CalPERS were fully funded for a brief period around 2000. This means they had enough assets on hand to pay for the future benefits that members were estimated to have earned to that point. Around this time, the state increased pension benefits for CalSTRS and CalPERS employees and reduced state contributions to CalSTRS. These actions, combined with weak investment returns during the early 2000s, resulted in significant “unfunded liabilities” at both pension systems. These unfunded liabilities grew notably during the Great Recession when both systems experienced large investment losses.
Growth in Unfunded Liabilities Prompts Legislative Concern. By the latter years of the Great Recession, CalSTRS was projected to run out of money in the mid‑2040s—a short time horizon for a pension system. This development spurred a sense of urgency among the Legislature, as waiting to address the problem would have made any eventual solution even harder on district budgets. Similarly, in the wake of the Great Recession, policies in place at CalPERS meant that it would take many decades to pay off its unfunded liabilities. Concerns on both fronts prompted legislative action.
State Modified Pension Benefits for Employees Hired After 2012. In 2012, the Legislature enacted pension legislation known as PEPRA (Public Employees’ Pension Reform Act). The legislation affected many state and local government employees, including school and community college employees. Specifically, PEPRA reduced pension benefits for new CalPERS and CalSTRS hires and required employees in both systems to pay half the annual cost of their pension benefits. These changes, in combination with numerous other changes, are expected to reduce state and local government pension costs by tens of billions of dollars in the coming decades.
State Approved CalSTRS Funding Plan in 2014. Around the time the Legislature adopted PEPRA, it began studying ways to pay down the unfunded CalSTRS liability. After two years of hearings, the Legislature enacted a statutory plan designed to eliminate this liability gradually over the next few decades. As Figure 26 shows, the plan phased in higher contributions from the state, districts, and teachers over multiple years. The top section of the figure shows the required contribution rates as a percent of salary and the bottom section shows the associated contribution costs. Though the funding plan will improve the CalSTRS funding situation over time, the current estimate of the unfunded CalSTRS liability remains high—standing at $97 billion. The state attributes about two‑thirds of this liability to districts and one‑third to the state. The share of the liability borne by districts and the state will change somewhat over time, as the state share is more sensitive to various factors, including fluctuations in CalSTRS investment returns.
Figure 26
Contributions to CalSTRS
(Dollars in Billions)
|
2013‑14 |
2014‑15 |
2015‑16 |
2016‑17 |
2017‑18 |
2018‑19 |
2019‑20 |
2020‑21 |
|
|
Rates |
||||||||
|
Statea |
5.2% |
5.7% |
7.1% |
8.6% |
9.1% |
9.6% |
10.1% |
10.6% |
|
School/College Districts |
8.3 |
8.9 |
10.7 |
12.6 |
14.4 |
16.3 |
18.1 |
19.1 |
|
Teachers (pre‑PEPRA) |
8.2 |
9.2 |
10.3 |
10.3 |
10.3 |
10.3 |
10.3 |
10.3 |
|
Teachers (PEPRA) |
8.2 |
8.6 |
9.2 |
9.2 |
9.2 |
10.2 |
10.2 |
10.2 |
|
Costs |
||||||||
|
Stateb |
$1.4 |
$1.5 |
$1.9 |
$2.5 |
$2.8 |
$3.1 |
$3.4 |
$3.8 |
|
School/College Districtsc |
2.3 |
2.7 |
3.4 |
4.2 |
4.9 |
5.8 |
6.7 |
7.4 |
|
Teachersc |
2.3 |
2.5 |
3.0 |
3.4 |
3.4 |
3.6 |
3.8 |
3.9 |
|
Totals |
$5.9 |
$6.7 |
$8.3 |
$10.1 |
$11.1 |
$12.4 |
$13.9 |
$15.1 |
|
aIncludes state contributions to Supplemental Benefits Maintenance Account. bAmounts through 2017‑18 are actuals. Thereafter, amounts are LAO estimates. cAmounts through 2016‑17 are based on tables in the annual Governor’s Budget. Thereafter, amounts are LAO estimates. CalSTRS = California State Teachers’ Retirement System and PEPRA = Public Employees’ Pension Reform Act. |
||||||||
CalPERS Also Taking Action to Address Its Unfunded Liabilites. Whereas the governing board of CalSTRS has limited authority to change district contribution rates, the governing board of CalPERS has much greater authority. In recent years, CalPERS has been increasing the district rate to address its unfunded liability (see Figure 27). Despite these rate increases, the CalPERS unfunded liabilty associated with school and community college districts currently stands at nearly $22 billion.
Figure 27
Contributions to CalPERSa
(Dollars in Billions)
|
2013‑14 |
2014‑15 |
2015‑16 |
2016‑17 |
2017‑18 |
2018‑19 |
2019‑20 |
2020‑21 |
|
|
Rates |
||||||||
|
School/college districts |
11.4% |
11.8% |
11.8% |
13.9% |
15.5% |
17.7% |
20.0% |
22.7% |
|
Employees (pre‑PEPRA) |
7.0 |
7.0 |
7.0 |
7.0 |
7.0 |
7.0 |
7.0 |
7.0 |
|
Employees (PEPRA) |
6.0 |
6.0 |
6.0 |
6.0 |
6.5 |
7.3 |
7.3 |
7.3 |
|
Costsb |
||||||||
|
School/college districts |
$1.3 |
$1.3 |
$1.4 |
$1.8 |
$2.0 |
$2.4 |
$2.8 |
$3.2 |
|
Employees |
0.7 |
0.8 |
0.9 |
0.9 |
0.9 |
0.9 |
1.0 |
1.0 |
|
Totals |
$2.1 |
$2.1 |
$2.3 |
$2.7 |
$2.9 |
$3.3 |
$3.7 |
$4.2 |
|
aDoes not reflect effects of new actuarial assumptions adopted by the CalPERS board in December 2017. bAmounts through 2016‑17 from CalPERS’ Comprehensive Annual Financial Report. Thereafter, amounts are projections based on CalPERS data. CalPERS = California Public Employees’ Retirement System and PEPRA = Public Employees’ Pension Reform Act. |
||||||||
Comparing Pension Costs and District Funding
District Pension Costs Rising by Around $1 Billion Per Year. Figure 28 shows school and community college districts’ pension contribution costs from 2013‑14 through 2020‑21, with actual costs shown through 2016‑17 and estimated costs shown thereafter. In 2017‑18, district contributions are estimated to total $6.9 billion, an increase of $3.3 billion over the 2013‑14 level (the year prior to the adoption of the CalSTRS funding plan). Of this $3.3 billion increase, $3 billion is higher school costs and $308 million is higher community college costs. Over the next three years, we expect school and community college pension contributions to increase another $3.8 billion. By 2020‑21, we estimate that total district contributions would approach $10.7 billion—more than three times greater than the 2013‑14 contribution level.
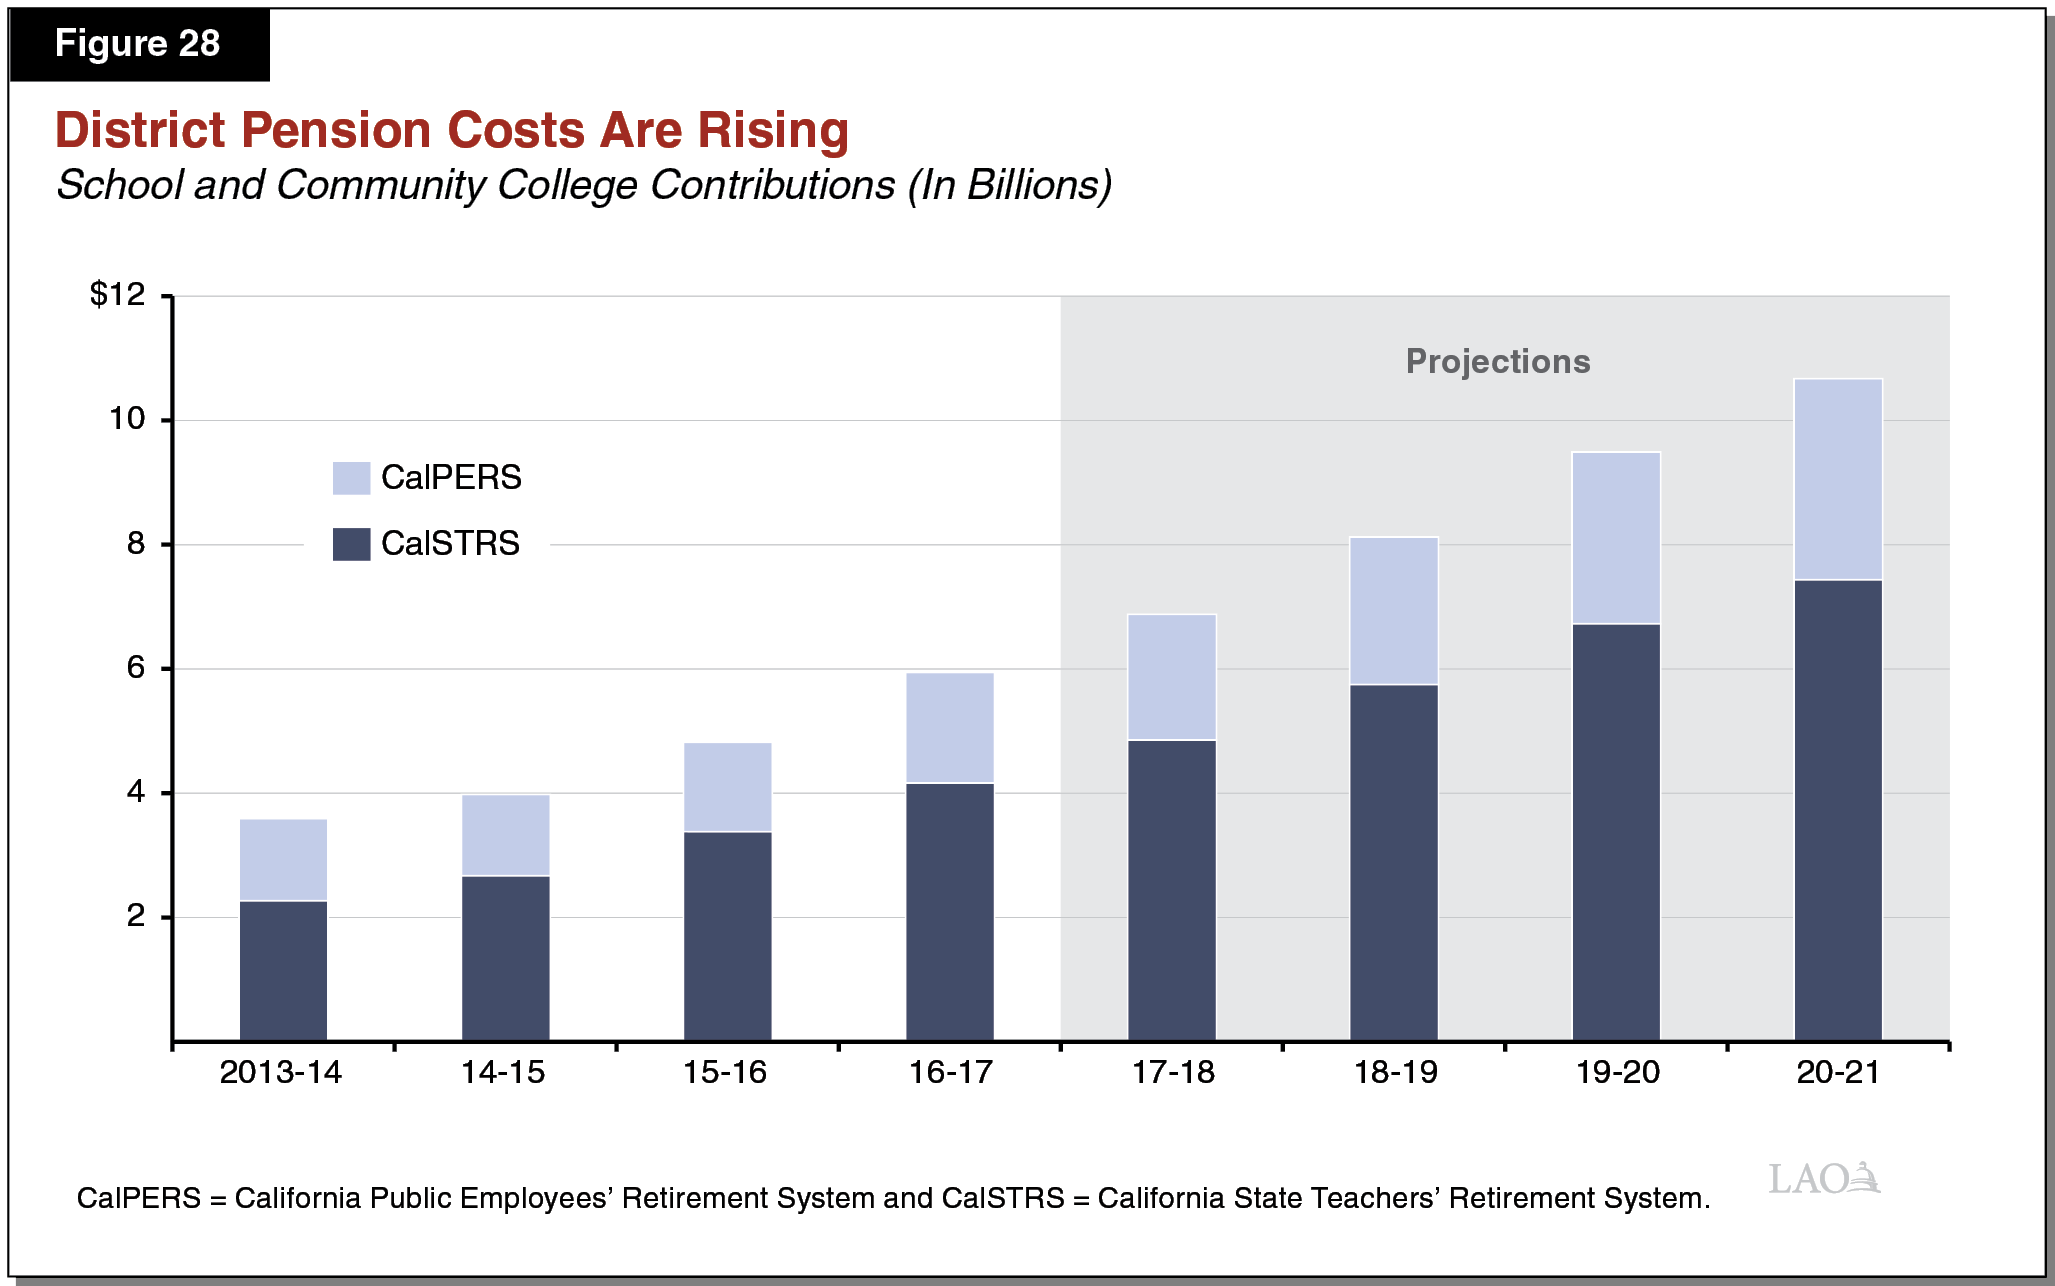
Proposition 98 Funding Has Increased More Quickly Than Pension Costs Over the Past Four Years. The Proposition 98 minimum guarantee has increased significantly in recent years. Between 2013‑14 and 2017‑18, the guarantee grew by more than $16 billion (28 percent). Of this increase, about $14 billion was for school districts, $1.7 billion for community colleges, and $500 million for the Adult Education Block Grant (part of the community college budget). The state has allocated the bulk of the additional Proposition 98 funding through the LCFF and community college apportionments, which carry fewer spending restrictions than categorical programs. The $3.8 billion increase in school and community college pension costs over this same period equates to about one‑fifth of the increase in Proposition 98 funding. The large increase in funding beyond the growth in pension costs means that most school and community college districts have been able to expand programs, increase staffing, and provide raises over this period.
Funding Increases Vary Across Districts. Whereas all districts face the same increases in pension contribution rates, district funding increases vary notably. Under the LCFF, school districts with relatively high numbers of EL/LI students and below‑average historical funding rates have been receiving relatively large increases. Conversely, school districts with fewer EL/LI students and above‑average historical funding rates have been receiving relatively smaller increases. Over the past four years, we estimate that the 20 percent of school districts with the greatest and lowest growth experienced per‑pupil funding increases averaging about 50 percent and 15 percent, respectively. Districts in the former group likely have been able to increase programs and services notably, even with the pension rate increases. By comparison, districts in the latter group have had less ability to expand programs. Although funding increases also vary across community college districts, these differences tend to be smaller because their funding formulas are linked to enrollment and have not changed significantly over the past four years.
Pension Costs Likely More Difficult to Accommodate Over the Next Three Years. Even under favorable economic conditions, pension costs are likely to be more difficult for all districts to accommodate over the next three years. Under the economic growth scenario we developed for our November fiscal outlook, we calculated the minimum guarantee would grow nearly $9 billion from 2017‑18 to 2020‑21. Over that same period, annual school and community college pension contributions would increase by $3.8 billion. That is, the increase in pension costs would equate to more than 40 percent of the increase in projected Proposition 98 funding. If pension cost increases comprise a larger share of growth in Proposition 98 funding moving forward, districts would have correspondingly less funding to expand programs, staffing, and salaries. Some districts will be more constrained than others due to their particular budget conditions, including their projected growth in funding and previous spending decisions.
Covering Costs Would Be Much More Difficult Under a Recession Scenario. Whereas funding outpaces pension costs under an economic growth scenario, a recession would pose a much greater challenge. In our November outlook, we modeled a scenario that assumed a moderate recession began in the summer of 2019. By 2020‑21, the minimum guarantee under this scenario was more than $4 billion below the 2017‑18 level. Faced with economic downturns and declining revenue, districts typically respond through various actions, including lay‑offs, increasing class sizes, furloughs, salary reductions, and eliminating or consolidating programs. In this recession scenario, districts would have to make even greater reductions than usual because their budgets would have to accommodate the higher pension contribution rates scheduled over the next several years.
Key Considerations
Pension Costs Affected by District Payroll Decisions. Although districts do not control their pension contribution rates, they do control their salary and staffing levels. These decisions about payroll, in turn, affect their pension costs. In recent years, some districts have granted relatively large salary increases and hired additional staff, whereas others have granted smaller increases and hired fewer staff. For example, school district data show that cumulative teacher salary increases over the past three years have ranged from 17 percent (the average among the highest 20 percent of districts) to 4 percent (the average among the lowest 20 percent). The districts agreeing to the larger staffing and salary increases are experiencing faster growth in their pension costs than districts agreeing to smaller increases.
Some Districts Are Setting Aside Funds for Future Pension Cost Increases. Available data suggest that roughly 10 percent of districts in the state have set aside funding to pay for future CalSTRS or CalPERS contributions. In some districts, these funds consist of an earmark within their General Fund reserves, whereas other districts have established trust accounts where they invest their deposits. Districts typically make these deposits when they have one‑time funds or an unexpected surplus. For most districts, the goal of an earmarked reserve or trust account is to establish a source of funding they can draw upon during tighter fiscal times. By setting aside funds now—a period of sustained economic growth—these districts are better prepared than other districts to manage their pension costs during an economic downturn.
Few Practical Options for the State to Delay CalSTRS Rate Increases. Given the cost pressures imposed by rising pension costs, some districts have asked whether the state could delay or reduce the contribution increases scheduled under the CalSTRS funding plan. In our view, such proposals face significant legal and fiscal challenges. The courts generally have considered pension funding to be a contractual commitment designed to protect already agreed‑upon pension benefits. That is, courts tend to view delaying or reducing pension funding the same way they would view breaking a contract. Moreover, a delay or reduction in the district rate would eliminate the investment returns that CalSTRS could have earned on those contributions. These foregone returns would compound significantly over time and almost certainly result in higher long‑term district costs and larger unfunded liabilities. Given these factors, the state likely could delay or reduce district rate increases only if it provided CalSTRS with additional funding from the state General Fund.
Districts Also Face Retiree Health Liabilities. Separate from pension benefits, about two‑thirds of school districts provide health benefits for their retired employees. Traditionally, most districts have funded their retiree health benefits by paying costs as they come due, rather than setting aside money during their employees’ working careers. By deferring these payments, we estimate school districts have accumulated an unfunded liability of approximately $24 billion statewide. Though the majority of this liability is concentrated among about a dozen large school districts, nearly all districts that offer retiree health benefits have at least some unfunded liability. In 2015‑16, the latest year for which data are available, school districts spent $1 billion on retiree health benefits. This amount is likely to grow more quickly than inflation for the near future as health care costs continue to rise and districts pay the obligations associated with their unfunded liability. If districts were to set aside more funding for these benefits now, they could mitigate some of these future cost increases. This is because over time investment returns on those funds would cover an increasing share of the benefits paid to retirees. (Though we have not yet examined the comparable data for community colleges, our understanding is that some community colleges also have unfunded liabilities associated with retiree health benefits.)
Share of School Districts in Fiscal Distress Remains Relatively Low. In 1991, the state adopted a system of fiscal oversight that requires COEs to review the financial condition of their school districts at various points during the year. During this review, COEs assign “positive” ratings to school districts that are projected to meet their financial obligations in the current and subsequent two years, “qualified” ratings to districts that may be unable to meet their obligations at some point during this period, and “negative” ratings to districts at imminent risk of being unable to meet their obligations. In building their projections, most districts assume they will receive modest COLAs over the next two years. During the fall 2017 review, 39 districts (4.2 percent of all districts in the state) received qualified or negative ratings. As Figure 29 shows, this share remains low by historical standards. School district fiscal health, however, could look much different were the state to experience an economic downturn.
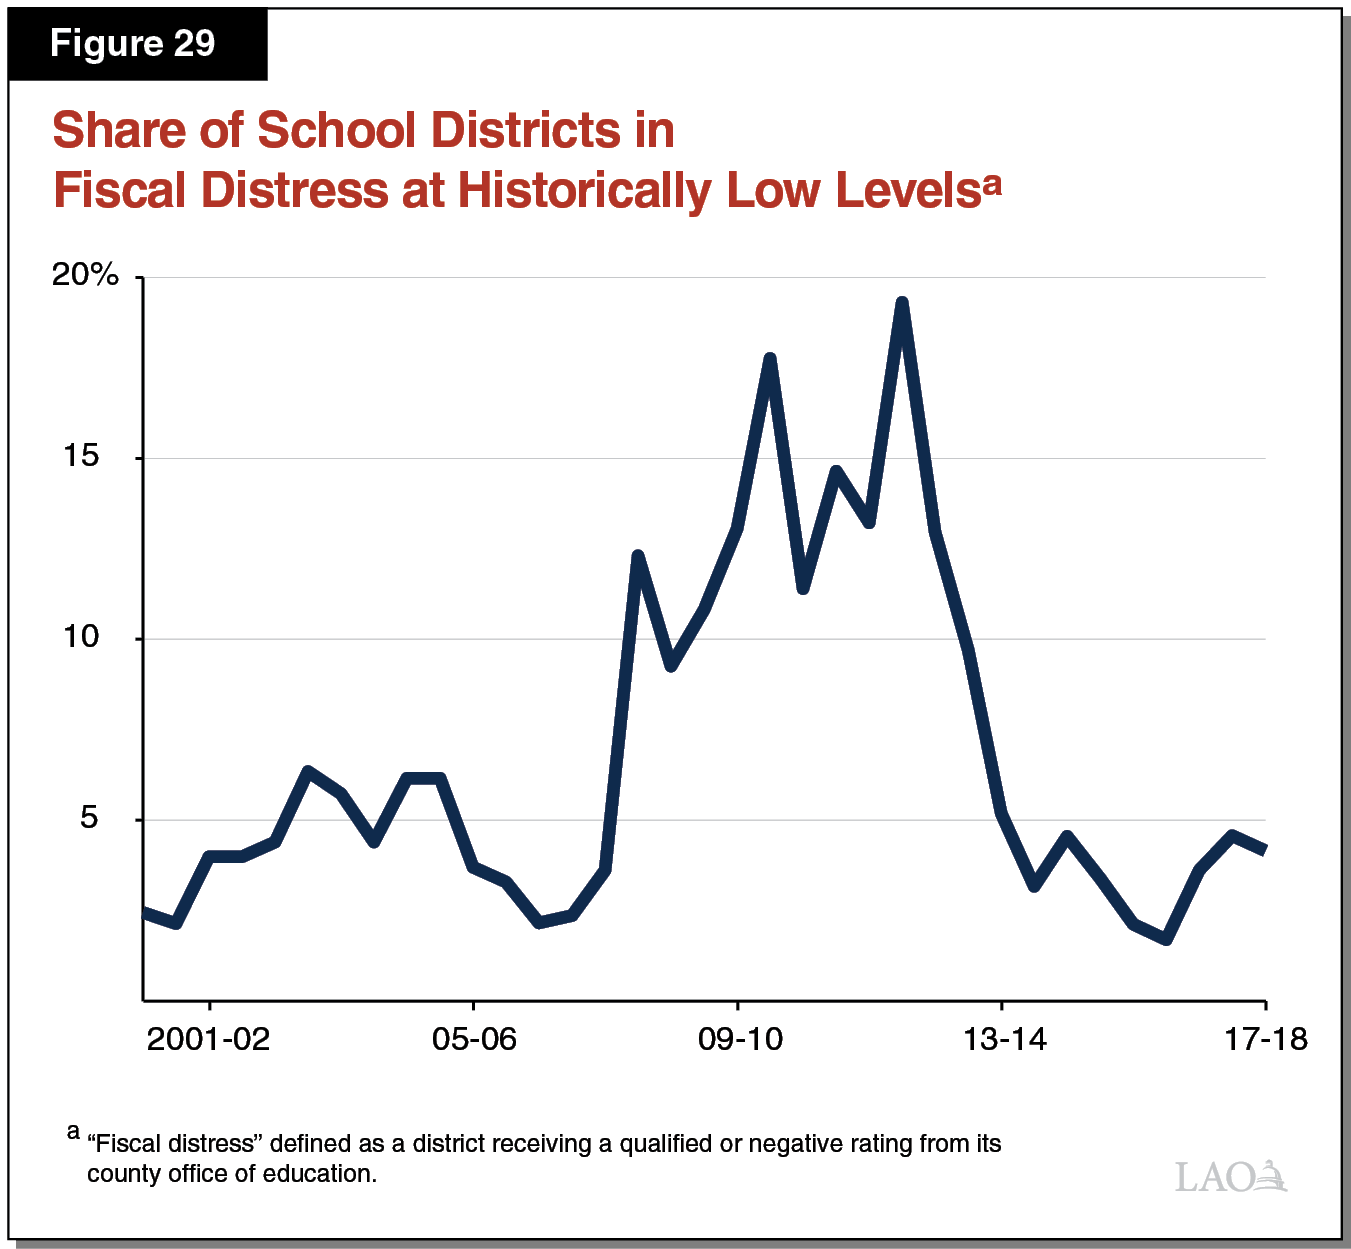
Recommendations
Prioritize General Purpose Funding for Schools and Community Colleges. One way the state can help districts manage pension costs is to allocate Proposition 98 funds through general purpose grants like LCFF and community college apportionments. Allocating funding in this way provides districts the flexibility to make difficult trade‑offs in ways that reflect local priorities. In contrast, creating new ongoing categorical programs can make balancing district budgets more difficult, as funds get tied up for specific state purposes that might not align well with every districts’ local priorities and budget‑balancing strategies.
Modify Language Accompanying School District Discretionary Grants to Include Retirement Costs. The Governor proposes trailer legislation encouraging school districts to use one‑time discretionary grants for various purposes, including employee benefits. Although this language is not legally binding, some school districts indicate that it influences how they use these funds. We recommend the Legislature replace the language concerning employee benefits with an explicit reference to retirement liabilities. School districts could take a variety of actions consistent with this modified language, including setting aside funds in a pension reserve or trust account or prefunding their retiree health benefits. This change would encourage school districts to consider their long‑term cost pressures in addition to their near‑term spending priorities.
Consider Making Additional CalSTRS Payment and Designating for Tighter Fiscal Times. Another way the state could consider helping districts is to make an additional CalSTRS payment on districts’ behalf. By making this payment now, the state could mitigate the need for district rate increases later. Rather than providing immediate relief, the state could keep district rates at the level they would have been absent the additional payment. Later, during the next economic downturn, the Legislature could choose when to allow CalSTRS to factor in the payment and reduce district rates. Such an approach could be particularly beneficial because districts typically face the greatest difficulty balancing their budgets during tight fiscal times. If the state were to pursue this approach, we suggest making a payment of at least several hundred million dollars. We think the state could use Proposition 98 or non‑Proposition 98 General Fund to make the payment. In either case, funding could come from various sources—including additional revenue materializing in May or discretionary proposals in the Governor’s budget that the Legislature chooses not to fund.
Summary of Recommendations
Proposition 98
- Continue to rely upon a mix of one‑time and ongoing spending, as this approach would minimize the likelihood of programmatic cuts to schools were the state to experience an economic downturn after 2018‑19.
- Adopt a more efficient method of paying down the mandate backlog. Our recommended alternative reduces costs by having districts write off all remaining mandate claims as a condition of receiving proposed one‑time discretionary grants.
- Carefully examine 2017‑18 attendance data. If growth does not materialize, expect the 2018‑19 guarantee to drop by a few hundred million dollars.
- Expect the 2017‑18 and 2018‑19 minimum guarantees not to increase by more than a few hundred million dollars even if state revenue increases by billions of dollars in either or both years.
Local Control Funding Formula
- Approve Governor’s proposal to provide $2.9 billion to fully fund the Local Control Funding Formula (LCFF)—reaching target funding rates two years ahead of schedule.
- Going forward, determine core policy objectives before adjusting formula.
- Reject Governor’s proposal to create an addendum to district budgets that specifies how district expenditures align with their Local Control and Accountability Plans (LCAPs). The proposed addendum would largely replicate information already available in LCAPs and would lengthen an already long and complex document.
Statewide System of School Support
- Reject Governor’s $76 million package of support proposals.
- Consider an alternative approach to supporting districts with identified performance issues.
- Require county offices of education (COEs) to work with identified districts to examine the root causes of their performance issues. Given COE’s current level of LCFF funding already is more than sufficient to provide district support, do not augment their funding for these activities.
- Allow districts to access support from experts contracted through the California Collaborative on Educational Excellence (CCEE), thereby giving districts greater choice of their support providers.
- Provide CCEE $30 million annually to award limited‑term grants, oversee contracts, monitor identified districts, and conduct statewide trainings.
- Monitor the number of identified districts and improvement trends over the next few years prior to fully developing Level 3 support.
Career Technical Education
- Use LCFF to fund high school career technical education (CTE).
- If Legislature has concerns that high schools will not provide CTE, modify funding formula (for example, by increasing the high school base rate) or modify the accountability system (for example, by establishing separate college and career readiness indicators).
- Reject Governor’s proposal to create a new CTE program.
- If Legislature chooses to take a categorical approach, modify the existing CTE Incentive Grant program to require more coordination between high schools, community colleges, and industry partners. Specifically:
- Require a minimum portion of high school CTE courses be aligned with regional workforce needs.
- Require school districts and community colleges to share CTE student‑level data to track longer‑term outcomes. Add these outcome data to school districts’ college and career readiness indicator and to colleges’ Strong Workforce performance measures.
- Fold the funding associated with four other high school CTE programs into the CTE Incentive Grant program. One consolidated program would streamline planning, promote better coordination, and reduce administrative burden.
- Establish a clear objective for what the CTE Incentive Grant is to achieve and set specific associated performance targets. Measure progress each year by enacting clear data collection and reporting requirements.
- Make the CTE Incentive Grant program limited term and revisit the program in future years to see if it has met its goals.
- Weigh trade‑offs when determining funding level for CTE Incentive Grant program. Providing more categorical funding for CTE would guarantee that schools offer more CTE but would reduce funding available for LCFF.
Special Education Staffing
- Reject the Governor’s proposals to provide $50 million one time for teacher residency programs and $50 million one time for the Local Solutions Grant Program. Neither proposal addresses the root causes of special education staffing shortages. Recommend the Legislature pursue actions that do address root causes (see below).
- Encourage school districts to establish ongoing pay differentials for special education teachers.
- Repeal an existing statute that sets a uniform salary schedule as the default district policy.
- Consolidate the mild/moderate and moderate/severe special education credentials into one core special education credential.
- Eliminate two special education teaching credentials: (1) the physical and health impairment credential and (2) the language and academic development credential.
- Authorize a degree option that would allow a student to obtain a bachelor’s degree in special education and a teaching credential in special education within four years of study. Provide one‑time start‑up grants for universities to redesign curriculum.
- Provide targeted enrollment funding for the California State University to admit more graduate students into its occupational therapy and speech and language pathology training programs.
“Inclusive Early Education” Expansion
- Reject the Governor’s proposal to provide $125 million one‑time Proposition 98 funding and $42 million federal funding for a one‑time competitive grant initiative to increase the availability of mainstream child care and preschool opportunities for children with disabilities from birth through age 5.
- Consider reallocating existing quality improvement funding to prioritize special education‑related training. Also could consider increasing the total amount of ongoing funding for professional development.
- Explore ways to make the Child Care Facility Revolving Fund (CCFRF) program more attractive to providers—for example, by making a portion of CCFRF available as grants, extending the repayment period, and/or broadening the allowable uses of the funds to ensure providers could make special education‑related renovations.
State Preschool
- Shift $176 million non‑Proposition 98 General Fund for State Preschool wrap into Proposition 98 to provide the state with greater flexibility to distribute full‑day slots.
- If additional full‑day slots are funded in 2018‑19 or in future years, allow all types of providers, not only local education agencies, to apply for them.
Pension Costs
- Prioritize general purpose funding to give districts greater flexibility in accommodating higher pension costs and local priorities.
- Modify trailer bill language guiding the use of one‑time discretionary grants so that it specifically encourages districts to use these funds for addressing retirement liabilities.
- Consider making an additional CalSTRS payment of at least several hundred million dollars and designating this funding for district rate relief during the next economic downturn.