Education Contacts
- K-12 Education in Context
- Federal Funds for K-12 Education
- Overview of the Governor's Budget
- Pensions
- Local Control Funding Formula
- Special Education
- Preschool
- Education Mandates
- School Facilities

February 9, 2017
The 2017-18 Budget
Proposition 98 Education Analysis
- Executive Summary
- Introduction
- K‑12 Education in Context
- Federal Funding for K‑12 Education
- Overview of the Governor’s Proposition 98 Budget Package
- Local Control Funding Formula
- Special Education
- Preschool
- Education Mandates
- Pension Costs
- School Facilities
- Summary of Recommendations
Executive Summary
In this report, we analyze the Governor’s overall Proposition 98 budget package as well as his specific spending proposals for K‑12 education.
Overall Proposition 98 Budget Plan
Governor Adjusts Proposition 98 Spending to Reflect Revised Estimates of the Minimum Guarantee. Compared to June 2016 estimates, the Governor’s budget has the minimum guarantee down $379 million in 2015‑16 and down $506 million in 2016‑17. These drops are due mostly to reductions in General Fund tax revenue. The administration proposes to reduce Proposition 98 spending to match the lower estimates, primarily by deferring some program costs from 2016‑17 to 2017‑18. Regarding 2017‑18, the administration estimates that the minimum guarantee will increase $2.1 billion above the revised 2016‑17 level, reflecting modest year‑over‑year growth in state revenue. The administration proposes to use this increase primarily for eliminating the prior‑year deferral and providing a cost‑of‑living adjustment to the Local Control Funding Formula (LCFF).
Key Messages
Higher Minimum Guarantee Likely in 2017‑18. We believe the administration’s estimate of General Fund revenue in 2017‑18 is low given its other economic assumptions. By May, revenue in 2017‑18 could be significantly higher than assumed in January, with a resulting increase in the minimum guarantee. If revenue were to increase in 2017‑18 by $2 billion above the Governor’s January level, the minimum guarantee would increase by roughly $500 million. If revenue were to increase by $4 billion, the minimum guarantee would increase by about $1.5 billion.
Recommend Increased Funding for LCFF, Exhausting Alternatives Before Approving Deferral. The Governor proposes three significant actions relating to LCFF: (1) deferring an $859 million LCFF payment from June to July 2017; (2) eliminating the deferral for the next payment cycle, thereby returning payments to the regular statutory schedule; and (3) augmenting LCFF funding by $744 million in 2017‑18. Before deferring an LCFF payment, we recommend the Legislature exhaust all other one‑time options, including capturing any current‑year program savings. Were the Legislature to include a deferral in its budget package, we recommend it retire the deferral as soon as possible, as the Governor proposes. We also recommend the Legislature take the Governor’s same approach of dedicating most new ongoing Proposition 98 funding to LCFF, thereby giving districts flexibility to meet local priorities and cost pressures.
Recommend Taking Time to Explore Possible Changes to Special Education Funding. The 2017‑18 Governor’s Budget Summary expresses concern with the state’s current special education funding system and indicates interest in having a statewide conversation about possible changes. In particular, the administration has indicated an interest in rolling special education into LCFF and directing all special education funding to districts rather than Special Education Local Planning Areas (SELPAs). While we agree the current special education system has shortcomings, including unnecessary complexity and unjustified funding inequities, we believe the Legislature has many options to consider in redesigning the system. Moreover, redesigning the system could have significant implications for many stakeholders. For these reasons, we recommend the Legislature take time to explore its redesign options.
Recommend Different Approach to Aligning Preschool Programs. The Governor’s budget includes several proposals that would change State Preschool programs in certain ways and Transitional Kindergarten programs in other ways. Though the intent is to more closely align State Preschool and Transitional Kindergarten programs, we recommend rejecting most of these proposals, as we believe many elements of the proposals would add greater complexity to an already complex system. We recommend the Legislature take a more holistic approach. Under such an approach, the Legislature would consider how best to serve four‑year olds, particularly those from low‑income families, including what eligibility criteria, program standards, and funding levels it desired for these children. Making all these decisions in tandem would provide for better alignment and coherence.
Recommend Creating a Plan for Addressing Mandates Backlog, Adding Two New Mandates to Block Grant. The Governor proposes to make a one‑time payment of $287 million toward the K‑12 mandates backlog. His proposal gives money to all schools on a per‑student basis even though many do not have any outstanding claims. Consequently, we estimate his proposal would lower the backlog by only $102 million. We recommend the Legislature reject this approach and instead develop a multiyear plan that provides backlog funding conditionally on schools writing off remaining claims. Such an approach costs substantially less than the Governor’s approach. Regarding the K‑12 mandates block grant, we recommend the Legislature adopt the Governor’s proposal to add the new school employee training mandate but increase the associated block grant augmentation from $8.5 million to $41.9 million to more accurately reflects costs. Though the Governor does not yet have a proposal for another new mandate related to online standardized testing, we recommend adding the mandate and $37.8 million to the block grant ($25 million to reflect higher costs and $12.8 million to reflect an accounting shift of existing related assessment funds).
Recommend Requiring Administration to Provide More Information on How to Address Backlog of Facility Projects. Passed by voters in November 2016, Proposition 51 authorizes the state to sell $7 billion in general obligation bonds for K‑12 school facilities. The Governor’s budget proposes to issue $594 million of these bonds in 2017‑18, along with $61 million in school bonds from prior voter measures. These bond sales would address only a fraction of the current project backlog of $2.4 billion. Given a large backlog of projects would persist under the Governor’s proposal, we recommend the Legislature use its budget hearings to gather more information from the administration on how to address the backlog as expeditiously as possible. We also recommend the Legislature adopt a related proposal by the Governor to shift auditing of state‑funded school facility projects from the state to the local level, thereby making auditing of facility expenditures more similar to other program expenditures.
Introduction
The Governor’s Proposition 98 budget package includes proposed changes in funding for K‑12 education and the California Community Colleges (CCC). In this report, we analyze the Proposition 98 budget package, with a focus on K‑12 education. In the first section of the report, we provide background on public schools in California. We then provide an overview of the Governor’s Proposition 98 budget package and a high‑level assessment of it. In the remaining sections of the report, we analyze several key areas of the K‑12 education budget. In our forthcoming Higher Education Budget Analysis, we provide background on community colleges and discuss the Governor’s specific community college proposals. On the “EdBudget” portion of our website, we post dozens of tables containing additional detail about the Proposition 98 budget.
K‑12 Education in Context
In this section, we answer many questions legislators and others commonly ask about K‑12 education in California. We begin with a focus on the main components of California’s public school system, then turn to the state’s academic standards and student performance on standards‑aligned assessments, and finish by explaining the basics of school finance in California.
California’s Public School System
Below, we describe California’s students, teachers, local education agencies, and state education agencies.
Students
California Has More Than 6 Million Public K‑12 Students. In 2015‑16, California’s public schools enrolled a total of 6.2 million students, representing 13 percent of all public school students in the nation. About two‑thirds of these students were in grades kindergarten through eight, with one‑third attending high school. Over the past decade, student enrollment has been virtually flat, with enrollment in 2015‑16 about 1 percent below the 2005‑06 level. Enrollment in the preceding decade, however, grew by an average of 1 percent per year. Over this earlier decade (1995‑96 to 2005‑06), statewide enrollment grew by about 850,000 students.
Almost Six in Ten California Students Are From Low‑Income Families. In 2015‑16, 59 percent of California’s public school students were eligible to receive a free or reduced price school meal under a large federal nutrition program. States frequently use this eligibility measure as an indicator of student poverty. Qualifying students come from families earning no more than 185 percent of the federal poverty level. In 2015‑16, this level equated to $45,000 for a family of four. California’s rate of free or reduced price meal eligibility is above the nationwide rate of 52 percent.
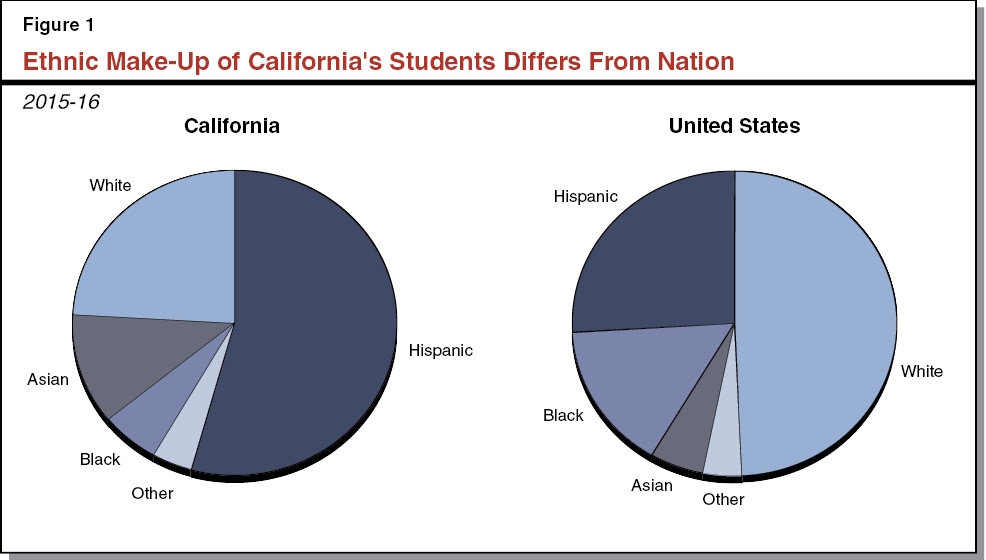
Half of California Students Are Hispanic. As Figure 1 shows, the ethnic make‑up of California’s students differs notably from the nationwide picture. Whereas about half of California’s students are of Hispanic origin and about one‑quarter are white, in the United States those shares are flipped. Differences exist among other ethnic groups too, with Asian students comprising a larger share of students in California than the nation (12 percent and 5 percent, respectively), and black students comprising a smaller share (6 percent in California compared to 16 percent nationwide).
Nearly One‑Quarter of California Students Are English Learners. In 2015‑16, 22 percent (1.4 million) of California students were classified as English learners—a higher proportion than in any other state. Three out of every ten English learners in the nation attends school in California. Even more California students—almost 2.7 million students overall—speak a primary language other than English at home, but almost half of these students are considered fluent in English. California students come from families speaking over 65 different home languages, although the vast majority (78 percent) speak Spanish, with Vietnamese the next most common language (3 percent).
About One in Ten California Students Are Identified as Having a Disability Affecting Their Education. In 2015‑16, about 662,000 California students (11 percent) were identified with a disability affecting their education. Pursuant to federal law, schools must provide these students with special education services. California identifies a slightly smaller proportion of students for special education than the rest of the nation (13 percent). Specific learning disabilities such as dyslexia are the most common diagnoses requiring special education services (affecting 5 percent of the state’s K‑12 students), followed by speech and language impairments (affecting 2 percent of California’s students). While the overall prevalence of students with autism and chronic health problems still is relatively rare (each affecting about 1 percent of California’s students), the number of students diagnosed with these disabilities has increased notably over the last decade.
Teachers
California Has Almost 300,000 Teachers. In 2014‑15 (the most recent year for which certain statewide staffing data are available), about 296,000 teachers were employed in the public school system. Roughly three‑quarters of teachers are women, similar to the share in other states. Compared to the student population, teachers are more likely to be white (68 percent of teachers compared to 25 percent of students) and less likely to be Hispanic (19 percent of teachers compared to 54 percent of students). The number of teachers decreased during the last economic recession, dropping from 310,000 in 2007‑08 to 284,000 in 2011‑12. Since 2011‑12, the number of teachers has increased each year.
California’s Credentialing Requirements Are Similar to Those in Other States. To obtain a first‑time teaching credential in California, individuals must have a bachelor’s degree, complete a teacher preparation program, meet certain basic skills requirements, and demonstrate subject matter competency. Within five years of receiving their initial credentials, teachers must complete approved, two‑year, on‑the‑job training programs to obtain their full professional credentials. Most other states have similar requirements. Fully credentialed teachers from other states who want to work in California typically are granted in‑state credentials conditionally, having to fulfill certain California‑specific requirements (including a basic skills requirement and a requirement relating to teaching English learners) within a set amount of time.
Four in Ten Teachers in California Have Advanced Degrees. In 2014‑15, less than 1 percent of California’s teachers held less than a bachelor’s degree, 57 percent possessed a bachelor’s degree, and 42 percent had a master’s degree or other advanced graduate degree. The share of teachers with a master’s or other advanced graduate degree has increased by almost 10 percentage points over the past ten years.
Average Years of Teaching Experience Have Steadily Increased Over Last Decade. In 2014‑15, California’s teachers had an average of 14 years of experience. This is higher than ten years ago, when teachers had an average of 13 years of experience. The share of teachers in California with 15 or fewer years of experience has steadily declined (from 65 percent in 2005‑06 to 55 percent in 2014‑15), whereas the share with more than 15 years of experience has steadily increased (from 35 percent in 2005‑06 to 45 percent in 2014‑15). In 2014‑15, the least experienced teachers (having taught less than five years) and the most experienced teachers (having taught more than 25 years) each accounted for about 15 percent of California’s teachers.
California’s Teacher Salaries Higher Than Most Other States. Based upon the most recent national data (2014‑15), California has the fourth highest average teacher salary among the 50 states and the District of Columbia. Its average teacher salary in 2014‑15 was 26 percent higher than the national average. California has ranked among the top four states each year since 2000‑01. During this period, Connecticut, New York, New Jersey, and Massachusetts commonly ranked among the top states along with California.
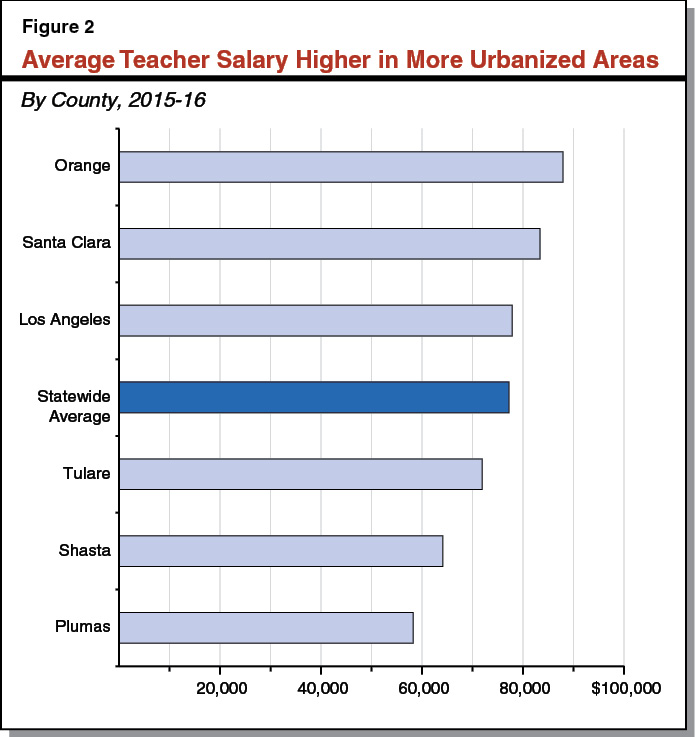
Teacher Salaries Vary Significantly Across the State. In California, the state requires most local education agencies to set teacher salary levels through collective bargaining. In 2015‑16, the average teacher salary in California was $77,200. As Figure 2 shows, teacher salary levels varied widely across the state, with average salaries generally higher in more urbanized areas than rural areas.
California Has Highest Student‑to‑Teacher Ratio in Nation. Though California’s teachers tend to be better paid than the rest of the nation, the state employs comparatively fewer of them. Based upon the most recent national data (2013‑14), California had the highest student‑to‑teacher ratio—50 percent higher than the national average. The state’s student‑to‑teacher ratio consistently has been among the highest in the nation, even prior to the recent economic recession. In 2014‑15, California’s student‑to‑teacher ratio was 21.1, a decrease of 0.5 compared to 2013‑14.
Local Education Agencies
School Districts, Charter Schools, and County Offices of Education Provide Instruction to Students. The public school system is comprised of many local education agencies (LEAs). In 2015‑16, 946 school districts, 1,222 charter schools, and 58 county offices of education operated in California. California’s public school system also includes three state special schools for certain blind and deaf students, four schools for students incarcerated at state juvenile justice facilities, and 78 county juvenile court schools.
Size of California School Districts Varies Dramatically. As shown in Figure 3, California’s 946 school districts vary greatly in size. One‑quarter of school districts are very small, serving 300 or fewer students. Another one‑third are small, serving between 301 and 2,500 students. Whereas these two sets of districts combined comprise more than half of all districts in California, they account for only 7 percent of all students. At the other extreme, 12 very large districts each serve more than 40,000 students and together educate one‑fifth of all students in the state. The largest district in California (and the second largest in the nation) is the Los Angeles Unified School District, serving 9 percent of all California students. Seven of the state’s counties contain only a single school district, and 253 school districts contain only a single school. At the other extreme, Los Angeles County contains 80 school districts, and four school districts each have more than 100 schools.
Figure 3
California School Districts Vary Greatly in Size
2015‑16
|
District Sizea |
Number of Districts |
Percent of All Districts |
Total Students |
Percent of All Students |
|
Less than 300 |
240 |
25% |
29,569 |
1% |
|
301 to 2,500 |
306 |
32 |
335,013 |
6 |
|
2,501 to 5,000 |
138 |
15 |
503,233 |
9 |
|
5,001 to 10,000 |
113 |
12 |
848,318 |
16 |
|
10,001 to 40,000 |
137 |
14 |
2,620,318 |
48 |
|
40,001+ |
12 |
1 |
1,114,654 |
20 |
|
Totals |
946 |
100% |
5,451,105 |
100% |
|
aBased on average daily attendance. Excludes charter school attendance. |
||||
Charter Schools Are Fast‑Growing Sector of California’s K‑12 School System. An increasing share of California students attend charter schools. Charter schools are publicly funded schools that are similar to traditional schools in many ways—they must employ state‑certified teachers, and they must teach and assess students based on the same state academic standards. They differ from traditional district‑operated schools, however, in that they are exempt from certain state laws, allowing them more flexibility over the design of their education programs. While overall K‑12 enrollment has been relatively flat over the past decade, the number of students attending charter schools has more than tripled, growing at an average annual rate of 13 percent. In 2015‑16, charter schools served 573,000 students (9 percent of the statewide total), up from 200,000 students (3 percent of the statewide total) in 2005‑06. In 2015‑16, charter schools ranged in size from 3 students to more than 5,000 students, with an average school size of 447.
County Offices of Education (COEs) Operate Regional Programs and Services. Specifically, they operate alternative programs for students who are incarcerated, on probation, referred by probation departments, or have been mandatorily expelled. Many COEs also operate regional special education and career technical education programs. In addition to providing some specialized forms of direct student instruction, COEs offer a variety of services to school districts. Many COEs, for example, operate countywide payroll systems and provide professional development for teachers and administrators. The COEs also are required to review and approve school districts’ annual budgets, monitor the fiscal health of districts several times per year, and review districts’ strategic academic plans, known as Local Control and Accountability Plans (LCAPs). The COEs also will have a support role in helping school districts that do not meet performance standards in two or more of eight state priority areas.
State Education Agencies
California Department of Education (CDE) Administers Education Programs at the State Level. The department is the primary state entity responsible for administering federal and state education programs. The department monitors compliance with laws and regulations for education programs; collects and compiles data related to districts, schools, and students; allocates funding; and monitors state contracts for student testing. The department has an annual budget of around $260 million and about 1,500 employees—rendering it midsized compared to other departments within California state government. More than two‑thirds of CDE’s funding comes from federal funds, as many of CDE’s activities are associated with federal programs. The Superintendent of Public Instruction (SPI) oversees the day‑to‑day operations of CDE. In California, the SPI is a non‑partisan position elected by voters. This contrasts with most other states in which the officers heading their departments of education typically are appointed by their governors or state boards of education.
Three Other State Agencies Involved in Aspects of K‑12 Education. In addition to CDE, the following three state entities are involved in major aspects of K‑12 education.
- The State Board of Education (SBE), consisting of ten members appointed by the Governor, is responsible for setting and implementing various state policies, including developing regulations needed to implement state laws involving K‑12 education, granting LEAs waivers from certain requirements in state law, selecting a contractor for the state’s standardized tests, and adopting instructional materials for kindergarten through grade eight.
- The Commission on Teacher Credentialing is responsible for accrediting teacher preparation institutions, credentialing teachers, and investigating allegations of teacher misconduct.
- The State Allocation Board allocates bond funding for the construction and modernization of public school facilities. Prior to receiving state bond funding, school facility projects must be reviewed and approved by the Office of Public School Construction, an office within the Department of General Services.
A Few Entities Tasked With State‑Level Functions. In addition to these state entities, the state contracts with a few entities (via their COEs) to undertake activities that have statewide benefits. The Fiscal Crisis and Management Assistance Team (affiliated with the Kern COE) provides fiscal advice, management assistance, and other training to school districts across the state. California School Information Services (also affiliated with the Kern COE) helps LEAs across the state with data management issues. The K‑12 High Speed Network (affiliated with the Imperial COE) assists schools with Internet connectivity. The California Collaborative for Educational Excellence (affiliated with the Riverside COE), established by the state in 2013 and in the midst of development, is to serve as a hub of expertise for helping LEAs improve student outcomes.
Policy and Performance
Below, we highlight major state and federal laws affecting K‑12 education and then review trends in student performance.
Law and Regulations
State and Federal Law Place Certain Requirements on Schools. Much of school operations are dictated by state and federal law. For example, state law sets the maximum number of students per elementary and middle school classrooms, requires a minimum of 180 instructional days per year, and sets minimum course requirements for high school graduation. State law also requires LEAs to implement state‑adopted academic standards, administer state‑approved student assessments, and report certain student performance outcomes. In addition to state law, the federal government places several major requirements on schools. Most notably, as a condition of receiving certain federal grants, the federal government requires schools to provide special education services, provide supplemental services for low‑income students, and annually test students in certain subjects and grade levels.
The SBE Is Responsible for Developing State Regulations. In many instances, state law delegates important decisions to the board. In recent years, some of the board’s most significant decisions have been related to the Local Control Funding Formula (LCFF) and LCAPs. In 2014, for example, the board adopted regulations that specified how LEAs could use certain LCFF funding intended for English learners and low‑income students. That same year, the board also adopted a template for districts to use in developing their LCAPs. In September 2016, the board adopted the evaluation rubrics that COEs are to use to monitor whether school districts have met performance standards in eight state priority areas. The board also is the primary entity responsible for ensuring the state complies with recently adopted changes in federal law regarding school accountability.
Academic Standards
The SBE Adopted California’s First Set of Academic Content Standards in the Late 1990s. These academic content standards specified what students should know after completing each subject area in each grade level. California first adopted academic content standards for its core content areas—English language arts, math, science, and history‑social science—in 1997 and 1998. The state subsequently adopted standards for English language development (used for instructing English learners), visual and performing arts, physical education, career technical education, and world languages. The Instructional Quality Commission, an advisory body to SBE, created associated curriculum frameworks that provided examples of lesson plans aligned with the content standards.
Like Most States, California’s Instruction Is Now Based on Common Core State Standards. In 2010, at the direction of the state Legislature, SBE adopted the Common Core State Standards (with the addition of a few California‑specific standards) as the new foundation for what students should know and be able to do in English language arts and math from kindergarten through twelfth grade. The new standards are designed to better prepare students for college and career. California schools are implementing the new standards by modifying curriculum, training staff, and purchasing new instructional materials. Forty two states and the District of Columbia have adopted and are implementing the Common Core State Standards.
State Is in Process of Implementing New Science Standards. California also adopted the nationally developed Next Generation Science Standards (NGSS) in 2013. (California was a lead state partner in the development of these new standards.) Because the state has yet to develop new curriculum frameworks or exams aligned with NGSS, instruction in the classroom is not yet aligned to the new science standards.
Student Assessments
Federal Law Requires States to Administer Standardized Tests. Federal law requires states to assess students in English language arts and math in grades 3 through 8 and at least once from grades 10 through 12. In addition, federal law requires states to assess students in science at least once during: (1) grades 3 through 5, (2) grades 6 through 9, and (3) grades 10 through 12. States also are required to annually assess the English proficiency of English learners. From 2003 through 2013, most students in California were assessed using the California Standards Tests (CSTs) in these subjects, which were aligned to the state’s first set of academic standards. (Students with moderate or severe disabilities were assessed using alternative assessments.)
First Exams Aligned to Common Core State Standards Were Administered in Spring 2015. Although the Common Core State Standards were adopted by SBE in 2010, schools were not expected to have their instruction aligned with the new standards until 2014‑15, at which time the state was to administer a new set of Common Core‑aligned assessments. The new assessments were developed by the Smarter Balanced Assessment Consortium (SBAC), a group of 17 states, with California a lead member. The SBAC assessments are intended to be taken online using a computer or tablet (though schools have a pencil‑and‑paper option for the first three years). Compared to the state’s previous exams, which consisted almost exclusively of multiple choice questions, the SBAC assessments are more elaborate. For example, both English language arts and math exams include performance tasks that require students to review source materials and respond in writing to several questions. In spring 2016, the state began administering the Common Core‑aligned California Alternate Assessment in English language arts and mathematics for students with severe cognitive disabilities.
State Is in Process of Developing Several New Exams. The state currently is developing several additional assessments aligned with new academic standards. In spring 2017, the state will administer a pilot test for new science assessments, known as the California Science Test, with fully operational tests beginning in spring 2019. The state also will pilot test a science exam for students with the most significant cognitive disabilities. Additionally, the state is developing a new English language development exam—used to determine whether students should be classified as English learners—to be used beginning fall 2017. The state also is in the early stages of developing a Spanish language assessment aligned to the Common Core. This optional exam could be used for students receiving instruction in Spanish, English learners who have been enrolled in school for less than 12 months, or other students interested in assessing their proficiency in Spanish.
Student Performance
Student Performance on State Exams Improved From 2003 Through 2013. Student performance on the CSTs improved significantly during the ten years when the CSTs were administered. The percentage of students scoring advanced or proficient on the eighth grade English language arts exam almost doubled—from 30 percent to 57 percent—from 2003 to 2013. Performance improved at similar rates for both low‑income and non‑low‑income students. Student performance also improved at similar rates in English language arts at other grade levels and on math exams. As part of the transition to new exams, California suspended the CSTs in spring 2014.
Performance Improved Between First and Second Year of New Assessments. In 2016, 49 percent of California students met or exceeded standards in English language arts, up from 44 percent in 2015. Performance on math also improved, with the percentage of students meeting or exceeding standards increasing from 33 percent to 37 percent. For both subject areas, performance improved in all grades and for all ethnic groups.
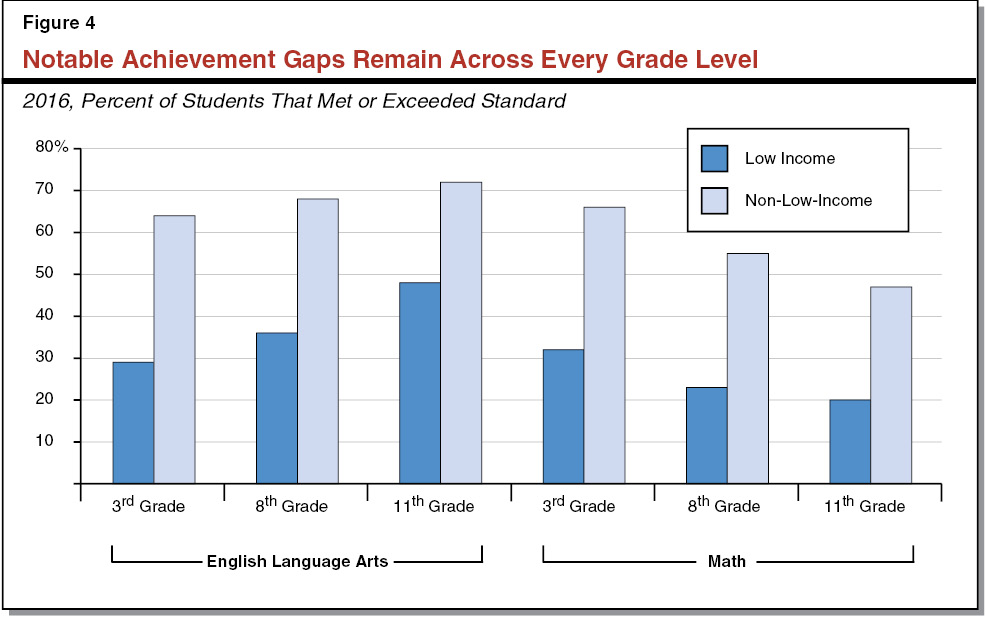
Large Achievement Gaps Still Exist. Although performance has improved for all students, results on the new exams continue to show significant “achievement gaps” between the scores of low‑income and non‑low‑income students. As Figure 4 shows, for example, 36 percent of low‑income students met or exceeded the state standards in eighth grade English language arts, compared to 68 percent of non‑low‑income students. The gaps are similar for other subjects and other grade levels and similar to achievement gaps under the prior exams (a difference of roughly 30 percentage points).
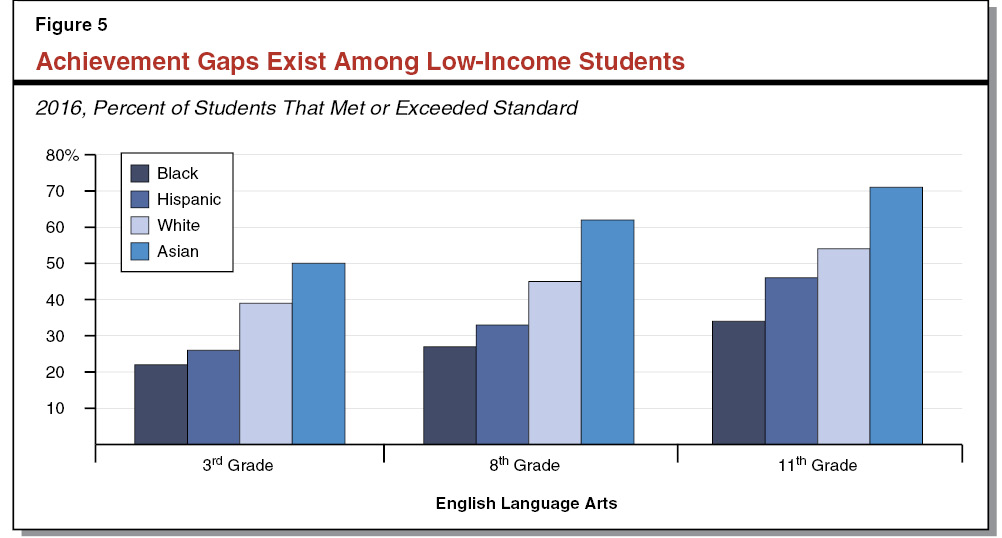
Outcomes Also Vary by Ethnicity. Results on statewide exams also show significant achievement gaps among California’s four largest ethnic groups. Differences across ethnic groups exist even after controlling for income. As Figure 5 shows, low‑income black and Hispanic students have lower proficiency rates on 8th grade English language arts exams (27 percent and 33 percent, respectively) than low‑income white and Asian students (45 percent and 62 percent, respectively). Similar differences among groups exist in third and eleventh grade.
California Ranks Near Bottom on National Tests. The federal government administers the National Assessment of Educational Progress every two years. The most recent assessment results (2015) show that California performs near the bottom in reading and math for fourth and eighth grades. When compared to demographically similar students in other states, the performance of non‑low‑income students in California (39th in eighth grade reading) ranks somewhat higher than low‑income students (45th in eighth grade reading). Both groups in California, however, rank lower than most other states. California’s performance compared to other states has not changed significantly in the past ten years. In addition to having lower performance compared to other states, California also has among the largest achievement gaps between low‑income and non‑low‑income students. In fourth grade reading, for example, California’s achievement gap ranked 49th in the country. (That is, 48 states have achievement gaps that are smaller than California.)
Eight in Ten Students Graduate High School Within Four Years. Of the cohort of students that entered ninth grade in the 2011‑12 school year, 82 percent graduated within four years, 11 percent dropped out of school, 6 percent returned to school for a fifth year, and less than 1 percent received either a High School Equivalency Certificate (if they passed the General Educational Development Test) or a special education certificate of completion.
More Graduates Completing Coursework Required for University Eligibility. In 2015, 43 percent of California students graduated high school having completed the coursework required to be eligible for admission to the University of California and California State University. This proportion has been gradually increasing over the last 20 years. In 1995, 35 percent of California high school graduates completed such coursework. (To meet the minimum eligibility requirements for the University of California and California State University, students also must meet certain grade point average requirements and take college entrance exams.)
Finance
Below, we explain how schools are funded in California, how funds are allocated among districts, and how districts typically use their funding.
School Funding
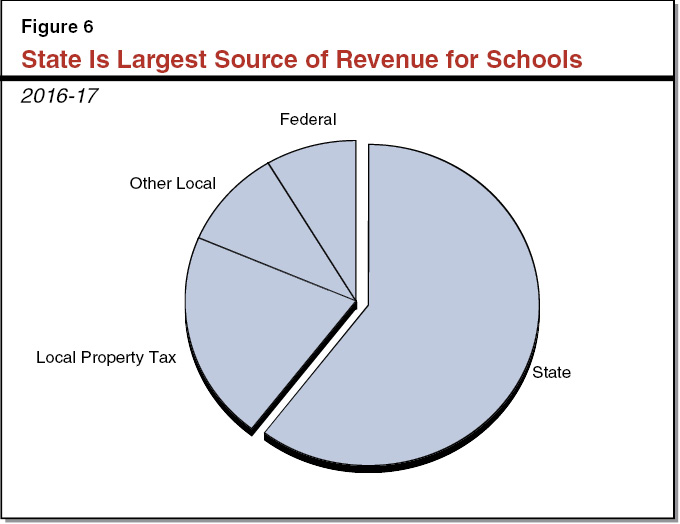
State Is Primary Source of Operating Revenue for Schools. In 2016‑17, schools received $88 billion in total funding from all sources. As Figure 6 shows, the largest share of school funding comes from the state, with smaller shares coming from local sources (primarily from local property tax revenue) and the federal government. (Revenues from the state lottery account for 1 percent of all revenue.) These proportions differ from many other states, where local property tax revenue covers a much larger share of school funding. (Unlike many other states, California’s State Constitution limits local property tax rates.) Additionally, in contrast to many other states, most school districts’ overall funding levels are not affected by how much local property tax revenue they receive. This is because California generally uses local property tax revenue as an offset for state General Fund spending. That is, if a district receives more local property tax revenue in a given year, the state reduces the district’s General Fund support by a like amount. About one in ten school districts in California, however, are affected by growth in their local property tax revenue, as they have such high levels of local revenue that the state provides no direct base aid.
Per‑Pupil Funding Exceeds Pre‑Recession Level. The 2016‑17 Budget Act provided schools with $10,657 per student (from state General Fund and local property tax revenue combined), a $440 (4 percent) increase from 2015‑16 and about $600 (6 percent) more than the 2007‑08 pre‑recession level adjusted for inflation. Statewide per‑pupil funding has exceeded pre‑recession levels since 2014‑15.
California Per‑Pupil Spending Ranks in Bottom One‑Third of States. Based on spending data from 2013‑14 (the most recent available), California ranked 35th in per‑pupil spending among the 50 states and the District of Columbia. In 2007‑08, prior to the most recent recession, California ranked 23rd in per‑pupil spending. The drop in ranking over this period is primarily due to the reductions the state made during the recession. Because California’s revenues are highly sensitive to changes in the economy and financial markets, California’s budget tends to be more significantly affected by recessions (and recoveries) than most other states. Given California has made significant increases in K‑12 funding over the past several years, its ranking likely will increase as newer data become available.
If Adjusted for Cost of Employment, California Drops in the Rankings. Some organizations produce rankings of state per‑pupil spending with adjustments for regional costs. In these rankings, California typically ranks much lower. In one recent ranking, for example, California ranked 46th in per‑pupil spending. The adjustments in these rankings are primarily intended to control for the variation in wages across the country, with average wages higher in California.
Allocation and Use of Funds
Most Funding Is Allocated Through the LCFF. The 2016‑17 budget plan allocated 91 percent of K‑12 education funding (state General Fund and local property tax revenue combined) through LCFF. School districts and charter schools may use LCFF funds for any educational purpose, though they must use a portion of these funds for increasing or improving services for English learners and low‑income students. In addition to general purpose LCFF funds, the state provides funding for various categorical programs, the largest being special education. (Categorical programs restrict funding for specified purposes.)
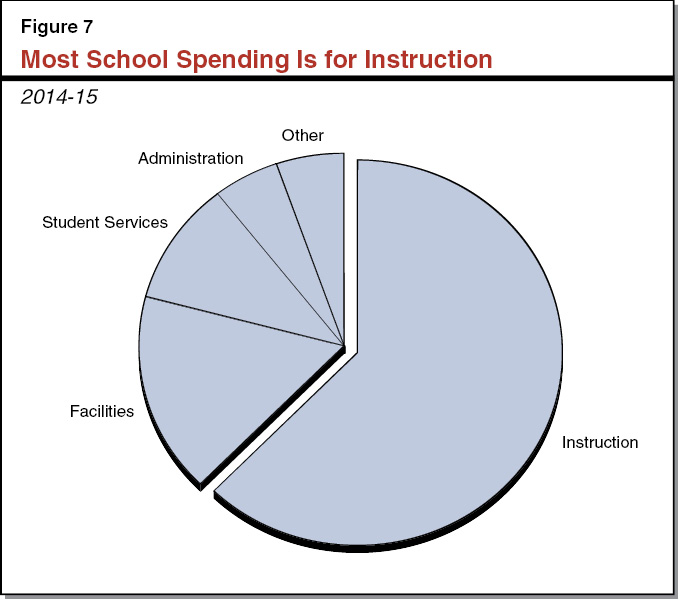
Most School Spending Is for Instruction. As Figure 7 shows, 62 percent of school expenditures in 2014‑15 was related to instruction and instructional support—largely paying teacher salaries and benefits. Schools spent 17 percent of their funds on facilities, including land acquisition, construction, and maintenance. Schools spent 10 percent on student services, including school meals, pupil transportation, counseling, and health services. About 10 percent of funds were spent on central administration, including the compensation of district superintendents; central business, legal, and human resource functions; and other expenses, including purchasing, printing, and data processing.
Federal Funding for K‑12 Education
In this section, we briefly review the role of the federal government in K‑12 education, provide an overview of federal funding for K‑12 education in California, and discuss several major federal K‑12 education programs.
Role of Federal Government
Federal Government’s First Major Educational Focus Was to Support Students Who Were From Poor Families. The federal government’s role in funding K‑12 education was limited through the 1950s. It increased significantly in the 1960s. During that decade, President Johnson expanded the federal government’s role in K‑12 education as part of his larger War on Poverty initiative. Enacted in 1965, the Elementary and Secondary Education Act (ESEA) provided an infusion of federal funds into school districts with high proportions of low‑income students. The funding had few restrictions, except that it be used to enhance low‑income students’ educational opportunities. Funding could be used for things like increasing teacher pay, purchasing new instructional materials, and offering more advanced academic courses.
Federal Government Gradually Has Assumed Greater Role in School Accountability. As early as the 1970s, the federal government began using assessments to evaluate ESEA programs, particularly “Title I” programs supporting low‑income students. It was not until the 1994 reauthorization of ESEA, however, that states were required to set English and math benchmarks and test students on their proficiency relative to those benchmarks. The 1994 reauthorization also required that schools not meeting benchmarks develop a school improvement plan as a condition of receiving Title I funds. The 2001 reauthorization of the ESEA, better known as the No Child Left Behind Act, expanded testing to more grades and required disaggregation of test scores for certain student groups. If schools did not meet benchmarks for all student groups, they were required to undergo various reforms. The most recent reauthorization of the ESEA, called the Every Student Succeeds Act (ESSA), occurred in 2015. Under ESSA, the federal government continues to require states annually to test students for accountability purposes, but it allows states to set their own proficiency benchmarks and removes many of the repercussions schools not meeting benchmarks had faced under the No Child Left Behind Act.
Today Three Major Acts Govern the Federal Government’s Role in K‑12 Education. These three acts are:
- The Healthy, Hunger‑Free Kids Act. This act supports several child nutrition programs administered by the United States Department of Agriculture. Generally, these programs reimburse schools for providing meals to low‑income students at reduced prices or for free.
- The Every Student Succeeds Act (ESSA). This act supports several elementary and secondary education programs administered by the United States Department of Education. The programs range from supplemental services for students from low‑income families to additional funding for schools on federal lands. Since the original enactment of ESEA, the law has been reauthorized seven times.
- The Individuals With Disabilities Education Act (IDEA). This act supports services for students with disabilities. As with ESSA, IDEA is administered by the United States Department of Education. The core component of IDEA is services tailored at the local level to the unique needs of each child with a disability ages 3 through 22.
Overview of Federal Funding
Federal Funding Makes Up About 10 Percent of Total K‑12 Funding. The Governor’s 2017‑18 Budget recognizes over a dozen federal K‑12 education programs associated with a total of $7.5 billion in federal funding. This represents about 10 percent of total K‑12 funding in California, with the remaining funding coming from state (60 percent) and local (30 percent) sources. Over the past 15 years, the federal share of K‑12 funding has ranged from 8 percent to 15 percent (an unusual high resulting from stimulus funding the federal government provided during the past recession).
Some School Districts Rely More on Federal Funding Than Others. Two‑thirds of California’s school districts (collectively serving two‑thirds of California’s students) receive less than 10 percent of their total revenues from federal programs, while the remaining one‑third receive 10 percent or more of their total revenues from federal programs. Districts serving relatively large numbers of low‑income students and English learners tend to rely more heavily on federal funding.
Major Federal Education Programs
Child Nutrition Programs. The largest nutrition programs funded under the Healthy, Hunger‑Free Kids Act are the National School Lunch Program and the School Breakfast Program. These two programs comprise 78 percent of the $2.6 billion proposed for California schools in 2017‑18 under the act. The act supports several other school‑based nutrition programs, including programs to provide meals to students in the summer and after school. For some nutrition programs, the state supplements federal funding. The 2017‑18 budget proposes to include $161 million in Proposition 98 General Fund support primarily to provide additional reimbursements to schools participating in the federal lunch and breakfast programs.
Programs for Students From Low‑Income Families. As Figure 8 shows, the largest ESSA program is support for low‑income students (Title I), comprising 75 percent of the $2.6 billion proposed for schools in 2017‑18. Title I itself has many components, including formula‑based grants for schools educating high proportions of children from low‑income families, formula‑based grants for states to provide supplemental educational services for the children of migrant workers, and funding for states to administer standardized assessments.
Figure 8
Funding for Every Student Succeeds Act
Proposed 2017‑18a (In Millions)
|
Support for: |
|
|
Low‑income students (Title I) |
$1,958 |
|
Teachers and administrators (Title II) |
238 |
|
English learners (Title III) |
145 |
|
After‑school programs and charter schools (Title IV) |
164 |
|
Rural schools (Title V) |
1 |
|
American Indian education (Title VI) |
7b |
|
Schools on federal lands (Title VII) |
85b |
|
Total |
$2,598 |
|
aDoes not include various competitive grant awards. In 2016, we estimate California educational entities received a total of $60 million in competitive grant funding. bLAO estimates. |
|
Other ESSA Programs. As Figure 8 shows, ESSA supports several other aspects of K‑12 education. The largest of these other areas is professional development for teachers and administrators, comprising almost 10 percent of all ESSA funding. The next largest ESSA programs are for English learners and after school programs (most notably, 21st Century Community Learning Centers). ESSA also funds various other initiatives, including support for rural schools, American Indian education, and schools on federal lands. (Funding for the latter two programs is awarded directly to schools and does not pass through the California Department of Education.) California provides state funding for similar purposes as ESSA. Most notably, the state provides significant funding targeted for low‑income students and English learners under its main per‑pupil funding formula. (In 2016‑17, we estimate the state provided $8.6 billion for this purpose.) In addition, the state provides earmarked funding for after‑school programs, assessments, and schools in rural areas.
Programs for Students With Disabilities. Nearly all IDEA funding is for direct services for children with disabilities ages 3 through 22. For each child identified with a disability, school administrators and teachers must meet annually with the child’s parents to identify the specific services the child requires to succeed. These services receive 96 percent of the $1.3 billion IDEA funding proposed for schools in 2017‑18, with the state contributing an additional $3.8 billion. The remaining 4 percent of federal funding supports services for children birth through age three.
Two Other Notable Federal Education Programs Administered by State. The Carl D. Perkins Career and Technical Education (CTE) Act provides about $50 million annually to schools to increase the quality of CTE. Schools use the funding to develop CTE curriculum, offer professional development for CTE teachers, and purchase equipment and supplies for the classroom. In addition, the McKinney‑Vento Homeless Assistance Act provides about $7 million annually to schools for providing homeless children extra services such as transportation and help accessing social services.
Other Federal Grants Allocated Directly to Educational Service Providers or Schools. The federal government allocates some federal funding directly to educational service providers. One of the largest fund sources of this nature is the Federal Communications Commission’s (FCC’s) Schools and Libraries program, commonly known as E‑Rate. This program provides funding to telecommunication companies to provide discounted Internet and related services to schools. In 2015‑16, the FCC committed to offsetting California schools’ Internet costs by over $400 million in E‑Rate funds. In some cases, the federal government also allocates federal funding directly to schools. For example, we estimate schools receive about $15 million annually in federal Forest Reserve funds to offset some of the timber revenue rural schools have lost due to various federal actions that have reduced timber harvests on federal lands.
Federal Funding for California Department of Education State Operations. The 2017‑18 budget proposes to provide $161 million in federal funding to the California Department of Education to administer various federal programs. In a review we conducted in 2014, we found that federal funding supported almost 70 percent of the department’s operations budget. State funding supported about 20 percent of the department’s operations budget, with remaining support coming from various other fund sources.
Back to the TopOverview of the Governor’s Proposition 98 Budget Package
Below, we provide background on how the state calculates its school funding obligation under Proposition 98, describe the Governor’s proposed Proposition 98 funding and spending changes from 2015‑16 through 2017‑18, and offer a high‑level assessment of the package.
Background on Calculating Minimum Guarantee
Proposition 98 Sets Minimum Funding Level for Schools and Community Colleges. State budgeting for schools and community colleges is governed largely by Proposition 98, passed by voters in 1988. The measure, modified by Proposition 111 in 1990, establishes a minimum funding requirement for schools and community colleges, commonly referred to as the minimum guarantee. Both state General Fund and local property tax revenue apply toward meeting the minimum guarantee.
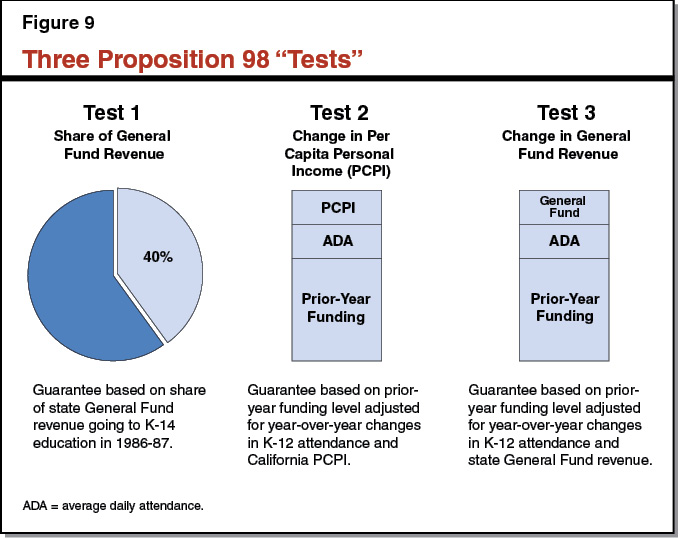
Various Inputs Determine Operative “Test.” As described in Figure 9, the minimum guarantee is determined by one of three tests set forth in the State Constitution. These tests depend upon several inputs, including changes in K‑12 attendance, per capita personal income, and per capita General Fund revenue. The operative test that sets the minimum guarantee is triggered automatically depending on these inputs. In most years, Test 2 or Test 3 has been the operative test, with the minimum guarantee building upon the level of funding provided the prior year. Since the inputs are not finalized until a few years after the close of the fiscal year, the operative test can fluctuate and the minimum guarantee can change significantly from the level initially assumed in the budget.
Additional Statutory Formula Applies in Test 3 Years. In 1990, the state established an additional formula to ensure that school funding is treated no worse than the rest of the budget during tight economic times. Calculated when Test 3 is operative, the formula requires the state to provide a supplemental appropriation when Proposition 98 funding otherwise would grow less quickly than the rest of the budget. The state provides this supplemental appropriation on top of the minimum guarantee otherwise calculated for that year. Given its intent, the formula is commonly known as the “equal pain/equal gain” formula.
State Can Provide More Funding Than Required or Suspend Guarantee. During the economic boom that prevailed in the late 1990s, the state for several years provided more funding than was required by the minimum guarantee. Because the minimum guarantee generally builds upon the level provided in the previous year, such augmentations resulted in long‑term increases in school funding. Alternatively, in 2004‑05 and 2010‑11, the state applied a provision of Proposition 98 allowing for the suspension of the minimum guarantee upon a two‑thirds vote of each house of the Legislature. When the state suspends the minimum guarantee, it can provide a lower level of funding but it creates an out‑year obligation to restore K‑14 funding in later years (as described below).
State Creates “Maintenance Factor” Obligation in Certain Years. Proposition 111 established maintenance factor and set forth certain rules pertaining to it. The state creates a maintenance factor obligation when Test 3 is operative or the minimum guarantee is suspended. This obligation equals the difference between the actual level of funding provided and the Test 1 or Test 2 level (whichever is higher). Moving forward, the maintenance factor obligation is adjusted annually for changes in K‑12 attendance and per capita personal income. In subsequent years, when General Fund revenue is growing more quickly, the Constitution requires the state to make maintenance factor payments until it has paid off this obligation. The magnitude and timing of these payments is determined by formula, with stronger and faster revenue growth generally requiring larger and more rapid payments. These maintenance factor payments increase the minimum guarantee on an ongoing basis.
Major Features of Governor’s Plan
As part of its budget package, the administration has updated its estimates of the minimum guarantee for 2015‑16, 2016‑17, and 2017‑18. Below, we describe these changes as well as the proposed associated changes to Proposition 98 spending. (The administration also has updated its estimates of local property tax revenue across the period. The box describes and assesses these changes.)
Local Property Tax Update
Property Tax Estimates Revised Upwards in 2015‑16 and 2016‑17. As shown in the figure below, the Governor’s budget assumes property tax revenue will total $19.7 billion in 2015‑16 and $21.0 billion in 2016‑17. These estimates reflect an upward revision of $568 million across the two years compared with estimates made last June (bringing them closer to our November 2016 estimates). Higher estimates of revenue distributed to schools from Educational Revenue Augmentation Funds comprise the bulk of this increase. This upward revision is due primarily to an improvement in the administration’s estimation methodology. Another factor contributing to the upward revision to relates to supplemental tax revenue. Data reported by local educational agencies in 2015‑16 show this revenue exceeding initial budget estimates, and the administration assumes this revenue will increase further in 2016‑17. (Supplemental taxes consists of the property tax levied on properties sold midyear. For the purposes of the figure, they are included in “other property tax.”) These increases are partially offset by a higher estimate of excess tax revenue. (Excess tax revenue consists of the local revenue that some schools and community colleges receive beyond their general purpose funding level set by the state. This portion of local revenue is excluded from the Proposition 98 calculations.) We believe the administration’s revisions for 2015‑16 and 2016‑17 are reasonable.
Property Tax Revenues Projected to Increase $1.1 Billion in 2017‑18. The Governor’s budget assumes that property tax revenue will total $22.2 billion in 2017‑18. This is an increase of $1.1 billion (5.3 percent) from the revised 2016‑17 level. This increase is driven largely by an assumed 5.3 percent increase in assessed property values, reflecting the continued strength of the state’s real estate markets. (In the figure, the growth in assessed values primarily affects the “secured property tax revenue.”) The administration also makes various smaller adjustments to other components of local property tax revenue. We think the administration’s assumptions for 2017‑18 are reasonable (with our estimates being only slightly lower).
Proposition 98 Property Tax Revenue Estimates Under Governor’s Budget
(Dollars in Millions)
|
2015‑16 Revised |
2016‑17 Revised |
2017‑18 Estimated |
Change From 2016‑17 |
||
|
Amount |
Percent |
||||
|
Property Tax Components |
|||||
|
Secured property tax |
$16,740 |
$17,731 |
$18,678 |
$947 |
5.3% |
|
Other property tax |
1,667 |
1,818 |
1,966 |
148 |
8.1 |
|
Redevelopment agency dissolution |
1,247 |
1,298 |
1,447 |
149 |
11.4 |
|
Educational Revenue Augmentation Fund |
837 |
1,042 |
1,017 |
‑24 |
‑2.4 |
|
Excess tax |
‑810 |
‑850 |
‑948 |
‑97 |
11.5 |
|
Totals |
$19,681 |
$21,038 |
$22,160 |
$1,121 |
5.3% |
Minimum Guarantee for 2015‑16 Revised Downward. Figure 10 compares the Governor’s estimates of the 2015‑16 and 2016‑17 minimum guarantees with the estimates made in June 2016. The revised estimate of the 2015‑16 guarantee is $68.7 billion, a $379 million decrease compared with the previous estimate. This drop is due to a $1.5 billion decrease in General Fund tax revenue. As a result of this lower revenue, the state is no longer required to make the $379 million maintenance factor payment included in the June budget plan. Under the revised estimates, Test 3 rather than Test 2 is operative. The amount of the statutory “equal pain/equal gain” supplemental appropriation, however, is such that the state creates no new maintenance factor.
Figure 10
Tracking Changes in the Proposition 98 Minimum Guarantee
(In Millions)
|
2015‑16 |
2016‑17 |
||||||
|
June 2016 Estimate |
January 2017 Estimate |
Change |
June 2016 Estimate |
January 2017 Estimate |
Change |
||
|
Minimum Guarantee |
|||||||
|
General Fund |
$49,722 |
$48,989 |
‑$733 |
$51,050 |
$50,330 |
‑$720 |
|
|
Local property tax |
19,328 |
19,681 |
353 |
20,824 |
21,038 |
215 |
|
|
Totals |
$69,050 |
$68,671 |
‑$379 |
$71,874 |
$71,368 |
‑$506 |
|
Minimum Guarantee for 2016‑17 Also Revised Downward. The revised estimate of the 2016‑17 guarantee is $71.4 billion, a $506 million decrease compared with the estimates made last June. This drop is due primarily to the lower funding level in 2015‑16 carrying forward. In addition, non‑Proposition 98 spending is growing somewhat less quickly than assumed last June, such that the supplemental appropriation required by the equal pain/equal gain formula has shrunk. Though the administration has revised its estimate of 2016‑17 General Fund revenue down by $1.6 billion, the almost equally sized revenue drop in 2015‑16 results in the year‑to‑year growth rate remaining at 3.6 percent. Under the revised 2016‑17 estimates, Test 3 remains operative, with the state creating a new maintenance factor obligation of $838 million (slightly more than the $746 million assumed in the June budget package).
2015‑16 Spending Reduced Primarily by Scoring Some One‑Time Payments to 2016‑17. The administration proposes to reduce Proposition 98 spending to match the lower estimates of the 2015‑16 and 2016‑17 minimum guarantees. To reduce spending in 2015‑16, the administration changes how it scores one‑time payments for the K‑12 mandates backlog and the California Collaborative for Educational Excellence (the Collaborative). Whereas the June budget plan had counted payments for these activities toward the 2015‑16 guarantee, the Governor proposes to count $324 million for these programs toward the 2016‑17 guarantee. As schools already were expecting to receive this funding in 2016‑17, this proposal would not affect local programs. Spending is reduced an additional $55 million in 2015‑16 primarily due to various automatic adjustments, such as savings resulting from a slight drop in student attendance.
2016‑17 Spending Reduced Primarily Through School Payment Deferral. By scoring certain one‑time payments in 2016‑17 rather than 2015‑16, the Governor’s budget plan increases 2016‑17 Proposition 98 spending by $324 million. This increase, combined with the $506 million drop in the minimum guarantee and various minor adjustments, results in a spending level that would exceed the 2016‑17 guarantee by $859 million. To avoid spending more than the minimum guarantee, the Governor proposes to defer an $859 million payment for the Local Control Funding Formula (LCFF). Specifically, the administration proposes to provide this funding in July 2017 rather than in June 2017, as originally scheduled. This delay would allow the state to count the payment toward the 2017‑18 guarantee instead of the 2016‑17 guarantee.
2017‑18 Guarantee Increases $2.1 Billion Over Revised 2016‑17 Level. The Governor’s budget includes $73.5 billion in total Proposition 98 funding in 2017‑18. As shown in Figure 11, this reflects a 3 percent increase over the revised 2016‑17 level. Test 3 is operative in 2017‑18, with the higher guarantee driven primarily by the 2.6 percent increase in per capita General Fund revenue. (This 2.6 percent increase includes the 0.5 percent add‑on required by the State Constitution.) In addition, the state makes a $266 million supplemental payment under the equal pain/equal gain formula. The administration also estimates that the state creates a new maintenance factor obligation of $219 million. This additional maintenance factor brings the state’s total outstanding obligation to $1.6 billion by the end of 2017‑18.
Figure 11
Proposition 98 Funding by Segment and Source
(Dollars in Millions)
|
2015‑16 Revised |
2016‑17 Revised |
2017‑18 Proposed |
Change From 2016‑17 |
||
|
Amount |
Percent |
||||
|
Preschoola |
$885 |
$975 |
$995 |
$20 |
2.0% |
|
K‑12 Education |
|||||
|
General Fund |
$42,719 |
$43,829 |
$44,811 |
$982 |
2.2% |
|
Local property tax |
17,052 |
18,236 |
19,200 |
965 |
5.3 |
|
Subtotals |
($59,770) |
($62,064) |
($64,012) |
($1,947) |
(3.1%) |
|
California Community Colleges |
|||||
|
General Fund |
$5,304 |
$5,443 |
$5,465 |
$22 |
0.4% |
|
Local property tax |
2,630 |
2,803 |
2,959 |
156 |
5.6 |
|
Subtotals |
($7,933) |
($8,246) |
($8,424) |
($179) |
(2.2%) |
|
Other Agenciesa |
$82 |
$83 |
$80 |
‑$3 |
‑3.3% |
|
Totals |
$68,671 |
$71,368 |
$73,511 |
$2,143 |
3.0% |
|
General Fund |
$48,989 |
$50,330 |
$51,351 |
$1,021 |
2.0% |
|
Local property tax |
19,681 |
21,038 |
22,160 |
1,121 |
5.3 |
|
aConsists entirely of General Fund. |
|||||
New K‑12 Funding in 2017‑18 Dedicated to LCFF. Figure 12 shows the Governor’s Proposition 98 spending proposals for 2017‑18. The largest ongoing proposal is a $744 million augmentation to the LCFF. The proposed augmentation is approximately equal to the cost of applying the statutory 1.48 percent cost‑of‑living adjustment (COLA). The Governor’s budget also adjusts LCFF for changes in student attendance, though average daily attendance (ADA) is expected to remain virtually flat (at 5.9 million ADA). Though the bulk of new ongoing K‑12 funding is for LCFF, the Governor’s budget also applies the statutory 1.48 COLA to a few other K‑12 programs, including special education and child nutrition. Beyond these ongoing augmentations, the Governor proposes to use virtually all of the remaining increase in 2017‑18 K‑12 funding to eliminate the payment deferral created in 2016‑17.
Figure 12
2017‑18 Proposition 98 Changes
(In Millions)
|
2016‑17 Revised Proposition 98 Spending |
$71,368 |
|
Technical Adjustments |
|
|
Make Local Control Funding Formula (LCFF) adjustments |
$65 |
|
Revise estimate of energy efficiency funds |
27 |
|
Annualize funding for previously approved preschool slot increases |
24 |
|
Make various other adjustmentsa |
‑30 |
|
Subtotal |
($85) |
|
K‑12 Education |
|
|
Retire June‑to‑July LCFF deferral (one time)b |
$859 |
|
Increase LCFF funding |
744 |
|
Provide 1.48 percent COLA for select categorical programsc |
58 |
|
Add mandated reporter training to Mandates Block Grant |
8 |
|
Subtotal |
($1,670) |
|
California Community Colleges |
|
|
Fund guided pathways initiative (one time) |
$150 |
|
Provide 1.48 percent COLA for apportionments |
94 |
|
Fund 1.34 percent enrollment growth |
79 |
|
Provide unallocated increase |
24 |
|
Fund Innovation Awards (one time) |
20 |
|
Augment Online Education Initiative |
10 |
|
Develop integrated library system (one time) |
6 |
|
Provide 1.48 percent COLA for select categorical programsd |
4 |
|
Subtotal |
($387) |
|
Total Changes |
$2,143 |
|
2017‑18 Proposition 98 Spending |
$73,511 |
|
aIncludes the removal of prior‑year one‑time payments, a special education fund swap (using one‑time instead of ongoing funds), a High Speed Network fund swap (using ongoing rather than one‑time funds), and various minor adjustments. bUnder the Governor’s proposal, the state would make 11 LCFF payments in 2016‑17 (producing savings relative to the 2016‑17 Budget Act) and 13 LCFF payments in 2017‑18 (12 normal monthly payments plus an additional payment for the prior year). cApplied to special education, child nutrition, services for foster youth, adults in correctional facilities, and American Indian education. dApplied to Extended Opportunity Programs and Services, Disabled Students Programs and Services, CalWORKs student services, and support for certain campus child care centers. COLA = cost‑of‑living adjustment. |
|
About Half of New Community College Funding Is for Apportionments, Half for One‑Time Initiatives. About half of new community college funding is for apportionments (consisting of $94 million for a 1.48 percent COLA, $79 million for 1.34 percent enrollment growth, and $24 million for an unallocated increase). The remainder is for categorical programs and is mainly one time. By far the largest of these initiatives is $150 million one time for community colleges to develop “guided pathways”—detailed, term‑by‑term roadmaps for students to complete academic programs, accompanied by early academic planning and ongoing student support services. The budget also includes $20 million one time for innovation awards to community colleges. Whereas the administration has been closely involved in implementing innovation awards in previous years, the proposal this year provides the Chancellor’s Office substantial latitude to set award criteria and select winners.
Budget Plan Includes $601 Million in Additional Proposition 98‑Related Funding. In addition to the $2.1 billion increase in the 2017‑18 minimum guarantee, the Governor’s budget includes $601 million in funding from one‑time sources. Of this amount, $400 million is a proposed settle‑up payment related to meeting the 2009‑10 minimum guarantee. The Governor counts this amount as a Proposition 2 debt payment. After making this payment, the state would have a remaining settle‑up obligation of $626 million ($532 million associated with 2009‑10 and $94 million for more recent years). The other source of one‑time funding consists of $201 million in unspent Proposition 98 funding from previous years. The Governor proposes to use the combined $601 million for four activities: (1) paying down the K‑12 mandates backlog ($287 million), (2) funding the third and final year of the CTE Incentive Grant program ($200 million), (3) addressing deferred maintenance at the community colleges ($44 million), and (4) swapping out $70 million in ongoing funding (primarily for special education).
Budget Plan Includes Substantial Funding for School and Community College Facility Projects. Passed by the voters in November 2016, Proposition 51 authorizes the state to sell $9 billion in general obligation bonds—$7 billion for schools and $2 billion for community colleges. The Governor’s budget proposes to sell $601 million of these bonds in 2017‑18, including $594 million for schools and $7.4 million for community colleges. The Governor’s proposal for schools would fund the state’s list of $370 million in already approved facility projects, as well as $230 million in additional projects. For school facilities only, the Governor proposes to make distribution of bond proceeds contingent on two conditions. Specifically, he proposes (1) requiring schools to enter into upfront grant agreements that include certain conditions and accountability measures and (2) making schools’ associated expenditures subject to local independent audits. For community colleges, the proposed $7.4 million would fund preliminary plans for five projects (two addressing seismic risks, two modernizing instructional space, and one replacing utility infrastructure).
Delays Implementation of Multiyear Preschool Agreement. As part of the 2016‑17 budget package, the Legislature and the Governor agreed on a four‑year plan to increase ongoing Proposition 98 State Preschool funding by roughly $200 million. In 2016‑17, the state provided $51.5 million for the first year of State Preschool augmentations—consisting of $43.7 million for preschool rate increases to begin January 1, 2017 and $7.8 million for 2,959 additional full‑day slots to begin April 1, 2017. (The state also provided $7.1 million non‑Proposition 98 General Fund for the wrap portion of State Preschool provided by non‑local educational agencies.) The agreement for 2017‑18 assumed annualization of the prior‑year cost increases, additional rate increases, and 2,959 additional full‑day slots. The Governor’s budget proposes to annualize the cost of the new slots created in 2016‑17, but he suspends all other components of the agreement for 2017‑18, extending the plan through 2020‑21.
LAO Comments
Assumptions About State General Fund Revenue Key Factor Affecting Estimates of the Guarantee. Though the Governor’s budget includes revised estimates of most of the inputs affecting the calculation of the minimum guarantee, the revisions to General Fund revenue estimates account for nearly all of the changes in school funding. Absent the drop in revenue across 2015‑16 and 2016‑17, estimates of the minimum guarantee in those two years would be similar to the estimates made last June. Regarding 2017‑18, the administration’s estimate of the minimum guarantee is about $1 billion below our November estimate. The administration’s lower estimate of General Fund tax revenue explains the bulk of this difference. In May, both the administration and our office will release updated estimates of General Fund revenue. Below, we discuss how updated revenue estimates could affect the guarantee. We then comment on the overall mix of one‑time and ongoing spending included in the Governor’s plan.
Minimum Guarantee Not Likely to Change Much in 2015‑16. The guarantee in 2015‑16 is not particularly sensitive to revenue changes. State revenue could increase by as much as $700 million with no increase in the minimum guarantee. This is because Test 2 would become operative but no maintenance factor payment would be required. Increases above this level would require the state to begin paying off maintenance factor, with the guarantee increasing about 50 cents for each dollar of additional revenue. Regarding downward revisions, revenue also could fall by as much as $1.8 billion in 2015‑16 with no effect on school funding. This buffer is due to the equal pain/equal gain formula, which offsets the drop in the guarantee that would occur otherwise.
Minimum Guarantee in 2016‑17 Is Somewhat More Sensitive to Revenue Changes. We estimate the 2016‑17 minimum guarantee would rise or fall about 50 cents for each dollar of higher or lower revenue. Regarding upward revisions, the guarantee increases because the faster growth in per capita General Fund revenue increases the funding required under Test 3. Though additional revenue eventually would make Test 2 operative, the guarantee would increase further as maintenance factor payments become required. On the downside, a drop in revenue would lower the growth in per capita General Fund revenue and produce a correspondingly lower Test 3 requirement.
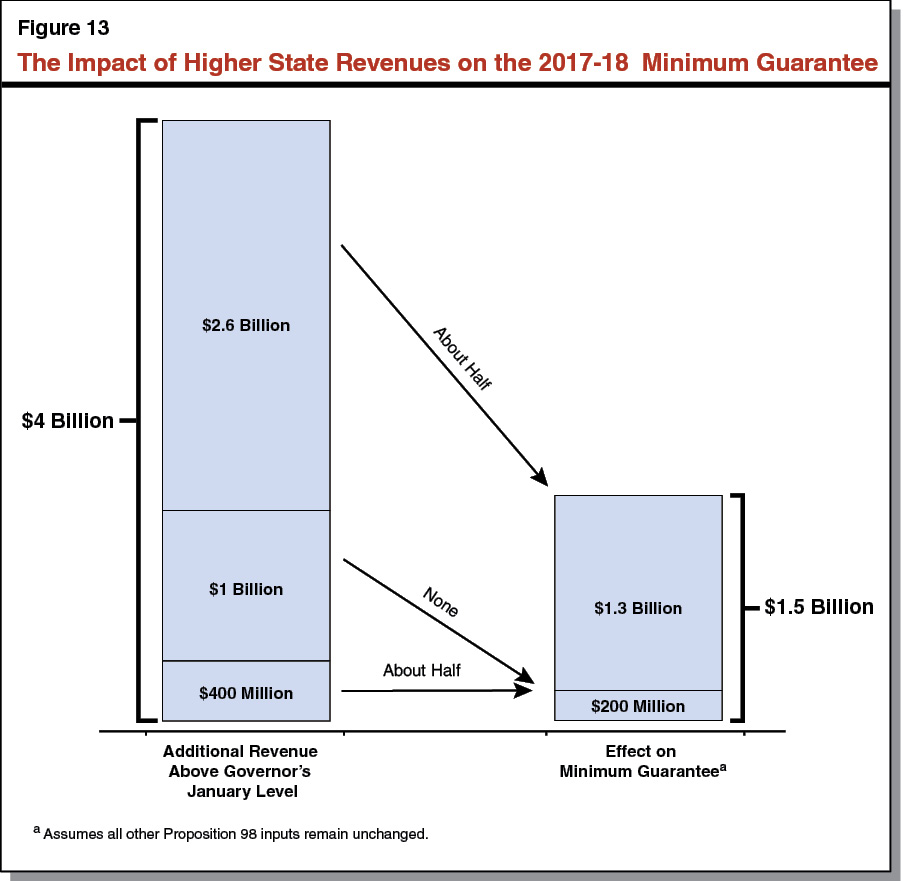
Higher General Fund Revenue, Higher Minimum Guarantee Likely for 2017‑18. As discussed in our recent Overview of the Governor’s Budget report, we believe the administration’s estimate of state revenue is low given its other economic assumptions. By May, General Fund revenue in 2017‑18 could be significantly higher than assumed in January. Holding other factors constant, these higher revenue estimates would increase the 2017‑18 guarantee. As Figure 13 shows, certain revenue cut points have specific associated impacts on the minimum guarantee. For the first roughly $400 million of additional revenue, the guarantee increases by about $200 million, bringing school funding to the level required to keep pace with growth in per capita personal income. For the next $1 billion of additional revenue, the guarantee does not change. Any further revenue increase, up to an additional $2.6 billion, would trigger a requirement to make maintenance factor payments and would increase the guarantee by about 50 cents for each additional dollar of revenue. In cumulative terms, revenue increases of $2 billion and $4 billion above the Governor’s January level would increase the 2017‑18 guarantee by $500 million and $1.5 billion, respectively. Revenue increases beyond about $4 billion likely would have no effect on the minimum guarantee.
Recommend Relying on Mix of Ongoing and One‑Time Spending. The Governor’s budget roughly balances new ongoing and one‑time Proposition 98 spending. Regardless of the exact level of the 2017‑18 minimum guarantee, we recommend the Legislature adopt a final budget plan that continues to rely upon on a mix of ongoing and one‑time spending. The Legislature has taken such an approach the past few years. Under this approach, the Legislature could dedicate a portion of any additional increases in the minimum guarantee to LCFF and CCC apportionments while using the remainder for one‑time payments to reduce or eliminate the K‑12 mandates backlog. A stronger 2017‑18 fiscal year does not necessarily imply a strong 2018‑19 fiscal year. By setting aside some funding for one‑time purposes, the state would be better positioned to accommodate a drop in the 2018‑19 guarantee without needing to make cuts to LCFF or community college apportionments.
Back to the TopLocal Control Funding Formula
The Governor’s budget contains three major proposals related to LCFF: (1) deferring an $859 million LCFF payment from June 2017 to July 2017, (2) eliminating the deferral the next payment cycle, and (3) providing a $744 million augmentation for LCFF implementation in 2017‑18. Below, we discuss the main components of LCFF, describe the Governor’s LCFF proposals in detail, and assess those proposals.
Background
State Enacted New School Funding Formula in 2013‑14. A few years ago, the state enacted major changes to the way it allocates funding to school districts and charter schools. Previously, the state distributed school funding through a combination of general purpose grants (called “revenue limits”) and more than 40 state categorical programs. Districts could use general purpose grants for any educational purpose, but they had to spend categorical funding on state‑prescribed activities. In 2013‑14, the state eliminated most categorical programs, replacing all the previous program‑specific funding formulas with one new formula. The new formula significantly increased the size of general purpose grants and directed more funding to districts with disadvantaged students.
New Formula Based on Student and District Characteristics. As Figure 14 shows, LCFF has three primary components: (1) base funding rates tied to four grade spans; (2) supplemental funding for English learner, low‑income, and foster youth (EL/LI) students; and (3) concentration funding for districts with relatively high proportions of EL/LI students (more than 55 percent of their enrollment). Base rates generally increase for higher grades in recognition of their higher costs—for example, providing career technical education in high school. The K‑3 rate is an exception to this rule. Intended to support smaller class sizes in the early grades, it is higher than the rates for grades 4‑8.
Figure 14
Local Control Funding Formula Per‑Student Rates
Effective 2017‑18 School District and Charter School Rates Under Governor’s Budget
|
Grade Span |
Base |
Supplementala |
Concentrationb |
|
K‑3 |
$7,626 |
$1,525 |
$3,813 |
|
4‑6 |
7,011 |
1,402 |
3,505 |
|
7‑8 |
7,220 |
1,444 |
3,610 |
|
9‑12 |
8,583 |
1,717 |
4,291 |
|
aEquals 20 percent of the base rate. Generated for each student who is a foster youth, English learner, or low income (EL/LI). bEquals 50 percent of the base rate. When EL/LI students comprise more than 55 percent of total district enrollment, generated for each EL/LI student above that threshold. |
|||
An Illustration of Two Districts’ LCFF Calculations. Figure 15 shows the LCFF calculation for two equally sized elementary school districts. Both districts generate the same amount of base funding as they serve the same number of students in each of the K‑3 and 4‑6 grade spans, but District A has a notably higher share of EL/LI students than District B (91 percent compared to 50 percent) and thus generates more supplemental funding. District A also has a student population that is more than 55 percent EL/LI, thereby generating concentration funding. Given these differences in student demographics, District A receives a total of $431,000 more than District B.
Figure 15
Illustration of LCFF Calculation for Two Elementary Districtsa
|
District A |
District B |
Difference |
|
|
District Characteristics |
|||
|
Grades K‑3 attendance |
100 students |
100 students |
— |
|
Grades 4‑6 attendance |
120 students |
120 students |
— |
|
EL/LI percentageb |
91% |
50% |
41% |
|
LCFF Funding |
|||
|
Grade span funding |
$1,645,000 |
$1,645,000 |
— |
|
Supplemental funding |
299,000 |
164,000 |
$135,000 |
|
Concentration funding |
296,000 |
— |
296,000 |
|
Totals |
$2,240,000 |
$1,809,000 |
$431,000 |
|
aReflects statutory rates adjusted for the cost of living through 2016‑17. Rounded to nearest thousand. bEL/LI students as a share of total enrollment. LCFF = Local Control Funding Formula and EL/LI = English learner/low‑income students. |
|||
Implementation Expected to Take Several Years. In developing LCFF, the state created per‑student funding targets that were significantly higher than the going rates, with the cost of full LCFF implementation estimated at $57 billion (or $18 billion more than the combined cost of general purpose grants and categorical programs under the previous system). Starting in 2013‑14, the state began providing augmentations to LCFF to close the difference (or gap) between their prior‑year funding level and their LCFF target level. Based on projections of growth in Proposition 98 funding, the administration estimated that the state would reach full implementation of LCFF in 2020‑21. Over the past four years, the state has provided $15.7 billion towards implementing the formula. As shown in Figure 16, LCFF was 73 percent funded in 2013‑14 and is 96 percent funded in 2016‑17.
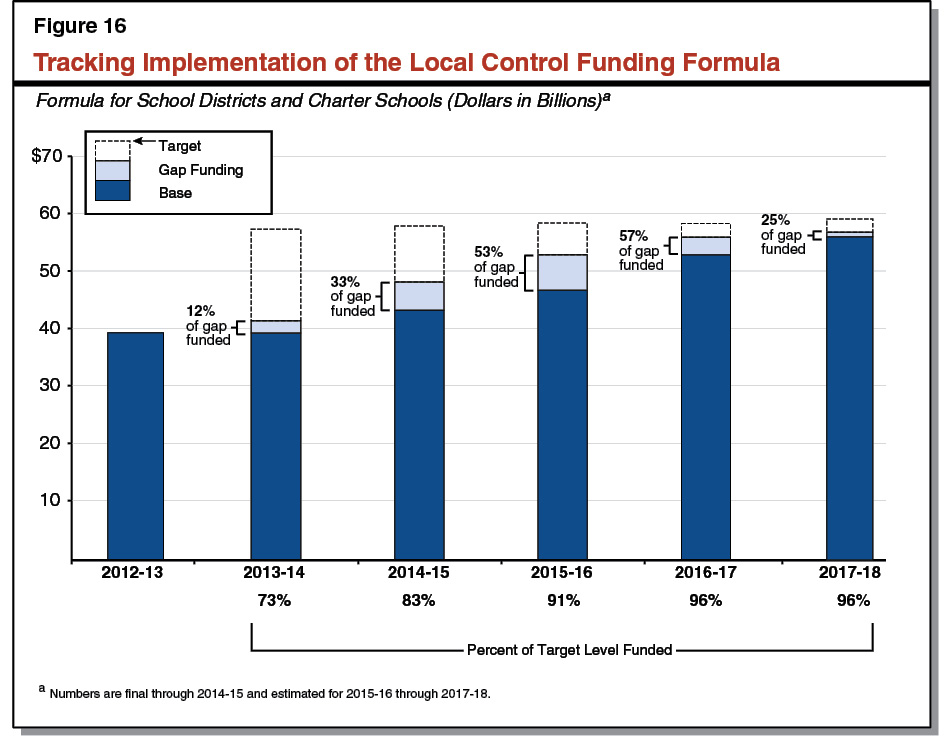
LCFF Provides Considerable Funding for EL/LI Students. Assuming all components of the formula are being phased in at the same rate (that is, base, supplemental, and concentration funding all are 96 percent funded), districts in 2016‑17 received $37 billion for EL/LI students (out of a total $55.8 billion in LCFF funding). Of the $37 billion, $28.4 billion is base funding, $5.6 billion is supplemental funding, and $3 billion is concentration funding.
State Law Guides Use of Some EL/LI Funding. Districts can use most LCFF funds for any educational expense, but they must use some funding specifically for the benefit of EL/LI students. Specifically, districts must demonstrate they are “increasing or improving” services for EL/LI students in proportion to the funding increases generated by these students.
Governor’s Proposal
Defers LCFF Payment From June to July 2017. As part of his budget package, the Governor proposes to defer an $859 million LCFF payment from June 2017 (the 2016‑17 fiscal year) to July 2017 (the 2017‑18 fiscal year). Because schools still would receive their full LCFF allotment within a few weeks of the original payment date, the deferral is intended to have no programmatic effect.
Eliminates the Deferral in 2017‑18. The Governor proposes to eliminate the deferral for the next payment cycle. Under the proposal, schools would receive 13 months of payments in 2017‑18—12 normal monthly LCFF payments plus an additional payment related to the prior‑year deferral. Paying off the deferral entails a one‑time cost of $859 million in 2017‑18 (just as deferring the payment initially creates $859 million in one‑time savings in 2016‑17). Eliminating the deferral allows the state to return to the regular statutory LCFF payment schedule moving forward.
Provides LCFF Augmentation. In addition to eliminating the deferral, the Governor proposes a $744 million (1.4 percent) augmentation in 2017‑18—bringing total LCFF funding to $56.6 billion. Given the increase is approximately equal to the 1.48 percent statutory COLA applied to the LCFF target rates, we estimate the proposed 2017‑18 funding level would continue to fund 96 percent of the full implementation cost. (To achieve full funding in 2017‑18, the administration estimates an additional $2.3 billion, beyond the proposed $744 million augmentation, would be required.)
Assessment
Exhaust Other One‑Time Options Before Deferring LCFF Payment. We recommend the state exhaust other potential one‑time options before adopting a payment deferral for 2016‑17. Most notably, the state is likely to learn over the coming months that certain programs have unspent funds available for 2016‑17. These unspent funds could be redirected to other Proposition 98 programs, thereby reducing or eliminating the need for a payment deferral. Were the Legislature to adopt a deferral for 2016‑17, we recommend eliminating the deferral as soon as possible thereafter. Barring a recession in 2017‑18, we recommend the Legislature take the same approach as the Governor and eliminate the deferral in 2017‑18. Making payments on time is a responsible fiscal practice and ensures school districts do not experience the unintended consequences of higher borrowing costs or programmatic cuts.
Prioritizing LCFF Implementation Consistent With State’s Prior‑Year Actions. The Governor’s plan to dedicate most new ongoing K‑12 funding to LCFF implementation is consistent with the Legislature’s approach over the past four years. By continuing to prioritize LCFF implementation, both the Governor and the Legislature would be fostering greater local control and flexibility while simultaneously providing more funding for disadvantaged students. Come May, the Legislature might decide it could dedicate even more to LCFF implementation. As we discuss earlier in this report, we believe the Governor’s revenue estimates, and related estimate of the Proposition 98 minimum guarantee for 2017‑18, are low. Were these estimates to be revised upward, more funds would become available for Proposition 98 priorities in 2017‑18.
Some Districts Experiencing More Growth Under LCFF Than Others. Districts do not all benefit in the same way under LCFF. By design, LCFF provides larger funding increases to districts with more EL/LI students and to districts that historically received less state funding than their peers. Though LCFF funding statewide would increase 1.4 percent in 2017‑18 under the Governor’s proposal, districts would continue experiencing their own unique growth rates depending upon their EL/LI counts and their existing funding levels. We estimate about 70 districts (7 percent) would experience growth of 2 percent or more, about 440 would experience LCFF growth of between 1 and 2 percent, and the remaining 435 districts would experience LCFF growth of less than 1 percent.
Back to the TopSpecial Education
In this section, we provide background on special education in California, describe the Governor’s special education budget proposals, and discuss various issues we believe the Legislature should consider if it is interested in changing the state’s special education funding system.
Background
Federal Law Requires Schools to Provide Additional Services to Students With Disabilities. Special education is instruction designed to meet the unique needs of each child with a disability. The federal Individuals with Disabilities Education Act (IDEA) requires schools to identify students with disabilities and develop an individual service plan for each one.
State and Federal Governments Provide Categorical Funding to Cover Some Special Education Costs. Schools receive billions of dollars each year (mostly from LCFF) to educate all students, including students with disabilities. These funds primarily are intended to cover general education costs such as teacher salaries. Beyond these general education costs, schools incur additional costs, such as specialized support staff salaries and adaptive equipment, to serve students with disabilities. To help cover these additional costs, both the state and federal governments provide categorical funds specifically for special education. As Figure 17 shows, state and federal categorical funding covers about 40 percent of special education costs in California. Schools cover remaining special education costs with unrestricted funding (mostly from LCFF).
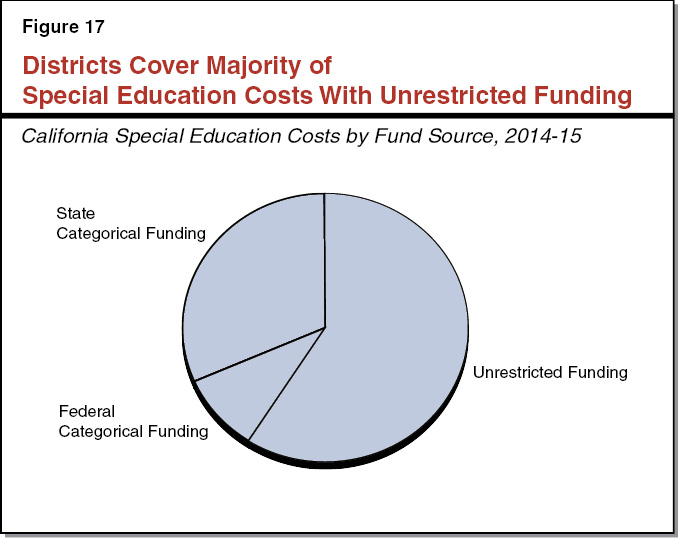
Most Categorical Funds Allocated to Special Education Local Plan Areas (SELPAs). In the late 1970s, the state began requiring all districts to belong to SELPAs. Currently, California has 131 SELPAs. Of these SELPAs, 42 consist of a single school district, most of which have more than 20,000 students (ADA). The state considers these districts large enough to serve all their students with disabilities. As Figure 18 shows, these SELPAs account for about one‑third of all students in the state. The state’s remaining districts (most of them small or mid‑sized) belong to one of 84 collaborative SELPAs. Each of these SELPAs is a collection of neighboring districts that by themselves are considered too small to serve all their students with disabilities. Since 2003‑04, the state has allowed charter schools to join charter‑only SELPAs. These SELPAs are collections of charter schools from across the state that have agreed to share administrative costs. In 2016‑17, four charter‑only SELPAs existed. Though they serve a small share of overall statewide attendance (about 2 percent in 2015‑16), they serve about a quarter of charter school students statewide. (The state’s remaining SELPA serves only students attending Los Angeles County court schools.)
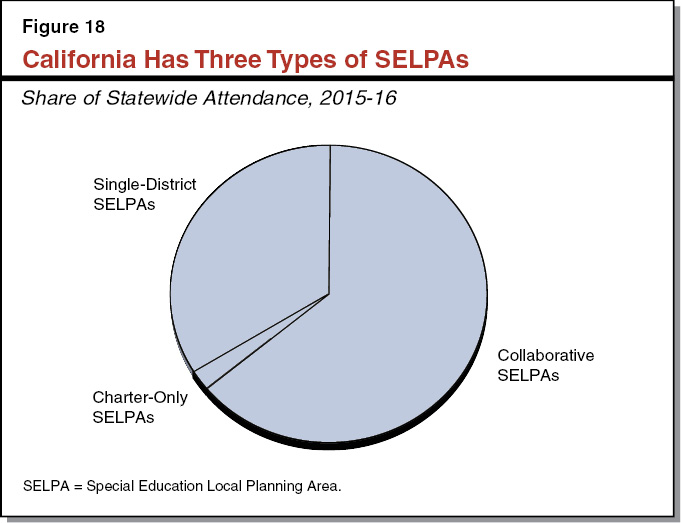
Most State Categorical Funds Distributed According to Overall Student Population. About 85 percent of state special education funding is distributed according to a student‑based formula commonly called AB 602 (after the legislation that introduced it in 1998). This formula allocates funds to SELPAs based on their total student attendance, regardless of how many students are served in special education. By distributing funding based on total student attendance rather than a more direct measure of special education costs (for example, the number of students identified for special education or the types of services these students are provided), AB 602 ensures no SELPA has an incentive to over‑identify students for special education or serve these students in unnecessarily expensive settings.
Some State Special Education Categorical Funds Distributed According to Other Factors. In addition to AB 602 base funding, the state has several other special education categorical programs. Figure 19 describes each of these program’s allocation formula and spending restrictions. (For simplicity, we have condensed a few small categorical programs into larger categories in the figure. Most notably, the state technically has two extraordinary cost pools and two programs for Necessary Small SELPAs.) After AB 602 base funding, the largest special education categorical program distributes $360 million on a per‑student basis specifically for mental health services. The next largest program distributes $145 million to SELPAs according to the number of Licensed Children’s Institutions (such as group homes) located within their boundaries.
Figure 19
California Has Several Special Education Categorical Programs
(In Millions)
|
Program |
2016‑17 Funding |
Allocation Formula |
Spending Restrictions |
|
AB 602 |
$3,136 |
Each SELPA receives a unique rate per student |
Any special education expense |
|
Mental Health Services |
360 |
Flat rate per student |
Mental health services for special education students |
|
Out‑of‑Home Care |
145 |
Location and capacity of Licensed Children’s Institutions |
Any special education expense |
|
Workability |
40 |
Number of students enrolled in qualified program |
Employment training and assistance |
|
Low Incidence Disabilities |
17 |
Number of students who are deaf, hard of hearing, visually or orthopedically impaired |
Services or materials for students with qualifying disabilities |
|
Extraordinary Cost Pools |
6 |
SELPAs can be reimbursed for documented exceptional costs |
Unusually expensive single‑student services |
|
Necessary Small SELPAs |
2 |
Must be countywide SELPA with less than 15,000 ADA |
Any special education expense |
|
SELPA = Special Education Local Planning Area and ADA = average daily attendance. |
|||
Collaborative SELPAs Retain Some Funds for Regional Services, Allocate Rest to Members. Each collaborative SELPA must decide for itself how to allocate its share of categorical special education funding to member districts. Typically, SELPAs adopt allocation plans that retain some funding for regional services and distribute remaining funding to member districts. Member districts vote to adopt their allocation plans. Specific voting rules vary among SELPAs. For example, in some SELPAs, each district has one vote regardless of its size, whereas in other SELPAs, larger districts have more votes than smaller districts.
State Has Separate Planning Requirements for General and Special Education. With the introduction of LCFF, the state began requiring districts to develop annual plans outlining the services they provide to all students, and in particular the services they plan to provide certain student groups such as English learner, low‑income, and foster youth students. Before adopting these plans, school administrators must talk to parents and other local stakeholders about the types of services they want schools to provide. Special education is not specifically included in this annual planning process. Instead, SELPAs engage in a separate planning process, including separate conversations with parents and other local stakeholders. Under this process, SELPAs submit annual budget and service plans to CDE.
Governor’s Proposal
Governor’s Budget Proposes Slight Increase in Special Education Funding. The Governor’s budget includes $3.8 billion in state categorical funding for special education, representing a $46 million increase over the 2016‑17 Budget Act level. This year‑over‑year increase reflects a small decrease for declining student attendance and a 1.48 percent COLA. We have no concerns with these proposed adjustments.
Governor Proposes Statewide Conversation on Special Education Funding. In The 2017‑18 Governor’s Budget Summary, the administration expresses concern with the current special education funding model and proposes a series of stakeholder meetings to discuss possible changes. Though not explicitly stated in the budget summary, the administration has indicated an interest in rolling special education into LCFF and directing all special education funding to districts rather than SELPAs. The administration believes this change would increase district autonomy, make K‑12 funding simpler and more equitable, and better integrate general and special education. Before undertaking a significant restructuring of special education, we think the Legislature has several key issues to consider, as discussed below.
Issues for Consideration
Many Concerned About Silos Between General and Special Education. In 2015, a statewide task force of special education experts expressed concern that special education programs in California are developed separate from other school services, with little discussion between general and special educators about how best to serve students. Whereas special education directors focus on their AB 602 funding and developing their special education budget and service plans for CDE, district budget directors focus on their LCFF funding and developing a comprehensive, coordinated plan for general education services. Given these separate funding streams and planning processes, special education directors and district budget directors tend to have little regular interaction. This lack of regular communication and coordination could be resulting in inferior or inappropriate services for students with disabilities. Most notably, the disconnect could result in more students with disabilities being served in separate classrooms where they are largely isolated from other students. Our office has heard concerns about the disconnect between general and special education not only from state‑level groups but also from district‑level teachers, administrators, and parents.
Many Believe LCFF Has Removed Similar Silos Between Program and Budget Experts. Prior to LCFF (when many state categorical programs existed), stakeholders commonly complained about the lack of cooperation between program and budget experts at the district level. Program experts tended to focus narrowly on the programmatic requirements associated with the specific categorical programs that applied to them. School district budget officers devoted much of their time to familiarizing themselves with state categorical programs and ensuring their districts appropriately accounted for all associated spending. Rarely did program and budget experts come together to consider how best to build comprehensive, coherent, and coordinated academic plans. Many administrators believe that eliminating most categorical funding and introducing a streamlined LCFF planning process significantly improved cooperation between program and budget experts. The administration believes consolidating special education into LCFF would achieve similar benefits—removing silos between general and special education.
Federal Law Limits District Discretion Over Special Education Services and Spending. By eliminating most state categorical programs and folding associated funding into LCFF, the state effectively freed up funding for districts’ local priorities. Eliminating special education categorical programs and folding associated funding into LCFF, however, would not allow districts that same flexibility. This is because federal law requires districts to spend at least as much on special education each year as they spent the previous year. Consequently, districts would be unable to repurpose the increase in their LCFF funding to support other local programs and priorities. Though the lack of discretion could be viewed as a downside to rolling special education into LCFF, it also could be viewed as an upside, ensuring districts do not reduce their spending on students with disabilities even under a simpler, streamlined funding model.
Current Special Education Funding Model Does Not Offer Any Clear Benefit to Single‑District SELPAs. Categorical programs can be justified either because they direct more funding to areas with unusually high costs or they protect important services that educational providers might otherwise not offer. Categorical special education funding for single‑district SELPAs satisfies neither of these conditions. These districts receive both LCFF and AB 602 funding based on total student attendance, and their spending on special education services is dictated by federal law. In these districts, the state’s categorical special education program likely could be eliminated and associated funding allocated under LCFF without much, if any, effect on student services.
Collaborative SELPAs Provide Three Benefits to Small and Mid‑Sized Districts . . . The main advantage of categorical special education funding is for collaborative SELPAs, which provide members three valuable benefits. First, collaborative SELPAs provide economies of scale to districts that otherwise could not afford appropriate services. For example, a small district might be unable to afford a specialized teacher to assist a single student who is visually impaired, but a collection of neighboring districts typically can afford a teacher who collectively serves all of their visually impaired students. Second, collaborative SELPAs smooth year‑to‑year fluctuations in their members’ special education costs by redirecting funds from districts with unusually low costs to those with unusually high costs. Pooling resources within a collaborative SELPA effectively protects districts, particularly small districts, when their own special education population increases unexpectedly or some of their special education students require expensive services in a given year. Finally, collaborative SELPAs can reduce administrative costs by providing centralized data management and legal services to member districts.
. . . But Also Can Affect Mid‑Sized Districts Negatively. Though collaborative SELPAs provide key benefits to small and mid‑sized districts, they also can affect mid‑sized districts in negative ways. Some administrators of mid‑sized districts within collaborative SELPAs claim their SELPA policies discourage them from pursuing some programmatic improvements. For example, some collaborative SELPAs retain a portion of categorical special education funding to provide regional programs. Districts in these SELPAs can choose between serving their students in neighborhood schools (and directly paying the full cost of these services) or busing their students to a regional program (where services would be provided at little, if any, additional cost to the district). A district that believed it could provide better services locally might still send students to the regional program because of this cost disparity. We have heard that mid‑sized districts are most likely to be adversely affected by these kinds of SELPA policies. Unlike large districts, mid‑sized districts typically are unable to become single‑district SELPAs, and unlike small districts, mid‑sized districts often are able to directly serve most of their students with disabilities. While in theory these districts should be able to work within their SELPAs to negotiate better arrangements, in practice some SELPAs retain voting structures designed decades ago. In some of these voting structures, a mid‑sized district might find itself consistently out‑voted by neighboring small districts, leaving it with little voice in how categorical special education funding is spent.
State Could Support Small and Mid‑Sized Districts Without Current SELPA Model. We believe the state has several options for maintaining the benefits of collaborative SELPAs even while providing most special education funding directly to districts. For example, the state could address the economies of scale issue by requiring county offices of education to be a special education provider of last resort for small and mid‑sized districts. The state could manage yearly fluctuations in special education costs by increasing the size of its extraordinary cost pools and making it easier for districts to access these funds. The state could reduce administrative costs by encouraging districts to purchase data management services from providers located anywhere in the state (just as the state currently allows charter schools to purchase these services from statewide providers). If the state wanted to move away from the current SELPA model, there are likely several more options that preserve valuable attributes of the existing system without maintaining its exact organizational structure.
Alternatively, State Could Increase District Autonomy and Accountability While Retaining Current SELPA Model. Just as we believe the state could maintain the benefits of SELPAs even while providing most special education funding directly to districts, we also believe the state could increase district autonomy and accountability even while providing some or most special education funding directly to SELPAs. For example, the state could increase district autonomy by establishing a formal process for mediating disagreements between SELPA members or making the process of becoming a single‑district SELPA easier. The state also could increase district‑level accountability by formally integrating special education into the LCFF yearly planning process.
Per‑Student Funding Rates Vary Notably Between SELPAs. One key problem the administration cites with the state’s existing special education funding system relates to funding inequities. As Figure 20 shows, SELPAs’ AB 602 per‑student rates vary notably—with a nearly $100 per pupil difference between the lowest‑ and highest‑funded deciles. These inequities reflect historical anomalies and are not justified by current differences in special education costs. Regardless of whether the state pursues larger changes to special education funding, we recommend it work to eliminate these inequities.
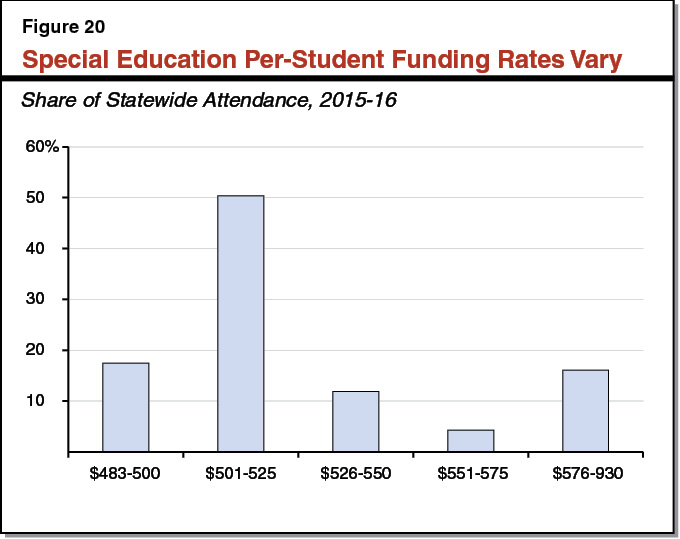
Some Special Education Categorical Programs Have Questionable Merit, Others More Obvious Benefits. We also share the administration’s concerns about the complexity of current special education funding and think some existing special education categorical programs have little merit. Most notably, the state has no clear, strong rationale for earmarking funding for mental health services given no other special education services receive earmarked funding. Though some special education categorical programs do not seem justified, we believe others continue to serve valuable functions. Most notably, Necessary Small SELPAs (which serve counties with fewer than 15,000 students) do not have the same level of economies of scale as larger SELPAs and thus can experience unusually high special education costs. The state might wish to continue providing targeted funding to these areas even if it eliminates most other special education categorical programs.
Special Education Restructuring Likely to Involve Several Complex Components. Any effort to include special education in LCFF will require decisions about the LCFF formula, state SELPA requirements, the treatment of charter schools, property tax revenue, academic planning, and accountability, along with many other related issues. Not only do many decisions need to be made, but those decisions would affect many stakeholders, ranging from districts of all sizes to county offices of education, charter schools, general and special educators, parents, advocates, and students.
Suggest Legislature Take Time to Consider Options and Examine Potential Consequences. Given the complex issues involved and the number of groups potentially affected, we encourage the Legislature to take its time in evaluating any overarching change to special education funding. Though the administration’s restructuring goals sound laudable, restructuring could have unintended consequences without sufficient study. The overall endeavor, however, could be worthwhile. Potentially, the state could discover new and better ways to provide reasonable protections for small and mid‑sized districts and the students they serve while also doing a better job of encouraging innovation and cooperation at the district level.
Back to the TopPreschool
In this section, we provide an overview of California’s preschool programs, then discuss key issues relating to preschool slots and preschool program alignment.
Overview
State Has Two Main Preschool Programs. In 2016‑17, California spent $1.8 billion on two main preschool programs: State Preschool and Transitional Kindergarten. Of this amount, $1.1 billion supported 164,000 State Preschool slots and $700 million supported nearly 80,000 Transitional Kindergarten slots. As Figure 21 shows, these programs have different eligibility criteria, program length, staffing requirements, and funding rates. Transitional Kindergarten is run exclusively by LEAs. By comparison, about half of State Preschool providers are LEAs (accounting for two‑thirds of slots) and half are non‑LEAs (accounting for one‑third of slots). In addition to these state programs, the federal government runs the Head Start preschool program. Of all subsidized preschool slots for four‑year olds in California in 2014‑15, 52 percent were in State Preschool, 31 percent in Transitional Kindergarten, and 18 percent in Head Start.
Figure 21
Comparing California’s Two Major Preschool Programs
|
State Preschool |
Transitional Kindergarten |
|
|
Eligibility criteria |
Four‑year olds from families with incomes at or below 70 percent of state median income as calculated in 2007.a Children in full‑day program must have parents working or in school. |
Four‑year olds with birthdays between September 2 and December 2.b |
|
Providers |
Local education agencies and subsidized centers. |
Local education agencies. |
|
Program length |
At least 3 hours per day, 175 days per year for part‑day program. At least 6.5 hours per day, 250 days per year for full‑day program. |
At least 3 hours per day, 180 days per year. |
|
Teacher qualifications |
Child Development Teacher Permit (24 units of ECE/CD plus 16 general education units).c |
Bachelor’s degree, Multiple Subject Teaching Credential, and a Child Development Teacher Permit or at least 24 units of ECE/CD or comparable experience.c,d |
|
Staffing ratios |
1:24 teacher‑to‑child ratio and 1:8 adult‑to‑child ratio. |
1:33 teacher‑to‑child ratio. |
|
Annual funding per childe |
$4,386 (part‑day) and $10,114 (full‑day). |
Average of $8,810. |
|
aPrograms may serve three‑year olds from income‑eligible families if all eligible and interested four‑year olds have been served first. bSchools may serve younger four‑year olds with birthdays before the end of the school year but those children do not generate state funding until they turn five. cReferenced permit and credential are issued by California’s Commission on Teacher Credentialing. dThe requirements shown apply to teachers hired after July 1, 2015. eFunding rates are 2016‑17 estimates. ECE/CD = Early Childhood Education/Child Development. |
||
State Authorized Districts to Create “Expanded” Transitional Kindergarten in 2015‑16. As part of the 2015‑16 budget plan, the Legislature enacted trailer legislation that allows school districts and charter schools to enroll four‑year old children in Transitional Kindergarten if their fifth birthday falls between December 2 and the end of the school year. These children generate attendance‑based funding when they turn five. A child with a birthday in the middle of January, for example, would generate funding for roughly half of the school year. The state does not collect data on the number of children enrolled as a result of these expanded Transitional Kindergarten provisions. Several large school districts, however, indicate they have expanded their Transitional Kindergarten programs under the new provisions. In 2015‑16, for example, the Los Angeles Unified School District indicated it served 2,900 children through the expanded Transitional Kindergarten provisions.
State Has Complicated Way of Funding Preschool Programs. For State Preschool, CDE contracts with individual providers using a Standard Reimbursement Rate for every child served. The funding source is primarily Proposition 98 General Fund, though full‑day programs run by non‑LEAs receive non‑Proposition 98 General Fund for the wraparound portion of their program. The state funds Transitional Kindergarten through LCFF, which is funded with Proposition 98 General Fund and local property tax revenue.
Governor Proposes Various Changes in Preschool Funding. The Governor’s budget includes an additional $30 million (Proposition 98 General Fund) for preschool programs in 2017‑18, a 2 percent increase from 2016‑17. The largest component of this increase is $24 million due to annualizing costs for the 2,959 full‑day, LEA State Preschool slots approved in the 2016‑17 budget and set to start April 1, 2017. The budget also includes a $10 million increase in Transitional Kindergarten associated with the Governor’s overall proposed augmentation for LCFF. These increases are offset by a statutory $4 million reduction to State Preschool to account for a 0.4 percent decline in the birth to four population. For State Preschool, the budget does not include a statutory 1.48 percent COLA nor does it annualize funding for the 10 percent Standard Reimbursement Rate increase scheduled to begin January 1, 2017. (For administrative reasons, CDE implemented this rate increase as a 5 percent increase starting July 1, 2016. The Governor’s proposal would apply the same rates in 2017‑18 as in 2016‑17, leaving them unchanged year over year.)
Preschool Slots
Below, we provide background on recent increases in preschool slots, describe the Governor’s slot‑related proposals, assess those proposals, and offer associated recommendations.
Background
State Added Total of Almost 10,000 Full‑Day State Preschool Slots Over Last Two Years. In 2015‑16, the Legislature added 7,030 full‑day State Preschool slots, scheduled to begin January 1, 2016. Of these slots, the budget act earmarked 5,830 for LEAs and 1,200 for non‑LEAs. In 2016‑17, the Legislature added another 2,959 full‑day State Preschool slots, all for LEAs, scheduled to begin April 1, 2017.
LEAs Have Not Shown Sufficient Interest in New Full‑Day Slots. To allocate new slots across the state, CDE requests applications from interested entities and awards contracts to those that demonstrate they can meet the minimum program requirements. In 2015‑16, due to a lack of applicants, CDE issued only 1,646 of the 5,830 full‑day State Preschool slots for LEAs. With the remaining funding, the department issued 3,700 part‑day slots for LEAs, 851 part‑day slots for non‑LEAs, and 1,490 full‑day slots for non‑LEAs (above the 1,200 already earmarked in the budget). In 2016‑17, LEAs to date have applied for only 519 of the 2,959 full‑day State Preschool slots available. The CDE is currently in the process of issuing a second request for applications. If CDE is still unable to find enough LEAs interested in offering the full‑day slots, it will make funding available for part‑day slots.
Some State Preschool Providers Report Challenges Earning Their Contracts. Each State Preschool provider contracts with the state for a specified amount of funding. If it does not spend its full contract amount, the associated funds return to the state. If this occurs for multiple years, CDE can reduce the contract in future years. In 2014‑15, the most recent year of data available, $101 million in State Preschool funding allocated to providers was “unearned.” This represents 12 percent of all State Preschool funding and is almost double the unearned rate for other contract‑based child care programs (7 percent). This amount also is 77 percent higher than the amount unearned for the program in 2013‑14. Several factors might contribute to the increased difficulty in filling slots, including: providers being unable to expand or open new sites quickly enough to accommodate the rapid and significant increase in slots since 2014‑15; increased enrollment in other large competing programs for four‑year olds, such as Transitional Kindergarten and Head Start; and the state’s outdated income eligibility threshold, which is based on state median income as calculated in 2007.
Multiyear Budget Agreement Assumes Total of Almost 9,000 Additional Slots Over Four‑Year Period. While not formalized in statute, the multiyear budget agreement for preschool included 8,877 additional full‑day State Preschool slots for LEAs. These slots were to be implemented in three equal batches on April 1 of 2017, 2018, and 2019. The first batch was funded through the 2016‑17 Budget Act, with future batches intended for inclusion in the 2017‑18 and 2018‑19 budgets respectively.
Governor’s Proposal
Does Not Include Funding for Additional Slots in 2017‑18. While the Governor’s budget includes funding to annualize the cost of the slots implemented mid‑year in 2016‑17, it does not include funding for the second batch of additional slots in 2017‑18. (These slots would cost $7.5 million under the rates proposed in the Governor’s budget.)
Allows Part‑Day State Preschool Programs More Flexibility to Serve Children With Special Needs. To allow providers more flexibility to serve as many children as their contract allows, the Governor proposes to allow part‑day State Preschool programs to serve children with special needs who do not meet the income eligibility criteria as long as all eligible and interested children are served first. (Current law allows part‑day State Preschool programs to fill up to 10 percent of their slots with children from families with incomes up to 15 percent over the income eligibility limit if all eligible and interested children are served first. Under the Governor’s proposal, over‑income children with special needs would not count toward this cap.)
Assessment
School Districts Do Not Have Strong Incentives to Apply for Full‑Day State Preschool Slots. The LEAs’ lack of interest in new full‑day State Preschool slots may be due to their strong fiscal and programmatic incentives to serve children using expanded Transitional Kindergarten. Districts receive substantially more funding per day for Transitional Kindergarten than they receive for State Preschool. On a per‑day basis, Transitional Kindergarten funding is 21 percent higher than the average full‑day State Preschool rate and nearly twice the average part‑day State Preschool rate. Despite receiving higher levels of funding, Transitional Kindergarten programs operate for a shorter length of time and have fewer programmatic restrictions. They do not, for instance, have to determine income eligibility, conduct child assessments, or set up their classrooms according to specific state standards. Because of higher funding rates and fewer restrictions, we think many LEAs might be choosing to serve additional four‑year olds using expanded Transitional Kindergarten rather than through full‑day State Preschool.
Not All Eligible Children Are Being Served. Although some providers have difficulty earning their State Preschool contracts, we estimate a substantial portion of eligible children remain unserved. Specifically, we estimate that at least 1 in 5 income‑eligible four‑year olds in California are not receiving subsidized preschool through a state or federal preschool program. (If other similar programs are indicative, some families with eligible children might not be interested in participating in a preschool program, but other unserved families might desire it yet be unable to access it.)
Recommendations
Allow All Types of Providers to Apply for New Full‑Day Slots. If the Legislature is interested in supporting more full‑day State Preschool slots over the next few years, we recommend it make funds available to all providers, not only LEAs. LEAs currently do not seem to have sufficient interest in offering more full‑day slots and have strong fiscal incentives to serve children through expanded Transitional Kindergarten rather than State Preschool. If the Legislature wants more LEAs to operate State Preschool programs over the longer term, it could address funding disparities between State Preschool and Transitional Kindergarten or change eligibility requirements so that each program serves a distinct group of students.
Focus on Unserved Eligible Children Before Expanding Eligibility. Given many children eligible for State Preschool currently are unserved, we recommend the Legislature reject the Governor’s proposal to expand State Preschool eligibility to higher‑income children with special needs. Though the Governor’s proposal to serve more children with special needs seems well intended, it has the effect of displacing low‑income children who otherwise would be able to access the program. Moreover, LEAs are responsible for ensuring all four‑year old children with special needs receive service according to their individualized education program. As a result, this proposal effectively shuffles children with special needs from one program to another while bumping out low‑income children who have no other program option.
Preschool Program Alignment
Below, we provide additional background on State Preschool and Transitional Kindergarten, describe the Governor’s proposals to better align the two programs, assess those proposals, and offer associated recommendations.
Background
State Preschool and Transitional Kindergarten Have Different Health and Safety Requirements. State Preschool programs must be licensed and follow Community Care Licensing (CCL) health and safety standards. (The CCL is a division within the Department of Social Services.) These licensing standards include requirements that classrooms be clean and sanitary, children be constantly supervised, teachers be trained in first aid, and medication and cleaning supplies be stored out of reach of children. Members of the public can submit complaints to CCL regarding possible licensing violations. The CCL is then required to visit the facility within 10 days. State Preschool programs also must follow standards set by CDE regarding classroom environment, which include a mix of health, safety, and programmatic requirements. These CDE rules include requirements that furniture and toys be clean and well‑maintained and classrooms be set up with multiple stations to support different types of learning (for example, classrooms could have a science area and an art area). Both CCL and CDE visit sites once every three years to monitor compliance with regulations. By contrast, Transitional Kindergarten programs are not licensed or inspected. Instead, they must operate in buildings with the same safety specifications as other K‑12 buildings. For example, these facilities must be built to minimize the risk of damage in an earthquake.
Many State Preschool Programs Participate in Local Quality Rating and Improvement Systems (QRIS). The state provides $50 million for State Preschool QRIS each year, with funding allocated in 2016‑17 to 37 local consortia serving 49 counties. These consortia use the funds to evaluate the quality of State Preschool providers and provide additional resources to help providers improve or maintain program quality. Local consortia assess providers based on a five‑tier matrix, which awards points for different levels of staffing ratios and qualifications, the quality of child‑teacher interactions, and the implementation of certain child assessments, among other program aspects. The minimum State Preschool requirements are roughly equivalent to a Tier 3 rating.
Schools Required to Operate Transitional Kindergarten Same Length of Day as Kindergarten. Under state law, Transitional Kindergarten is the first year of a two‑year Kindergarten program. If a school district runs Transitional Kindergarten and Kindergarten programs on the same site, the two programs at that site must be run for the same length of the day. Districts that want to operate a full‑day Kindergarten and a part‑day Transitional Kindergarten program on the same site must obtain a waiver from the State Board of Education. (Districts can operate programs of differing lengths on separate school sites.)
Governor’s Proposal
Governor Interested in Better Aligning State Preschool and Transitional Kindergarten. The Governor’s budget includes several proposals to more closely align these two programs. Most of the proposals are designed to make State Preschool programs more similar to those of Transitional Kindergarten but one proposal is designed to make Transitional Kindergarten more similar to State Preschool.
Exempts State Preschool Programs Run by School Districts From Licensing Requirements. The Governor proposes to exempt State Preschool programs from CCL requirements if they operate in facilities constructed according to the state’s K‑12 building standards. Programs still would be required to follow CDE’s requirements for staffing and environment.
Includes Two Flexibility Proposals for Meeting State Preschool Staffing Requirements. The Governor proposes to exempt State Preschool providers with QRIS Tier 4 or higher ratings from the State Preschool staffing ratio requirements. These providers, however, still would need to meet licensing requirements (that is, have an adult‑to‑child ratio of 1:12). Similarly, for State Preschool programs with lower QRIS ratings or no rating, the Governor proposes to allow classrooms taught by a teacher with a Multiple Subject Teaching Credential to operate with an adult‑to‑child ratio of 1:12 (rather than the 1:8 ratio currently required).
Allows Districts to Run Part‑Day Transitional Kindergarten and Full‑Day Kindergarten on Same Site. The Governor proposes to allow school districts to run their Transitional Kindergarten and Kindergarten programs on the same site for different lengths of time without a waiver.
Assessment
Better Alignment of State Preschool and Transitional Kindergarten Programs Worthy Goal. The state currently lacks a systematic approach to providing early learning to four‑year olds, which results in wide disparities in eligibility, funding, and the types of services provided. Given this lack of coherence and unnecessary complexity, we think better alignment of the state’s two largest preschool programs is a very worthy goal.
Proposals Make Complicated System More Complicated. Although the administration intends to better align State Preschool and Transitional Kindergarten, many elements of his proposals add greater complexity to the existing system. For example, exempting only certain State Preschool programs from licensing requirements would create different requirements for State Preschool programs at LEAs and non‑LEAs. Similarly, while State Preschools run by LEAs would be exempt from licensing requirements (and more similar to Transitional Kindergarten in that respect), they still would have to follow CDE’s regulations about classroom environment (which do not apply to Transitional Kindergarten). By creating new staffing ratio standards for State Preschool teachers with a teaching credential, the staffing flexibility proposals also add complexity without allowing for complete alignment. A State Preschool classroom with a credentialed teacher still would be required to have an adult‑child ratio (1:12) almost three times lower than that of Transitional Kindergarten (1:33).
Additional Concerns With Minimum Staffing Requirement Proposals. In addition to our concerns about making the system more complicated, we also have specific concerns with the proposal to allow higher staffing ratios for credentialed teachers. Specifically, we are concerned that a teacher with a Multiple Subject Teaching credential and no early education training requirements might not be better prepared than a teacher with early education training to serve more children with less adult support.
Transitional Kindergarten and Kindergarten Funding Not Aligned With Program Length. Given the state currently allows school districts to choose the length of day for their Transitional Kindergarten and Kindergarten programs at different school sites, we see no reason to restrict their ability to offer programs of different length on the same school site. We are concerned, however, that Transitional Kindergarten and Kindergarten programs receive the same amount of funding per student regardless of program length. This lack of alignment results in a funding structure that has little connection to districts’ underlying program costs.
Recommendations
Reject Preschool Proposals, Pursue Alignment More Holistically. Rather than make marginal changes to existing preschool programs to get them to operate somewhat more similarly, we recommend the Legislature take a more holistic approach. Under such an approach, the Legislature would consider how best to serve four‑year olds, particularly those from low‑income families. To this end, it would consider what eligibility criteria, program standards, and funding levels it desired for these children. Making all these decisions in tandem would provide for better alignment and coherence.
Adopt Transitional Kindergarten/Kindergarten Flexibility in Tandem With Differential Rates. If the Legislature does not pursue holistic reform of programs serving four‑year olds, we recommend it adopt the Governor’s proposal regarding Kindergarten and Transitional Kindergarten flexibility and also establish differential funding rates for full‑day and part‑day programs. Such an approach would better align school district funding to actual program costs and reduce funding disparities between part‑day State Preschool and part‑day Transitional Kindergarten programs.
Back to the TopEducation Mandates
In this section, we first provide background on state education mandates. Next, we discuss the Governor’s proposal for paying down a portion of the mandates backlog. We then consider his proposal to fund a new mandate requiring schools to train their employees to detect and report child abuse. Lastly, we discuss a new mandate related to school assessments. Though the Governor does not address the assessment mandate in his budget plan, the mandate has completed the state determination process and now has a statewide cost estimate.
Background
Constitution Requires the State to Reimburse Local Governments for Mandated Activities. Proposition 4, passed by California voters in 1979, requires the state to reimburse local governments for the cost of new programs and higher levels of service it imposes upon them. Under a process subsequently established in state law, the Commission on State Mandates (CSM) determines if a new law, regulation, or executive action constitutes a reimbursable state mandate for local governments. In the area of education, a local government is defined as a school district, COE, or community college district—collectively referred to as LEAs throughout this section. Although some state‑mandated activities also apply to charter schools, the CSM deemed these schools ineligible for reimbursement beginning in 2006.
State Budget Currently Recognizes 58 Education Mandates. As Figure 22 shows, the state budget currently recognizes 43 mandates that apply to K‑12 education and 15 that apply to community colleges. (Of these mandates, seven apply to both K‑12 education and community colleges.) The state has suspended 17 other education mandates (five that apply only to K‑12 education, five that apply only to community colleges, and seven that apply to both). LEAs are not required to perform the activities associated with suspended mandates and, consequently, the state is not required to reimburse them.
Figure 22
Education Mandatesa
|
K‑12 Education |
|
|
Active (43) |
|
|
Academic Performance Index |
Juvenile Court Notices II |
|
Agency Fee Arrangements |
Law Enforcement Agency Notificationc |
|
AIDS Prevention / Instruction I and II |
Notification of Truancy |
|
Annual Parent Notificationb |
Open Meetings/Brown Act Reform |
|
California State Teachers’ Retirement System Service Credit |
Parental Involvement Programs |
|
Caregiver Affidavits |
Physical Performance Tests |
|
Charter Schools I, II, III, and IV |
Prevailing Wage Rate |
|
Child Abuse and Neglect Reporting |
Public Contracts |
|
County Office of Education Fiscal Accountability Reporting |
Pupil Suspensions and Expulsions I and II |
|
Collective Bargaining |
Pupil Health Screenings |
|
Comprehensive School Safety Plans I and II |
Pupil Promotion and Retention |
|
Criminal Background Checks I and II |
Pupil Safety Notices |
|
Developer Fees |
Race to the Top |
|
Differential Pay and Reemployment |
School Accountability Report Cards I, II, III, and IV |
|
Expulsion of Pupil: Transcript Cost for Appeals |
School District Fiscal Accountability Reporting |
|
Financial and Compliance Audits |
School District Reorganization |
|
Graduation Requirements |
Teacher Notification: Pupil Suspensions/Expulsionsd |
|
Habitual Truants |
The Stull Act |
|
High School Exit Examination I and II |
Threats Against Peace Officers |
|
Immunization Records (includes Pertussis & Hepatitis B) |
Uniform Complaint Procedures |
|
Intradistrict Attendance |
Williams Case Implementation I, II, and III |
|
Interdistrict Attendance Permits |
|
|
Suspended (12) |
|
|
Absentee Ballots |
Mandate Reimbursement Process I and II |
|
Brendon Maguire Act |
Physical Education Reports |
|
County Treasury Withdrawals |
Pupil Residency Verification and Appeals |
|
Grand Jury Proceedings |
Removal of Chemicals |
|
Health Benefits for Survivors of Peace Officers / Firefighters |
School Bus Safety I and II |
|
Law Enforcement Sexual Harassment Training |
Scoliosis Screening |
|
Community Colleges |
|
|
Active (15) |
|
|
Agency Fee Arrangements |
Minimum Conditions for State Aid |
|
Cal Grants |
Open Meetings/Brown Act Reform |
|
California State Teachers’ Retirement System Service Credit |
Prevailing Wage Rate |
|
Collective Bargaining |
Public Contracts |
|
Community College Construction |
Reporting Improper Governmental Activities |
|
Discrimination Complaint Procedures |
Threats Against Peace Officers |
|
Enrollment Fee Collection and Waivers |
Tuition Fee Waivers |
|
Health Fee Elimination |
|
|
Suspended (12) |
|
|
Absentee Ballots |
Law Enforcement Jurisdiction Agreements |
|
Brendon Maguire Act |
Law Enforcement Sexual Harassment Training |
|
County Treasury Withdrawals |
Mandate Reimbursement Process I and II |
|
Grand Jury Proceedings |
Sex Offenders: Disclosure by Law Enforcement |
|
Health Benefits for Survivors of Peace Officers / Firefighters |
Sexual Assault Response Procedures |
|
Integrated Waste Management |
Student Records |
|
aMandates typically include only very specific activities associated with their name. bAlso includes Schoolsite Discipline Rules and Alternative Schools. cAlso includes Missing Children Reports. dAlso includes Pupil Discipline Records. |
|
CSM Recently Found Two New State Requirements to Be Mandates. First, the CSM determined a law requiring school districts and COEs to provide annual training on the detection and reporting of child abuse to be a mandate. Second, the CSM identified as a new mandate requirements for school districts and COEs to administer new computer‑based state exams in English language arts and math. The CSM recently released cost estimates for both mandates, thereby completing the mandate determination process.
State Traditionally Paid Mandates Through Claims Process. Under the state’s traditional mandate reimbursement process, LEAs submit claims for the actual cost of performing each mandated activity. The State Controller’s Office (SCO) pays claims from funds appropriated in the state budget. The SCO audits some claims and reduces payments accordingly.
State Went Many Consecutive Years Without Paying Claims, Large Backlog Mounted. The state deferred payments on education mandate claims for seven consecutive years—from 2003‑04 through 2009‑10. During this period, LEAs continued to submit claims, creating a large backlog of outstanding mandate claims.
Widespread Agreement Claims Process Has Serious Shortcomings. One of the most disconcerting aspects of the state’s traditional reimbursement method is that per‑student claims vary so greatly among every type of LEA. School district per‑student backlog claims (for all mandates combined) currently range from $1 to almost $11,000 and COEs’ per‑student claims range from $50 to almost $30,000. In addition to allowing vast differences in per‑student claims, the traditional reimbursement process provides no incentive for LEAs to perform activities as efficiently as possible. The traditional reimbursement process also has a high administrative burden, as LEAs must document specific costs and fill out associated reimbursement forms. Even after collecting and submitting receipts, LEAs subsequently can be audited by the state, and the SCO historically disallows many audited claims. Of K‑12 claims that the SCO determines to be high risk and subsequently audits, it disallows about 75 percent of claim costs.
State Has Made Significant Progress Towards Reducing the Backlog, but Sizeable Backlog Remains. As Figure 23 shows, the state has provided $5.9 billion for reducing the K‑14 mandates backlog since 2010‑11. Of this amount, $5.1 billion has been for the K‑12 backlog and $811 million for the community college backlog. After accounting for these payments, we estimate that the current K‑14 backlog is $1.3 billion—$1.1 billion for schools and $266 million for community colleges. (Our backlog estimate does not include $571 million in submitted claims associated with pending litigation, as we assume the state prevails in these cases.)
Figure 23
Funding for Education Mandates Backlog Since 2010‑11
(In Millions)
|
K‑12 Education |
Community Colleges |
Totals |
|
|
Budget Act |
|||
|
2010‑11 |
$187 |
$23 |
$210 |
|
2014‑15 |
400 |
50 |
450 |
|
2015‑16 |
3,205 |
632 |
3,837 |
|
2016‑17 |
1,281 |
106 |
1,387 |
|
Totals |
$5,073 |
$811 |
$5,884 |
State Created Mandates Block Grants as Alternative to Claims Process. To address concerns with the mandate claims process and provide a streamlined approach for reimbursing LEAs, the state created two mandates block grants in the 2012‑13 budget: a K‑12 block grant (for districts, charter schools, and COEs) and a community college block grant. The LEAs that choose to participate in these block grants receive per‑student funding to cover the cost of state‑mandated activities in lieu of submitting claims. Figure 24 shows the per‑student funding rates provided in the block grants. As the figure shows, the per‑student funding rate for K‑8 students is $28, with double that amount ($56) provided for high school students. The state elected to make charter schools eligible for block grant funding, but they receive half the K‑8 per‑student funding rates of school districts, as about half of K‑8 mandates apply to them. Similarly, about half of high school mandates apply to charter schools, but their grades 9‑12 rate is more than half the district rate due to the treatment of the High School Graduation mandate (which generates $28 per student for both charter schools and districts.) A COE receives funding for its direct students, as well as $1 for each K‑12 student in the county.
Figure 24
Rates Underlying Mandates Block Grants
|
2016‑17 |
Attendance Type |
Block Grant Rate |
|
School Districts |
K ‑ 8 |
$28 |
|
9 ‑ 12 |
56 |
|
|
Charter Schools |
K ‑ 8 |
$14 |
|
9 ‑ 12 |
42 |
|
|
COEs |
K ‑ 8 |
$28 |
|
9 ‑ 12 |
56 |
|
|
Countywide K‑12 |
1 |
|
|
Community Colleges |
FTE student |
$28 |
|
LEA = local education agency; COE = county office of education; and FTE = full‑time equivalent. |
||
Near Universal Participation in Block Grant. The two block grants have very high participation rates. In 2016‑17, 95 percent of school districts, 95 percent of charter schools, 95 percent of COEs, and all community college districts participated in the block grant. These participation rates reflect modest increases for all LEA types compared to 2015‑16. Currently, LEAs participating in the block grants account for 99 percent of K‑14 attendance statewide.
Block Grants Include Funding for All Mandates Recognized in State Budget. Currently, all mandates recognized in the state budget are included in the block grants. The K‑12 block grant totals $219 million for its 43 mandates, whereas the community college block grant totals $32 million for its 15 mandates.
Mandates Backlog
Governor Proposes $287 Million Payment Toward K‑12 Backlog. The Governor proposes to make a one‑time payment of $287 million toward the K‑12 backlog, but he does not provide funding for the community colleges backlog. Consistent with many previous backlog payments made by the state, the Governor proposes to distribute funding on the basis of ADA. Because the payments would be made for expenses incurred by LEAs many years ago, the funds provided today effectively could be used for any purpose. The Governor suggests school districts, charter schools, and COEs use the payments for content standards implementation, professional development for teachers, or deferred maintenance.
Proposal Treats All LEAs Similarly, Provides Incentives to Control Mandate Costs. Paying down the backlog on a per‑student basis means that all LEAs receive funding, regardless of their past mandate claiming practices. This ensures that LEAs are not disadvantaged if they did not submit claims in the past due to the complexity of the claiming process or if they performed mandated activities at a lower cost compared to other LEAs. The per‑student approach also reduces the incentive for LEAs in the future to inflate claims or perform state‑mandated activities in an unreasonably costly manner.
Majority of Payments Would Not Reduce Backlog. Because the Governor proposes to distribute funding to school districts and COEs with no unpaid claims (either due to a lack of filing or full repayment by prior backlog payments), these payments would not reduce the backlog. In addition, the Governor proposes to distribute funding to charter schools, which are ineligible to submit mandate claims and therefore do not have a mandates backlog. As Figure 25 shows, we estimate the $287 million payment would reduce the K‑12 backlog by only $102 million, from $1.1 billion to $964 million.
Figure 25
Estimates of Outstanding K‑12 and CCC Mandates Backlogs
(In Millions)
|
K‑12 Education |
Community Colleges |
Total |
|
|
2016‑17 Backloga |
$1,067 |
$266 |
$1,332 |
|
Governor’s Proposalb |
$287 |
— |
$287 |
|
Payment towards backloga |
(102) |
— |
(102) |
|
Remaining fundinga |
(185) |
— |
(185) |
|
2017‑18 Backloga |
$964 |
$266 |
$1,230 |
|
aLAO estimates. bFrom settle‑up payments. Allocated to all local education agencies, with and without unpaid claims, on a per‑student basis. |
|||
Serious Concerns With Lack of Plan to Retire Mandates Backlog. The Governor’s proposal makes some further progress towards fulfilling the state’s constitutional requirement to reimburse LEAs for the activities it mandates of them. The per‑student funding approach taken by the Governor, however, is exceptionally costly. In the long term, if the state were to continue this approach to retire the entire backlog, we estimate it would cost $179 billion—over 100 times more than the backlog. We recommend the Legislature consider a more strategic approach to retiring the mandate backlog, such as the one we outlined last year in our 2016‑17 Proposition 98 Education Analysis. Our approach retains a positive feature of the Governor’s plan—making payments on a per‑student basis—and it avoids the greatest negative feature of the Governor’s plan—its astronomical cost—by more narrowly targeting funding. Most notably, our recommended plan reduces costs by requiring schools to write‑off all unpaid mandate claims as a condition of receiving payment.
Training on Child Abuse Detection and Reporting Mandate
Below, we provide background on the child abuse detection and reporting mandate, describe the Governor’s proposal to add the mandate to the K‑12 mandates block grant, assess the proposal, and make an associated recommendation.
Background
School Employees Required to Report Child Abuse. In 1980, the Legislature enacted Chapter 1071 of 1980 (SB 781, Rains), which requires individuals in certain professions (who are referred to as “mandated reporters”) to report child abuse and neglect to specific law enforcement agencies or county welfare departments. School staff, including teachers and other employees, are among these mandated reporters. The legislation makes failure to report abuse or neglect a misdemeanor, punishable by up to six months of jail time and/or a $1,000 fine. While placing a reporting requirement on school employees, the legislation did not require schools to train staff members in the detection and reporting of abuse.
State Creates New Law Requiring Training in Abuse Detection and Reporting. In 2013, a Bay Area news organization surveyed school districts and found that only 31 percent conducted annual trainings in how to identify and report child abuse. The news organization conducted the survey after finding several instances of school staff failing to report abuse. In response to these concerns, the Legislature enacted Chapter 797 of 2014 (AB 1432, Gatto). This legislation built on the 1980 law by requiring districts to train virtually all staff in how to detect and report child abuse. School districts, charter schools, COEs, and state special schools are now required to administer these trainings within the first six weeks of the school year or the first six weeks of a newly hired individual’s employment. The law requires the California Department of Social Services to develop an online training module for use by schools, but schools also may develop their own training materials if they submit these materials to the California Department of Education.
CSM Determines New Requirements to Be Reimbursable Mandate. The CSM determined in 2015 that the new training and reporting requirements constitute a reimbursable mandate. Specifically, CSM found that schools are required to perform the following activities for nearly all employees: (1) provide annual child abuse and neglect training (detailing how to identify abuse, report abuse, and the penalties for failing to report it); (2) provide written proof to the school’s governing board that staff completed the training; and (3) report to the California Department of Education the training material used if not using the state’s online training module. The CSM determination allows school districts and COEs to claim reimbursement for these activities effective January 1, 2015.
CSM Estimates Statewide Mandate Costs of $40.5 Million Ongoing. The CSM’s estimate of ongoing statewide costs consists of $32.4 million for employee training, $5.4 million for reporting to CDE, and $2.7 million for indirect costs such as personnel services. (The CSM also estimates one‑time costs in 2014‑15 of $13.5 million for developing a process to record proof of training.) The CSM calculated the costs of employee training by identifying the total number of school employees statewide (589,320), the average compensation of school employees ($55 per hour), and the average amount of time required to complete the training (one hour). It calculated the costs of reporting to CDE and indirect costs based on claims submitted by 19 districts. Specifically, CSM found from these claims that these two activities comprised 20 percent of total ongoing costs. (Due to a math error, CSM inadvertently published its ongoing statewide cost estimate as $43.5 million, rather than $40.5 million.)
Governor’s Proposal
Adds Mandate and $8.5 Million to the K‑12 Mandates Block Grant. The Governor proposes to increase the K‑12 block grant by $8.5 million (4 percent) to account for the new mandate. His proposed increase is equal to 20 percent of CSM’s published ongoing statewide cost estimate of $43.5 million. The Governor bases his 80 percent reduction on a historical precedent for adding another mandate to the block grant. Specifically, the administration cites the 2013‑14 budget’s provision of $50 million to add the High School Graduation Requirement mandate to the block grant, even though annual ongoing claims for this mandate totaled approximately $250 million.
Assessment
Mandate Serves a Compelling State Interest. Properly identifying child abuse and neglect is a first step for helping to improve a child’s welfare. School staff have significant contact with children and therefore are well positioned to detect and report abuse and neglect. Properly detecting and reporting abuse, however, presumably requires some training, and, prior to being mandated, many districts were not providing such training. For these reasons, we believe that the mandate serves a compelling state interest.
Assessing Actual Effects of Mandate Difficult Due to Data Limitation. According to the California Child Welfare Indicators Project (a collaboration between the University of California at Berkeley and the California Department of Social Services), the number of child abuse and neglect cases reported to the department increased from 325,000 in 2014 to 332,000 in 2015 (the year the mandate took effect). This increase, however, is the continuation of a trend occurring prior to the mandate’s enactment. Moreover, information is not readily available to ascertain whether the increase is due to the mandate or other factors that might cause the number of child abuse reports to rise.
Governor’s Proposal Underfunds Mandate’s Costs Without Justification. The Governor cites historical precedent as the rationale for underfunding the mandate. The one case he cites is unusual. The High School Graduation Requirement mandate was litigated between the state and schools over the course of more than two decades. The state reduced funding for this mandate when adding it to the block grant because it felt, even though the courts upheld the requirement to be a state reimbursable mandate, that the mandate did not impose new costs on schools. By contrast, the training on child abuse detection mandate has not been subject to any dispute between the state and schools. For this reason, we believe the Legislature should fund its full costs.
Actual Costs of Mandate Close to CSM Estimate. Our review of CSM’s cost estimate identified some shortcomings. For example, its estimates did not properly account for the number of nonteaching staff, the costs of providing mid‑year training to newly hired staff, and the hourly rate of school employees. After adjusting for these shortcomings, however, we estimate only a slightly different amount than CSM—$41.9 million. This is because some of our adjustments resulted in higher costs but these were largely offset by other adjustments that resulted in lower costs.
Recommendation
Add Mandate and $41.9 Million to the K‑12 Mandates Block Grant. Because the mandate serves a compelling statewide purpose, we recommend adopting the Governor’s proposal to add it to the block grant. We recommend, however, increasing the block grant by $41.9 million—$33.4 million more than proposed by the Governor—to accurately reflect the costs of the mandate. This would increase the block grant per‑student funding rates by $7 for school districts, charter schools, and COEs.
CAASPP Mandate
Below, we provide background on a new mandate relating to the state’s assessment system, formally known as the California Assessment of Student Performance and Progress (CAASPP). We then analyze the mandate to determine how best to adjust the K‑12 mandates block grant.
Background
California Adopted New Standards and Joined Testing Consortium in 2010. Seven years ago, California adopted the Common Core State Standards in English Language Arts and math for kindergarten through twelfth grade. The standards were developed by the National Governor’s Association and Council of Chief State School Officers, in consultation with education experts, with the intent to better prepare all students for college and career. In September 2010, as part of its Race to the Top Assessment Program, the federal government awarded $330 million to two consortia to develop assessments aligned to the new standards. California is a member of the Smarter Balanced Assessment Consortium (SBAC), which received $160 million to develop new exams for students in grades 3 through 8 and grade 11.
New Tests Require Devices and Internet Connection. The tests developed by SBAC require a computing device—a tablet, desktop computer, or laptop computer—that is connected to the Internet. (The other consortium funded by the federal government, Partnership for Assessment of Readiness for College and Careers, or PARCC, developed an exam that is computer‑based but does not require an Internet connection.) Each spring, schools have a 12‑week window to administer the test to students in grades 3 through 8 and a seven‑week window for grade 11. To ease the transition to the new system, schools can administer a pencil and paper version of the test during the first three years of implementation but must use the online version by spring 2018.
State Required Schools to Administer New Exams Beginning Spring 2014. Chapter 489 of 2013 (AB 484, Bonilla) codified into state law many requirements based on SBAC. Chapter 489 also directed schools to administer a trial run of the online version of the SBAC tests in spring 2014, if possible. (No paper and pencil version of the trial test was available.) Because it was a trial, test results were not reported for accountability purposes. The trial test was intended to help schools transition to the new standards and give them an opportunity to determine their technology needs before administering the first official tests in spring 2015. The state’s standards‑based assessments—including the SBAC exams, science assessments, alternate assessments for students with disabilities, and a standards‑based test in Spanish—are collectively known as the CAASPP.
State Has Provided Substantial One‑Time Funding to Help Schools Implement New Standards and Tests. The 2013‑14 budget plan provided $1.25 billion for professional development in aligning instruction to the new standards, purchasing aligned instructional materials, and acquiring the technology required to implement the SBAC exams. Of the $1.25 billion provided, school districts reported spending $577 million on technology, including $400 million on devices and accessories and $98 million on technology infrastructure. In 2014‑15, the state provided $401 million that schools could use for any purpose, including implementing the new standards and tests. (School districts with outstanding mandate claims had this funding applied to those claims.)
State Also Provided Special Grants for Improving Internet Infrastructure. To address concerns with some schools potentially not having Internet bandwidth sufficient for administering the SBAC exams, the state provided $77 million over two years (2014‑15 and 2015‑16) for Broadband Infrastructure Improvement Grants (BIIG). Schools eligible to benefit from a BIIG grant either had to have been unable to administer the trial test on‑site due to low Internet capacity or had to shut down other core online activities (such as e‑mail) in order to administer the test. As a condition of receiving funds, schools were required to commit to the ongoing costs associated with the new Internet connections. If any BIIG funding remained after helping these schools, then BIIG grants could be provided to other schools to increase their Internet speeds. The state has funded more than 400 school sites. As of December 2016, the state has identified only five schools that do not have the Internet speeds to administer the exam.
State Provides Annual Funding for Costs of Administering Standardized Tests. The 2016‑17 Budget Act included $23.2 million to cover the costs of administering the state’s standardized assessments. These funds, which have been provided annually since the previous set of state standardized exams, are distributed to school districts based on per‑student rates set by SBE for each exam. In 2016, schools received $4 for each student who took at least one SBAC exam during the previous year (costing $12.8 million statewide). For the prior English language arts and math exams, SBE provided $2.52 per student. These funds are intended to cover costs such as training test site coordinators and proctors, as well as sharing certain student demographic data with the state’s testing contractor.
CSM Determines Minimum Technology Requirements to Be Reimbursable Mandate. In 2016, the CSM determined that compliance with the minimum technology requirements of the new exams constituted a reimbursable mandate. Reimbursable costs include purchasing computing devices and maintaining Internet service sufficient to administer the exams within the testing window. Specific related costs include acquiring and installing network equipment and hiring consultants or engineers to assist districts in proper installation. School districts are required to maintain supporting documentation demonstrating that their prior inventory was insufficient to administer the new tests to all eligible pupils within the testing window. Reimbursement for fixed costs, such as devices or networking equipment, is to be prorated based on the share of use associated with mandated activities. If, for example, half of a computer’s usage is for administering exams, then schools can be reimbursed for only half of the computer’s cost.
CSM Also Declares Other Associated Activities a Mandate. The CSM also determined that certain administrative requirements for the SBAC exams exceeded the requirements under previous exams. These other reimbursable costs include ongoing monitoring of computing devices and Internet speeds to ensure they meet minimum requirements, scoring and transmitting tests, reporting additional test‑related information to the state’s testing contractor or CDE, notifying parents that their children are not required to take the assessments, and reviewing training materials and documents related to administering the exams.
Several Funding Sources Deemed Offsetting. In its ruling, CSM required districts to identify specific funding sources as offsetting their mandates claims. For the two largest one‑time funding sources—the $1.25 billion in 2013‑14 and $401 million in 2014‑15—the funding offsets districts’ claims if used for the mandated activities. In addition, CSM requires districts to count all of the $77 million in BIIG funding and annual state apportionments for test administration as offsetting.
CSM Receives Roughly $70 Million in CAASPP Claims for Each of First Two Years. For 2013‑14, 197 LEAs (a mix of school districts and COEs) identified $87 million in costs associated with the mandate and $13 million in revenue offsets. For 2014‑15, 230 school districts and COEs submitted costs totaling $77 million and $11 million in revenue offsets. Of the total reimbursable costs identified across the two years, 62 percent was for computing devices and accessories, 30 percent for Internet services, and 8 percent for all other requirements. Although complete data for 2015‑16 is not yet available, the CSM estimates 2015‑16 net costs to be $77 million. This estimate is based on data from the 170 LEAs that submitted claims both years, and a projection of the number of claims that will be submitted by LEAs with no prior claims. (The CSM did not use this available claims data to extrapolate a statewide cost estimate assuming all LEAs incurred associated costs.)
Assessment
Submitted Claims Likely Overstate Ongoing Cost of Mandate. Based on our review of CSM’s ruling and available claims data, we believe the claims submitted by LEAs overstate the ongoing costs of the mandated activities. Below, we discuss our concerns with the claims data and provide an alternative estimate of the ongoing costs of the CAASPP mandate.
Virtually All Schools Meet Minimum Internet Speed Requirements. One concern we have with the claims data is that LEAs appear to be seeking reimbursement for costs that exceed the minimum Internet speed requirements. To minimize the financial burden of the new exams, SBAC set its associated technology requirements low compared to existing technology standards. With regards to connectivity, schools must have a minimum Internet speed of 20 kilobits per second (Kbps) for each student being tested simultaneously. (Internet speeds are measured by the number of “bits,” or units of data, transmitted per second.) This minimum standard is low compared to speeds currently available in schools. In 2014, a survey with responses from 96 percent of California schools found 99 percent of schools had speeds greater than 1.5 megabits per second (mbps)—sufficient to test 75 students at one time. (The median school’s Internet speed—100 mbps—is sufficient to test 5,000 students at one time.) Those schools that did not meet current Internet speeds could receive state aid through BIIG. For these reasons, virtually no school at this point should need faster Internet speeds to administer the SBAC tests.
Claims for Device Costs Also Likely Exceed Minimum Standards. The SBAC’s minimum requirements for computing devices also are relatively low compared to current technology standards. For example, through the end of 2019‑20, schools can administer SBAC exams using computers running Windows 7, an operating system first released to the public in 2009. With such minimal requirements, schools should be able largely to use their existing computers to administer the exams. The state also has eased the technology requirements by allowing for a relatively long testing window (12 weeks for grades 3 through 8, 7 weeks for grade 11), thereby reducing the number of computing devices needed. A high school with 500 11th graders, for example, could administer all exams within the 7‑week testing window at no additional cost if it has one existing computer lab that can accommodate 30 students at a time. Because of these low minimum standards, we think the mandate claims submitted significantly overstate costs.
Estimate Average Annual Device Cost of Roughly $13 Million. We estimate statewide annual costs of roughly $13 million for devices sufficient to meet minimum standards. This estimate is based on several key assumptions. We assume (1) schools currently have one computer available for every 50 students tested, (2) schools administer tests throughout the entire testing window, and (3) purchased devices have a lifespan of three years and are used about one‑third of the time for non‑testing purposes. (Though we believe this package of assumptions is reasonable, one alternatively could assume a shorter testing period but longer device life span and more usage for more testing purposes.)
Estimate Annual Cost of Other Activities at Roughly $12 Million. For 2014‑15, LEAs submitted claims for the other claimable costs equivalent to $4 per student. We expect these particular costs to decrease over time as schools become more familiar with the new testing requirements. In future years, staff will need to be informed of changes to the testing system but will not be required to learn a completely new system. Activities such as scoring and reporting data also will require less time as staff become familiar with the required procedures. For these reasons, we assume the ongoing per‑student cost would be roughly half the cost in the initial years ($2 rather than $4 per student). Applying this rate statewide yields a total cost of about $12 million.
Recommendations
Add Mandate and $25 Million, Along With Shifting Associated Apportionment Funding, Into the K‑12 Mandates Block Grant. We recommend adding the CAASPP mandate to the K‑12 mandates block grant. In tandem, we recommend increasing the block grant funding by $37.8 million. Of this amount, $25 million reflects our estimate of the annual ongoing costs associated with the new mandated activities. The remainder ($12.8 million) reflects a shift of the related assessment apportionment funding. This shift would be a conforming action to consolidate all funding related to the new assessments into the block grant, thereby making for more transparent budgeting. To derive the new per‑student block grant funding rates, we recommend increasing the K‑8 rate more than the high school rate, as five grades in the K‑8 grade span are tested whereas only one high school grade (eleventh) is tested. Assigning the rates proportionately, we recommend increasing the K‑8 block grant funding rate by $8 per student and the high school rate by $3 per student.
Back to the TopPension Costs
In this section, we provide background on school district pension costs, compare LCFF funding increases with pension cost increases over the past few years, project these increases for 2017‑18 and the next few years, and discuss how the cost increases likely are affecting different types of school districts. The section focuses on both the California State Teachers’ Retirement System (CalSTRS), which administers retirement programs for teachers, administrators, and other certificated staff, and the California Public Employees’ Retirement System (CalPERS), which administers retirement programs for classified school personnel such as paraprofessionals and maintenance staff.
Background
State Approved Plan in 2014‑15 to Address CalSTRS’ Unfunded Liability. At the end of 2013‑14, CalSTRS estimated that its main investment fund was more than $70 billion short of the amount needed to pay for benefits earned through that date. This shortfall is referred to as an unfunded liability. Chapter 47 of 2014 (AB 1469, Bonta) included a plan to pay down the unfunded liability within about 30 years. Under the plan, district contributions as a share of payroll increase from 8.25 percent in 2013‑14 to 19.1 percent in 2020‑21. The plan also increased state contributions from 5.2 percent in 2013‑14 to 10.6 percent in 2020‑21. The final component of the plan increased contribution rates for most teachers from 8 percent in 2013‑14 to 10.25 percent in 2016‑17. (CalSTRS estimates that teachers hired after January 1, 2013 will pay 10.21 percent beginning in 2017‑18.) The top part of Figure 26 summarizes the changes in district and state contribution rates. The state rates shown in the figure reflect CalSTRS’ February 2017 decision to change some of its key assumptions, including lowering its investment return assumption from 7.5 percent to 7 percent over the next few years.
Figure 26
K‑12 Pension Contribution Rates and Amounts
(Dollars in Millions)
|
2013‑14 |
2014‑15 |
2015‑16 |
2016‑17 |
2017‑18 |
2018‑19 |
2019‑20 |
2020‑21 |
|
|
Contribution Ratesa |
||||||||
|
CalSTRS |
||||||||
|
School Districts |
8.3% |
8.9% |
10.7% |
12.6% |
14.4% |
16.3% |
18.1% |
19.1% |
|
Stateb |
5.2 |
5.7 |
7.1 |
8.6 |
9.1 |
9.6 |
10.1 |
10.6 |
|
Totals |
13.5% |
14.6% |
17.9% |
21.2% |
23.5% |
25.9% |
28.2% |
29.7% |
|
CalPERS |
||||||||
|
School Districts |
11.4% |
11.8% |
11.8% |
13.9% |
15.8% |
18.7% |
21.6% |
24.9% |
|
Contribution Amounts |
||||||||
|
CalSTRS |
||||||||
|
School Districts |
$2,090 |
$2,280 |
$2,970 |
$3,622 |
$4,403 |
$5,216 |
$6,027 |
$6,587 |
|
Stateb |
1,360 |
1,486 |
1,935 |
2,473 |
2,787 |
3,060 |
3,319 |
3,589 |
|
Totals |
$3,450 |
$3,766 |
$4,905 |
$6,095 |
$7,190 |
$8,277 |
$9,346 |
$9,177 |
|
CalPERS |
||||||||
|
School Districts |
$993 |
$1,035 |
$1,132 |
$1,421 |
$1,665 |
$2,101 |
$2,415 |
$2,867 |
|
Total District Contributions |
$3,083 |
$3,315 |
$4,103 |
$5,043 |
$6,069 |
$7,318 |
$8,442 |
$9,455 |
|
aChapter 47 of 2014 (AB 1469, Bonta) phased in annual CalSTRS rate increases for teachers, districts, and the state. District contribution rates for CalSTRS are set in statute through 2020‑21. Other contribution rates are actuals through 2016‑17 and projections thereafter. Future rates will differ based on investment returns and changes in actuarial assumptions and policies. bIncludes roughly 2.5 percent contribution to a program that protects retirees’ benefits from the effects of inflation. |
||||||||
CalPERS Also Is Increasing District Rates to Address Unfunded Liability. Similar to CalSTRS, CalPERS also has an unfunded liability. In recent years, the CalPERS board has taken action to address this unfunded liability by increasing district contribution rates (along with the rates that apply to many other state and local agencies participating in CalPERS). As Figure 26 shows, the latest actuarial estimates suggest that district contribution rates will increase from 11.4 percent in 2013‑14 to 24.9 percent by 2020‑21. Compared with the previous estimates released by CalPERS, the district contribution rates are nearly 4 percentage points higher by 2020‑21. This increase equates to about $500 million in higher contributions and is due largely to the adoption of less optimistic investment assumptions. Specifically, CalPERS recently decided to lower its assumed annual investment return similar to CalSTRS.
Trends Through 2016‑17
State and District Contributions Have Increased Over Past Three Years. The bottom half of Figure 26 displays our estimate of the annual amount school districts and the state are contributing toward pension costs. In 2016‑17, school district contributions for CalSTRS and CalPERS totaled $5 billion, an increase of $2.9 billion (64 percent) over the 2013‑14 level. By comparison, state CalSTRS contributions totaled $2.5 billion in 2016‑17, an increase of $1.1 billion (82 percent) over the 2013‑14 level. The higher percentage increase for the state is related to the legislation implementing the CalSTRS funding plan, which initially increased the state’s contribution relatively quickly and school district contributions more slowly.
LCFF Funding Increases Have Been Significantly Higher Than Total School District Pension Cost Increases. Figure 27 compares the annual increase in districts’ combined CalSTRS and CalPERS costs with annual increases in LCFF funding. For each of the last three years, LCFF funding has increased significantly more than pension costs. Over the three years combined, LCFF funding increased by about $14 billion, compared with higher pension costs of about $2 billion. Pension cost increases equated to about 15 percent of LCFF growth over this period.
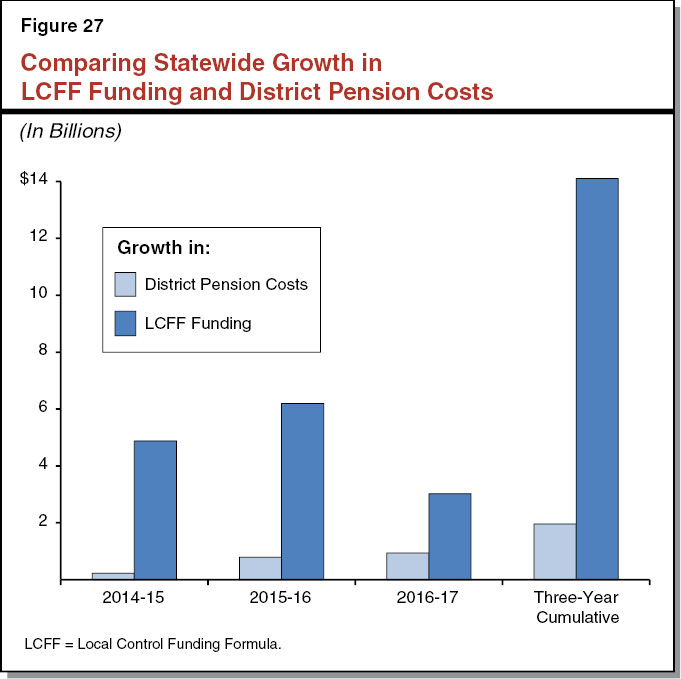
Questions About the Experience of Individual Districts. Though LCFF funding has outpaced pension costs on a statewide basis, some legislators and school groups have asked whether certain districts are experiencing pension cost increases greater than the growth in their funding. These questions tend to arise because the funding increases under LCFF are weighted toward districts with relatively high numbers of low‑income students and English learners, whereas the higher pension rates apply to all districts. Determining how many districts are affected this way is difficult because districts make different decisions about salaries and staffing levels. These decisions, in turn, affect payroll and the amount districts pay for pension costs. For our analysis, we developed a cost simulation that began with each district’s 2013‑14 payroll and pension contribution amounts. We then accounted for the pension contribution rate increases that have occurred over the past three years. Next, to account for inflationary pressures, we assumed payroll grew 3 percent per year. Changing our payroll growth assumption up or down by a few percentage points did not notably change our results.
Some Districts Likely Have Seen Pension Costs Grow More Quickly Than LCFF Funding. Under these assumptions, 7 percent of non‑basic aid districts would have seen their pension costs increase by more than their LCFF increase from 2013‑14 through 2016‑17. The districts in this category tend to be very small—jointly representing less than 1 percent of statewide attendance—and were historically advantaged in terms of state funding. Specifically, these districts average around 200 ADA, compared to 6,200 ADA for all other districts. They received a large amount of categorical funding in 2012‑13—about $5,000 per ADA on average, compared to $1,300 for all other districts. They also receive a large share of their LCFF funding through the necessary small schools (NSS) allowance—20 percent on average. Districts with large amounts of categorical and NSS funding tended to start 2013‑14 very close to, or already at, their LCFF target and thus experienced relatively slow or no LCFF growth in recent years. To accommodate the higher contribution rates, these districts likely had reduce other areas of their budgets. (We excluded basic aid districts from this analysis because their funding is affected primarily by changes in property tax revenue rather than LCFF.)
Pension Cost Increases a Much Smaller Share of LCFF Funding Increases in Most Other Districts. Under our assumptions, about four in five districts would have seen pension cost increases equating to less than 20 percent of their LCFF funding increases. These districts generally started 2013‑14 far below their LCFF targets and have experienced correspondingly higher funding increases as the state has made progress toward implementing LCFF.
2017‑18 and Out‑Year Analysis
LCFF Funding Increase in 2017‑18 Smaller Than Total School District Pension Cost Increases Projected for That Year. Compared with their experience the past three years, districts are likely to find pension rate increases more challenging to accommodate in 2017‑18. Total district pension contributions are expected to increase by about $1 billion ($782 million for CalSTRS and $244 million for CalPERS). These cost increases compare to the $744 million proposed augmentation for LCFF under the Governor’s budget. Thus, the average district would have to redirect some of its existing resources to cover the pension‑related costs in excess of its LCFF increases.
Not All Districts Likely to Be Affected to the Same Extent. Similar to the past few years, the effect of any LCFF augmentation in 2017‑18 will vary according to district circumstances. Districts with relatively high numbers of low‑income students and average and below average historical funding rates will receive larger LCFF funding increases than other districts, such that their LCFF funding likely will continue to outpace growth in pension costs. These districts, however, face greater expectations for increasing and improving services for their low‑income students. These districts likely will experience some tension in deciding how to accommodate these two cost pressures. Compared to districts with high numbers of low‑income students, more affluent districts will receive relatively small LCFF funding increases and might need to make budget reductions to accommodate higher pension costs. In addition to being affected differently based on their student demographics, districts differ in the extent to which they incorporated higher pension costs into previous budget planning. Districts that set aside funds in their reserves and increased programs more slowly in previous years likely will have less difficulty accommodating higher pension costs in 2017‑18. In contrast, districts that dedicated the bulk of their additional LCFF funding the past three years to program expansion are likely to experience more difficulty maintaining their higher levels of service in 2017‑18.
LCFF Funding Projected to Grow More Quickly Than Pension Costs Over Seven‑Year Implementation Period. Growth in district pension costs beyond 2017‑18 will depend upon many factors, including district decisions about salaries and programs, as well as state‑level decisions about pension contribution rates and investment assumptions. Growth in Proposition 98 funding also will depend upon various factors—primarily changes in General Fund revenue, per capita personal income, and K‑12 attendance. We examined the relative growth in costs and funding from 2013‑14 through 2020‑21 under two simulations. The simulations are based upon two economic scenarios we developed for our November 2016 fiscal projections. Under our economic growth scenario, total K‑12 Proposition 98 funding in 2020‑21 would exceed the 2013‑14 level by $22 billion. Under this scenario, the $6.4 billion increase in pension costs over the same period equates to about 30 percent of the increase in school funding. Under our mild recession scenario, the increase in school funding would be $17 billion, with the $6.4 billion increase in pension costs equating to nearly 40 percent of the funding increase. (Many other scenarios—both stronger than our growth scenario and weaker than our recession scenario—are possible over this period.)
Key Considerations
Addressing Unfunded Pension Liabilities Is Critical. Despite the significant fiscal pressure imposed by higher pension costs, addressing unfunded CalSTRS and CalPERS liabilities is critical. Whereas CalSTRS had estimated that it would run out of assets by the mid 2040s, the funding plan approved in 2014 places the system on a trajectory to reach full funding within about 30 years. Similarly, the rate increases approved by CalPERS will reduce that system’s unfunded liabilities over time. Though school districts and the state are both paying more to fund the two systems over the next several years, the result in both cases will be lower costs over the long term and more sustainable pension systems moving forward.
By Prioritizing General Purpose Funding, State Can Help Districts Accommodate Higher Costs. Given the scheduled rate increases, pension costs will be a key factor in district budgets for many years to come. One way the state can help districts manage these increases is to continue allocating Proposition 98 funds through general purpose grants like LCFF and mandate backlog payments. Allocating funding in this way provides districts the flexibility to make difficult trade‑offs in ways that reflect local priorities. In contrast, creating new or expanding existing state categorical programs makes balancing district budgets more difficult, as funds get tied up for specific state purposes that might not align well with every districts’ local priorities and budget‑balancing strategies.
Back to the TopSchool Facilities
In this section, we provide background on state funding for school facilities and discuss the Governor’s proposed school facility bond sales and his related audit proposal.
Background
School Facilities Program (SFP) Was Created Nearly Two Decades Ago. Chapter 407 of 1998 (SB 50, Greene) created the SFP. The underlying tenet of the program is that the state and school districts share the cost of building new school facilities and modernizing old ones. The state generally contributes 50 percent of new construction costs, including the purchase of land, working drawings, and construction of new facilities. The state typically contributes 60 percent of modernization costs for the renovation of facilities at least 25 years old. For both types of projects, the state can contribute up to 100 percent of project costs if districts face challenges in raising their local shares. Schools submit applications for state funding to the Office of Public School Construction (OPSC). The OPSC then brings eligible applications to the State Allocation Board for approval on a first‑come, first‑served basis.
Virtually No State Funding Has Been Available for Program Since 2012. The state funded the SFP with a series of four voter‑approved general obligation bonds between 1998 and 2006 that together provided $35.4 billion. By 2012, the state effectively exhausted funding from these bonds. After running out of funding, the state kept a list of board‑approved applications awaiting funding (known as the “unfunded list”) and another list of applications received but not yet reviewed by OPSC (known as the “acknowledged list”). The unfunded list currently totals $370 million and the acknowledged list totals $2 billion. As the state ran out money for the program, it also decreased OPSC staffing notably, from a historical average of around 130 positions to around 50 positions today. Figure 28 shows changes in OPSC staffing since the establishment of the SFP.
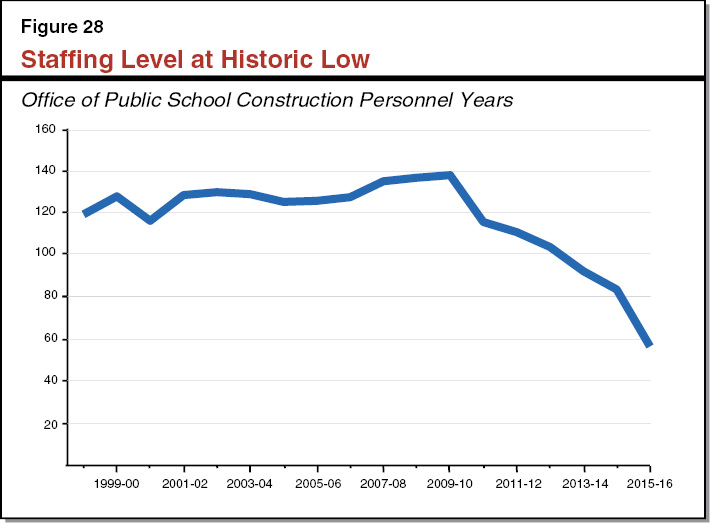
New State Bond Approved in 2016. Proposition 51 was approved by voters in November 2016. It authorizes the state to sell $7 billion in general obligation bonds for K‑12 school facilities projects (in addition to $2 billion for community college projects). Of the $7 billion, $3 billion is for new construction projects, $3 billion is for modernization projects, and the remaining $1 billion is split evenly between charter school and career technical education projects. Proposition 51 specifies that the state must spend the bond funds in accordance with the SFP.
Bond Sales
State Generally Times Bond Sales to Match Project Schedules. To minimize interest payments (which begin accruing once a bond is sold), the state typically sizes its bond sales to match the amount of funding required for projects that are “shovel ready.” For school facilities, requests for bond funding are linked to the volume of applications submitted to OPSC and the speed with which OPSC can review them and present them to the State Allocation Board for approval.
Bulk of Last School Bond Sold Over Six Years. The state’s last school bond was Proposition 1D (2006), which provided $7.3 billion for school facilities. The state sold $6.1 billion (84 percent) of Proposition 1D bonds within six years of its passage. Bond sales ranged from $344 million to $1.9 billion per year. During these six years, the state also was selling bonds from prior voter measures. For example, in 2007‑08, the state sold $344 million in Proposition 1D bonds but another $1.5 billion from prior bonds, for a total of $1.8 billion.
Governor Proposes to Issue $655 Million in School Bonds in 2017‑18. This amount consists of $594 million from Proposition 51 bonds and $61 million from prior bonds. The administration states that its proposal is based on the size of the unfunded list and how many applications it believes OPSC can process from the acknowledged list with its current staffing level. (The Governor proposes no change to OPSC’s staffing levels.) Though required by state law, the Governor did not provide an out‑year schedule of anticipated school bond sales in his five‑year statewide infrastructure plan. The Governor also requires new accountability measures be put in place prior to issuing the bonds, which we discuss in the next section.
Governor’s Proposed Issuance Insufficient to Address Backlog of Facility Funding Requests. Though the Governor’s $655 million proposal would clear the $370 million in already approved school projects awaiting funding, it leaves only $285 million left to address the $2 billion in projects on the acknowledged list. Moreover, new applications continue to come in, with OPSC reporting receiving $158 million in new applications in the first two months after Proposition 51 was approved by voters. (These applications are included in the $2 billion backlog figure.) If OPSC continued to receive new applications at this pace, the backlog of projects on the acknowledged list would grow to $3.1 billion by January 2018, assuming no projects receive funding in the interim. (We asked about the volume of projects on the acknowledged list that historically is approved, but OPSC indicates it does not collect this information.)
No Staffing Analysis to Support Governor’s Proposal. The administration states that its proposal is based on how many applications it believes OPSC can process with its current staffing level, but it was not able to provide any corresponding staffing analysis. The Governor’s proposal also does not consider the OPSC staffing level appropriate to address the large backlog of projects.
Placing Conditions on Bond Sales Raises Concerns. The Governor indicates he will not sell Proposition 51 bonds until the accountability changes discussed in the next section are implemented. If the Governor were to withhold Proposition 51 bond sales indefinitely, however, the state could be challenged in court, as voters indicated through the passage of the measure that they wish to see the bonds sold.
Recommend Directing Administration to Provide Additional Information at Spring Hearings. We recommend the Legislature use its budget hearings to gather more information from the Department of Finance on how the administration plans to address the backlog of school facility projects and size and time the associated Proposition 51 bond sales. We recommend the Legislature also ask OPSC to report at hearings how many applications it can process per personnel year and how many applications it likely could process with its current staffing level. After the Legislature determines its desired amount of statewide school facilities funding for 2017‑18, it then could use OPSC’s staffing analysis to set an appropriate staffing level moving forward.
Expenditure Audits
State Requires Local Independent Audits of Certain School Records and Expenditures. The state requires schools to hire independent auditors to verify various school records, such as attendance data, and to determine whether certain expenditures, such as for energy efficiency projects, are spent in accordance with state law. The independent auditors report their findings to local school boards and the State Controller’s Office.
OPSC Conducts Audits of SFP Expenditures. State law requires districts to submit annual summary reports of state facility expenditures to OPSC. The office may choose to audit these reports, though this is not required. Currently, OPSC reviews only a subset of projects, generally those deemed to be higher risk, based on factors such as the size of the project. If OPSC finds ineligible expenditures, the State Allocation Board can seek to have the funds repaid to the state. If a district fails to pay within 60 days, the board may request that the State Controller’s Office deduct the funds from the district’s next LCFF apportionment.
Recent Report Cites Concerns Over OPSC Audits. The Office of State Audits and Evaluations (OSAE), a division of the state Department of Finance, conducted a review of OPSC’s audit practices in September 2015. It found that $3 billion (41 percent) of Proposition 1D funding had not been audited to date. The OSAE sampled $300 million of these unaudited expenditures, finding that $3 million (1 percent) was spent on ineligible items. The OSAE also found that OPSC does not conduct site visits to verify actual construction or purchases.
Governor Proposes to Require Local Independent Audits of SFP Expenditures. The Governor proposes to amend state law to add state facility bond expenditures to local school audit requirements. Under the Governor’s proposal, OPSC would no longer perform audits at the completion of a project. Instead, OPSC would assist districts in filling out newly required upfront grant agreements outlining SFP terms, conditions, and accountability measures. The Governor is pursuing this by requesting the State Allocation Board to enact a regulatory change, with the new upfront agreements expected to be implemented as early as April.
Shifting Auditing Function to Local Level Has Merit, Recommend Adopting Proposal. Though the OSAE review found only a tiny fraction of unallowable expenditures, we believe the Governor’s proposal still has merit. First, it would ensure each district’s SFP expenditures were subject to audit, whereas currently OPSC only examines a subset of projects statewide. Second, it treats facility expenditures the same as many other district expenditures, which are audited locally. Third, the proposal builds upon existing state efforts to shift accountability to the local level. For these reasons, we recommend adopting the Governor’s proposal. We recommend the Legislature also gather more information at spring budget hearings about the effect of the proposal on OPSC’s workload, including the number of positions it might free up for project application reviews.
Back to the TopSummary of Recommendations
Proposition 98
- Expect the 2015‑16 guarantee not to change much in the coming months. Expect the 2016‑17 guarantee to rise or fall about 50 cents for each dollar of higher or lower state tax revenue.
- Expect the 2017‑18 minimum guarantee to exceed the administration’s January estimate by as much as $1.5 billion due to increases in state tax revenue.
- Continue to rely upon a mix of one‑time and ongoing spending in 2017‑18, as this would minimize the likelihood of programmatic cuts to schools the following year were the economy to experience a downturn.
Local Control Funding Formula (LCFF)
- Designate the bulk of any new K‑12 Proposition 98 ongoing spending for LCFF implementation, as LCFF fosters local flexibility while also providing additional funding for disadvantaged students.
- Exhaust other options for achieving one‑time budget solutions in 2016‑17 before deferring LCFF payment.
Special Education
- Take time to explore possible changes to special education funding, as many options exist and redesigning the system could have significant implications for many stakeholders.
Preschool
- Reject proposal to allow part‑day State Preschool programs to serve children over the income threshold. If providers continue having trouble earning their contracts, recommend redistributing unearned funding to other part‑day State Preschool providers that can serve additional low‑income children.
- Allow all types of providers, not only local education agencies, to apply for new full‑day State Preschool slots if additional slots are funded the next few years. Over longer term, consider options for encouraging local education agencies to run more full‑day State Preschool programs—options such as addressing funding disparities between State Preschool and Transitional Kindergarten or changing eligibility requirements so that each program serves a distinct group of students.
- Reject three proposals to align State Preschool more closely with Transitional Kindergarten. Instead, pursue program alignment more holistically by considering eligibility criteria, program standards, and funding levels in tandem.
- Adopt Governor’s proposal regarding Transitional Kindergarten and Kindergarten flexibility, but, in tandem, establish differential funding rates for full‑day and part‑day programs.
Education Mandates
- Develop a less costly approach for making one‑time payments toward the K‑12 mandates backlog. Our recommended plan reduces costs by having schools write‑off all remaining mandate claims as a condition of receiving payments.
- Add a new mandate—Training for School Employee Mandated Reporters—to the K‑12 mandates block grant and increase block grant funding by $41.9 million.
- Add a new mandate relating to the California Assessment of Student Performance and Progress to the K‑12 mandates block grant and increase block grant funding by $37.8 million. Of this amount $25 million reflects the costs associated with the new mandated activities and $12.8 million is a shift of existing, related assessment funding.
School Facilities
- Direct the administration to provide more information during spring budget hearings on how to address the $2.4 billion backlog of school facility projects as quickly as possible.
- Adopt the Governor’s proposal to shift auditing of school facility expenditures from the state Office of Public School Construction to local independent auditors.