EdBudget Tables
At key times during the state's budget cycle, we post tables containing important information about the education parts of the budget. This July posting reflects the enacted 2016-17 budget package. The tables cover Proposition 98, K-12 education, child care and preschool, higher education, and student financial aid.

July 14, 2016
EdBudget Tables
Proposition 98 Overview- Tracking Changes in the Proposition 98 Minimum Guarantee
- Proposition 98 Funding by Segment and Source
- 2014-15 Proposition 98 Changes
- 2015-16 Proposition 98 Changes
- 2016-17 Proposition 98 Changes
- Funding for K-12 and CCC Mandates Backlogs
- Estimates of Outstanding K-12 and CCC Mandates Backlogs
- K-12 Funding Per Student Over Most Recent Three-Year Period
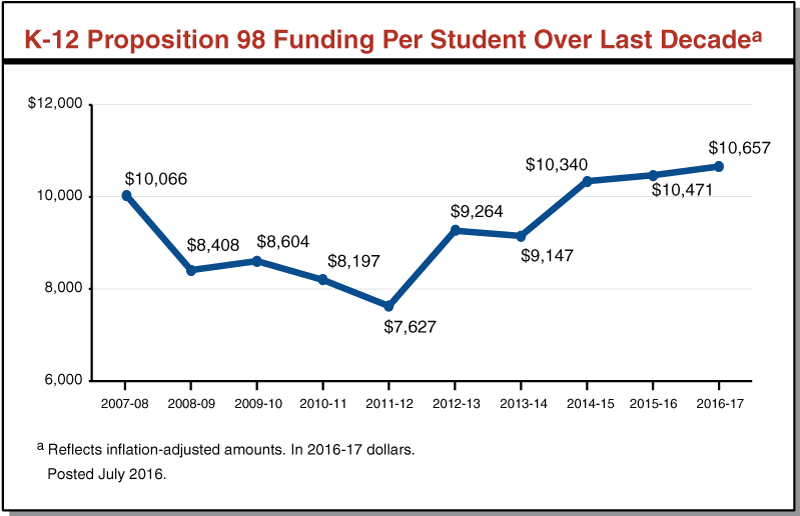
- K-12 Proposition 98 Funding Per Student Over Last Decade
- K-12 Education Programs Funded by Proposition 98
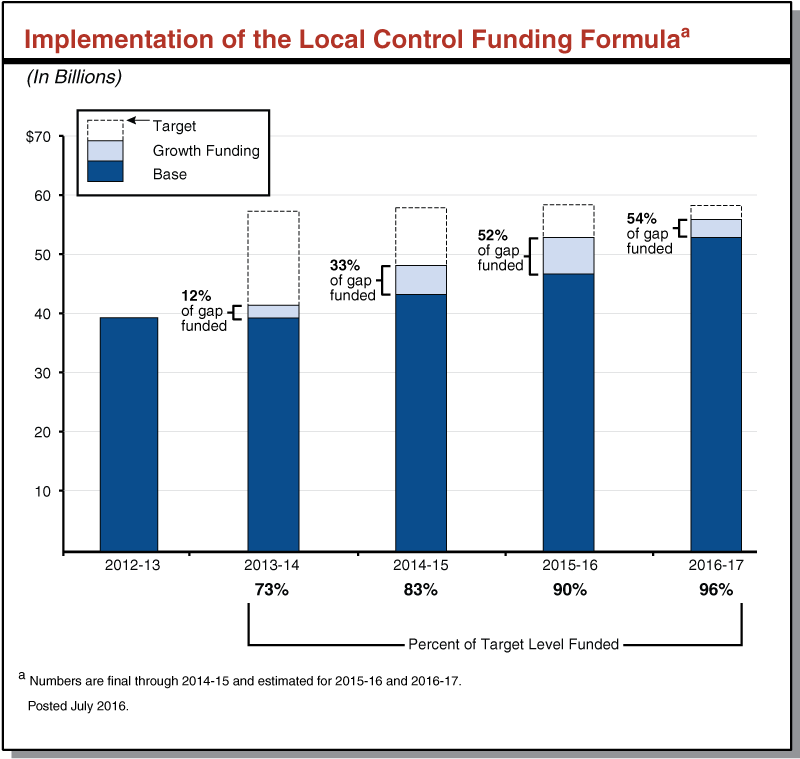
- Implementation of the Local Control Funding Formula
- Breakdown of LCFF Funding
- Workload and Funding Changes for the California Department of Education
- State Special Schools: Deferred Maintenance Projects
- Child Care and Preschool Budget
- 2016-17 Child Care and Preschool Changes
- Child Care and Preschool Subsidized Slots
- Child Care and Preschool Funding Rates by Rate System, Setting, and Age
- Higher Education Funding
- Higher Education General Fund Support by Segment
- Higher Education Funding Per Full-Time Equivalent (FTE) Student
- University of California Core Education Budget
- One-Time Funding for UC Research and Public Service
- California State University Core Education Budget
- Hastings College of the Law Core Education Budget
- Hastings College of the Law: Deferred Maintenance Projects
- California Community College Funding
- Community College Programs Funded by Proposition 98
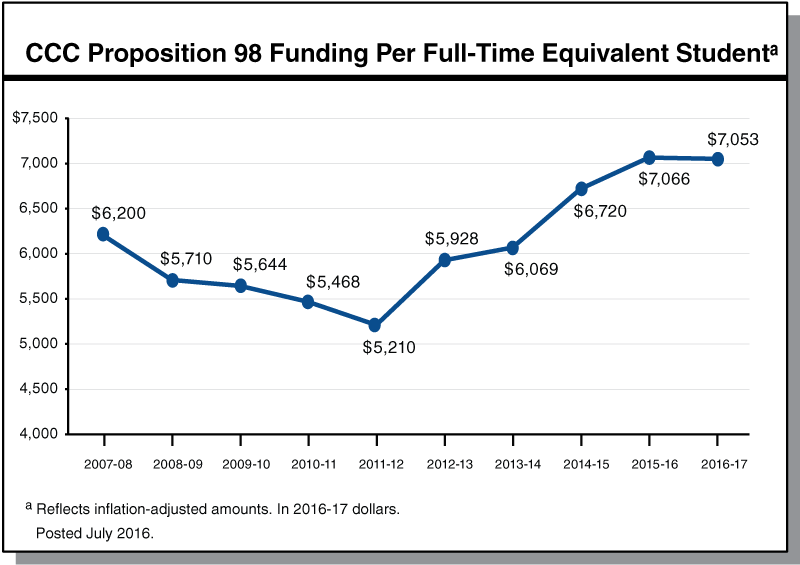
- CCC Proposition 98 Funding Per Full-Time Equivalent Student
- Higher Education Annual Tuition and Fees
- Higher Education Enrollment
- California Student Aid Commission Budget
- Cal Grant Spending
- Cal Grant Recipients
- Middle Class Scholarship Program
- California State Library Budget
- Tracking State General Fund Support for Library Local Assistance Programs
Tracking Changes in the Proposition 98 Minimum Guarantee
(Dollars in Millions)
|
June 2015 |
June 2016 |
Change |
||
|
Amount |
Percent |
|||
|
2014-15 |
$66,303 |
$67,146 |
$843 |
1.3% |
|
2015-16 |
68,409 |
69,050 |
641 |
0.9 |
|
2016-17 |
— |
71,874 |
3,465a |
5.1 |
|
aReflects change from June 2015 estimate of 2015-16 minimum guarantee. Posted July 2016. |
||||
Proposition 98 Funding by Segment and Source
(Dollars In Millions)
|
2014-15 Actual |
2015-16 Revised |
2016-17 Enacted |
Change From 2015-16 |
||
|
Amount |
Percent |
||||
|
Preschoola |
$664 |
$885 |
$975 |
$90 |
10% |
|
K-12 Education |
|||||
|
General Fund |
$44,251 |
$43,340 |
$44,465 |
$1,125 |
3% |
|
Local property tax |
14,810 |
16,759 |
18,057 |
1,298 |
8 |
|
Subtotals |
($59,061) |
($60,099) |
($62,522) |
($2,422) |
(4%) |
|
California Community Colleges |
|||||
|
General Fund |
$5,025 |
$5,415 |
$5,528 |
$113 |
2% |
|
Local property tax |
2,306 |
2,569 |
2,767 |
198 |
8 |
|
Subtotals |
($7,331) |
($7,983) |
($8,295) |
($311) |
(4%) |
|
Other Agenciesb |
$90 |
$82 |
$83 |
— |
— |
|
Totals |
$67,146 |
$69,050 |
$71,874 |
$2,824 |
4% |
|
General Fund |
$50,029 |
$49,722 |
$51,050 |
$1,328 |
3% |
|
Local property tax |
17,117 |
19,328 |
20,824 |
1,496 |
8 |
|
aBeginning in 2015-16, includes $145 million for wraparound care formerly funded with non-Proposition 98 General Fund. bIncludes state agencies providing direct instruction to K-12 students. Consists entirely of General Fund. Posted July 2016. |
|||||
2014-15 Proposition 98 Changesa
(In Millions)
|
2014-15 Spending as of 2015-16 Budget Act |
$66,303 |
|
Technical Adjustments |
$90 |
|
Policy Changes |
|
|
Provide K-12 mandates payments/discretionary funds |
$636 |
|
Provide CCC mandates payments/discretionary funds |
29 |
|
Accelerate progress of CCC online education initative |
20 |
|
Provide grants for academic and behavioral supports |
20 |
|
Fund charter school startup grants |
20 |
|
Fund school water safety grants |
10 |
|
Support California School Information Services |
7 |
|
Conduct a teacher recruitment campaign |
5 |
|
Fund K-12 High Speed Networkb |
4 |
|
Replace state’s standardized school district accounting system |
3 |
|
Subtotal |
($753) |
|
Total Changes |
$843 |
|
2014-15 Spending as of 2016-17 Budget Act |
$67,146 |
|
aAll items shown are funded on a one-time basis. bBudget also includes $5 million in 2016-17 funds. CCC = California Community Colleges Posted July 2016. |
|
2015-16 Proposition 98 Changesa
(In Millions)
|
2015-16 Spending as of 2015-16 Budget Act |
$68,409 |
|
Technical Adjustments |
-$25 |
|
Policy Changes |
|
|
Provide K-12 mandates payments/discretionary funds |
$310 |
|
Establish College Readiness Block Grant |
200 |
|
Provide CCC mandates payments/discretionary funds |
76 |
|
Fund CCEE for training and pilot program |
24 |
|
Support classified school employees interested in teachingb |
20 |
|
Fund dropout and truancy prevention program |
18 |
|
Fund CTE Incentive Grant for Secondary Schoolsc |
8 |
|
Improve CCC technology infrastructure |
7 |
|
Increase funding for school breakfast programs |
2 |
|
Support school activities sponsored by the Special Olympics |
1 |
|
Subtotal |
($666) |
|
Total Changes |
$641 |
|
2015-16 Spending as of 2016-17 Budget Act |
$69,050 |
|
aAll items shown are funded on a one-time basis. bClassified school employees include instructional aides, bilingual assistants, and library assistants. cBudget also includes $292 million in 2016-17 funds. CCC = California Community Colleges; CCEE = California Collaborative for Educational Excellence; and CTE = Career Technical Education. Posted July 2016. |
|
2016-17 Proposition 98 Changes
(In Millions)
|
2015-16 Revised Spending |
$69,050 |
|
Technical Adjustments |
-$1,167 |
|
K-12 Education |
|
|
Increase LCFF funding |
$2,942 |
|
Fund CTE Incentive Grant for Secondary Schoolsa |
292 |
|
Increase preschool funding rates |
44 |
|
Fund truancy and dropout prevention program |
9 |
|
Add 2,959 full-day preschool slotsb |
8 |
|
Fund High Speed Networkc |
5 |
|
Support Exploratorium |
4 |
|
Support Student Friendly Services |
2 |
|
Improve web-based planning and reporting tools (year one of three) |
1 |
|
Remove augmentation for infants and toddlers with disabilities |
-30 |
|
Subtotal |
($3,276) |
|
California Community Colleges |
|
|
Create Strong Workforce Program |
$200 |
|
Fund deferred maintenance and instructional equipment (one time) |
154 |
|
Fund 2 percent enrollment growth |
114 |
|
Provide apportionment increase (above growth and COLA) |
75 |
|
Extend CTE Pathways Initative for one yeard |
48 |
|
Augment Basic Skills Initiativee |
30 |
|
Fund Innovation Awards (one time) |
25 |
|
Fund intersegmental college success partnerships |
15 |
|
Restore funding for select student support programs |
11 |
|
Increase funding for Institutional Effectiveness Initiative |
10 |
|
Fund development of “zero-textbook-cost” degree programs (one time) |
5 |
|
Increase ongoing support for technology infrastructure |
5 |
|
Provide technical assistance to adult education consortia (one time) |
5 |
|
Restore funding for part-time faculty office hours |
4 |
|
Improve systemwide data security |
3 |
|
Fund digital instructional materials for incarcerated adultsf |
3 |
|
Expand outreach and marketing |
3 |
|
Extend Full-Time Student Success Grant to Cal Grant C recipients |
2 |
|
Expand equal employment opportunity activities |
2 |
|
Increase apprenticeship reimbursement rate |
2 |
|
Augment funding for systemwide Academic Senate |
—g |
|
Subtotal |
($716) |
|
Total Changes |
$2,824 |
|
2016-17 Enacted Spending |
$71,874 |
|
aBudget also includes $8 million in 2015-16 funding for this purpose. Reflects year two of a three-year program. bSlots funded as of March 1, 2017. cBudget also includes $3.5 million in 2015-16 funds. dBudget sunsets the CTE Pathways Initative and folds funding into the Strong Workforce Program after 2016-17. eIn 2016-17, funds provide additional Basic Skills and Student Outcomes Transformation grants. In subsequent years, funds augment the Basic Skills Initative. fIn recent years, the California Department of Corrections and Rehabilitation has purchased these materials with non-Proposition 98 funds. gProvides $300,000. LCFF = Local Control Funding Formula; CTE = Career Technical Education; and COLA = cost-of-living adjustment. Posted July 2016. |
|
Funding for K-12 and CCC Mandates Backlogsa
(In Millions)
|
K-12 Education |
Community Colleges |
Total |
|
|
Pay down scored to: |
|||
|
2014-15 funds |
$636 |
$29 |
$665 |
|
2015-16 funds |
310 |
76 |
386 |
|
Settle-up funds |
194 |
— |
194 |
|
Other fundsb |
141 |
— |
141 |
|
Totals |
$1,281 |
$106 |
$1,386 |
|
aFunding can be used for any locally determined one-time purpose. If a local education agency has unpaid mandate claims, funding pays all or a portion of those claims. bUnspent prior-year funds. Posted July 2016. |
|||
Estimates of Outstanding K-12 and CCC Mandates Backlogs
(In Millions)
|
K-12 Education |
Community Colleges |
Total |
|
|
2015-16 Backloga |
$1,604 |
$287 |
$1,891 |
|
Changes |
|||
|
Mandates backlog fundingb |
$1,281 |
$106 |
$1,386 |
|
Payment towards backlog |
617 |
14 |
631 |
|
Remaining funding |
664 |
91 |
755 |
|
2016-17 Backloga |
$987 |
$272 |
$1,260 |
|
aLAO’s estimate of backlog at the end of the applicable fiscal year. bAllocated to all local education agencies, with and without unpaid claims, on a per-student basis. Posted July 2016. |
|||
K-12 Funding Per Student Over Most Recent Three-Year Period
|
2014-15 Actual |
2015-16 Revised |
2016-17 Enacted |
|
|
Proposition 98 Funds |
$10,000 |
$10,217 |
$10,657 |
|
Year-to-Year Change |
|||
|
Amount |
$1,244 |
$217 |
$440 |
|
Percent |
14.2% |
2.2% |
4.3% |
|
Federal Funds |
$1,192 |
$1,315 |
$1,348 |
|
Year-to-Year Change |
|||
|
Amount |
$56 |
$123 |
$33 |
|
Percent |
4.9% |
10.3% |
2.5% |
|
Posted July 2016. |
|||
K-12 Education Programs Funded by Proposition 98
(Dollars in Millions)
|
2014-15 Actual |
2015-16 Revised |
2016-17 Enacted |
Change From 2015-16 |
||
|
Amount |
Percent |
||||
|
LCFF—Districts |
$48,063 |
$52,773 |
$55,773 |
$3,000 |
6% |
|
LCFF—County Offices of Education |
$1,017 |
$1,019 |
$1,029 |
$10 |
1% |
|
Categorical Programs |
|||||
|
Special Education |
$3,816 |
$3,842 |
$3,787 |
-$55 |
-1% |
|
State Preschoola |
654 |
885 |
975 |
90 |
10 |
|
After School Education and Safety |
547 |
547 |
547 |
— |
— |
|
Energy efficiency grants |
279 |
313 |
399 |
85 |
27 |
|
Mandates Block Grant |
218 |
219 |
219 |
-1 |
— |
|
Child Nutrition |
159 |
164 |
160 |
-4 |
-2 |
|
Charter School Facility Grants |
92 |
112 |
112 |
— |
— |
|
Student assessments |
127 |
126 |
110 |
-16 |
-13 |
|
Foster Youth Services Coordinating Program |
15 |
25 |
25 |
— |
— |
|
Partnership Academiesb |
21 |
21 |
21 |
— |
— |
|
Adults in Correctional Facilities |
—c |
—c |
15 |
— |
— |
|
Safe Neighborhood and Schools Program |
— |
— |
9 |
N/A |
N/A |
|
County Offices of Education fiscal oversight |
5 |
5 |
5 |
— |
— |
|
Specialized Secondary Programs |
5 |
5 |
5 |
— |
— |
|
Agricultural Vocational Education |
4 |
4 |
4 |
— |
— |
|
Otherd |
4,791 |
1,012 |
391 |
-622 |
-61 |
|
Subtotals |
($10,735) |
($7,282) |
($6,784) |
(-$497) |
(-7%) |
|
Totals |
$59,815 |
$61,073 |
$63,586 |
$2,513 |
4% |
|
aIncludes $50 million each year for the Quality Rating and Improvement System. In 2014-15, does not include wrap care provided by any agencies. In 2015-16 and 2016-17, does not include wrap care provided by non-local education agencies. In 2016-17, the state provided $146 million for this purpose. bIn each of the past three years, Partnership Academies also have received between $8 million and $9 million from the California Community College’s CTE Pathways Program. cIn each of these years, the state provided program with $15 million in prior-year funds. dIncludes one-time allocations for mandates backlog payments, CTE Incentive Grants for Secondary Schools, Broadband Infrastructure Improvement Grants, various minor one-time expenditures, and programs with less than $4 million in ongoing funding. LCFF = Local Control Funding Formula and CTE = Career Technical Education. Posted July 2016. |
|||||
Breakdown of LCFF Fundinga
(Dollars In Millions)
|
2014-15 Actual |
2015-16 Revised |
2016-17 Enacted |
Change From 2015-16 |
|||
|
Amount |
Percent |
|||||
|
Main Componentsa |
||||||
|
Base fundingb |
$37,599 |
$42,779 |
$45,276 |
$2,497 |
6% |
|
|
Supplemental funding |
4,735 |
5,387 |
5,698 |
311 |
6 |
|
|
Concentration funding |
2,754 |
3,134 |
3,315 |
181 |
6 |
|
|
Subtotals |
($45,088) |
($51,300) |
($54,289) |
($2,989) |
(6%) |
|
|
Add-Ons |
||||||
|
HTS and TIIG |
$1,304 |
$1,304 |
$1,304 |
— |
— |
|
|
Minimum State Aid |
122 |
122 |
122 |
— |
— |
|
|
Economic Recovery Target |
15 |
23 |
31 |
$8 |
33% |
|
|
Otherc |
1,534 |
24 |
28 |
3 |
14 |
|
|
Subtotals |
($2,975) |
($1,473) |
($1,484) |
($11) |
(1%) |
|
|
Totals |
$48,063 |
$52,773 |
$55,773 |
$3,000 |
6% |
|
|
aReflects funding for school districts and charter schools. Reflects LAO estimates. bIncludes funding for Transitional Kindergarten and Necessary Small Schools. cIncludes Basic Aid Choice, Court-Ordered Voluntary Pupil Transfer, Basic Aid Supplemental Charter School Adjustment, categorical payments to joint powers authorities and the State Special Schools, $1.5 billion to undo payment deferrals in 2014-15, and $3.5 million to support the Exploratorium in San Francisco in 2016-17. LCFF = Local Control Funding Formula; HTS = Home-to-School Transportation; and TIIG = Targeted Instructional Improvement Grant. Posted July 2016. |
||||||
Workload and Funding Changes for the California Department of Education
2016-17 Budget Act (In Thousands)
|
Workload Changes |
Fundinga |
Ongoing or One Time |
|
Develop a new video series for teachers about the state’s English Learner standards and update old documents to conform to these standards. |
$1,246b |
One time |
|
Administer and oversee new dropout and truancy prevention program. |
493 |
Ongoing |
|
Ensure schools understand the importance of providing appropriate services to all English learners, pursuant to DJ v. California settlement. |
423 |
Ongoing |
|
Fund Instructional Quality Commission to develop curriculum frameworks for science and health. |
362 |
One time |
|
Establish an advisory committee to help CDE select language development assessments for deaf and hard of hearing children aged birth to five. Provide ongoing technical assistance to local education agencies (LEAs) in implementing these assessments. Pursuant to Chapter 652 of 2015 (SB 210, Galgiani). |
254 |
$194 one time, $60 ongoing |
|
Provide additional support for the development and implementation of state and federal accountability systems. |
251 |
Three years |
|
Support additional workload in the Early Education and Support Division. |
248 |
Two years |
|
Develop program guidelines to assist teachers and parents in supporting students with dyslexia. Provide ongoing technical assistance to LEAs in implementing these guidelines. Pursuant to Chapter 647 of 2015 (AB 1369, Frazier). |
207 |
$67 one time, $140 ongoing |
|
Support timely review of appeals filed under the Uniform Complaint Procedure. |
200 |
One time |
|
Undertake additional technical assistance and monitoring, as more agencies are participating in the at-risk afterschool meals component of the Child and Adult Care Food Program. |
194b |
Ongoing |
|
Report to the Legislature by July 1, 2017 on (1) part-day and full-day kindergarten costs and (2) options for incentivizing full-day programs. |
150 |
One time |
|
Contract to draft a sex trafficking and sexual abuse section for possible inclusion in the next version of the state’s Health Framework. Pursuant to Chapter 713 of 2012 (SB 1165, Mitchell). |
135 |
One timec |
|
Provide training and technical assistance to agencies operating the Child and Adult Care Food Program and still implementing changes required by the federal Healthy and Hunger Free Kids Act (2010). |
100b |
Two years |
|
Collect Educator Effectiveness Block Grant expenditure data from LEAs by July 1, 2018 and submit a report to the Legislature by January 1, 2019. Pursuant to Chapter 13 of 2015 (AB 104, Weber). |
54 |
Two yearsd |
|
Administer state-funded charter school startup grant program. |
50 |
One time |
|
Establish best practices for preventing child abuse and post related resources online. Pursuant to Chapter 748 of 2015 (AB 1058, Baker). |
30 |
One time |
|
Administer fee waiver program for homeless youth who take high school equivalency exams. Pursuant to Chapter 384 of 2015 (SB 252, Leno). |
25 |
$21 ongoing, $4 one time |
|
Transfer administration of the Commodity Supplemental Food Program to the Department of Social Services. |
-108b |
Ongoing |
|
Total |
$4,314 |
|
|
aExcept where noted, all amounts are non-Proposition 98 General Fund. bFederal funds. cFunding initially provided in 2015-16 and reappropriated in 2016-17. dProvides $81,000 in 2017-18. All other limited-term appropriations shown in the figure provide the same amount of funding each year of the two or three years indicated. Posted July 2016. |
||
State Special Schools: Deferred Maintenance Projects
2016-17 Budget Acta (In Thousands)
|
Project |
Estimated Cost |
|
School for the Deaf, Fremont |
|
|
Replace emergency communication system |
$1,010 |
|
Replace flooring |
620 |
|
Replace middle school roof |
600 |
|
Replace HVAC ducts |
250 |
|
Replace playground fall zone |
170 |
|
Replace school master clock |
150 |
|
Conduct electrical maintenance |
50 |
|
Subtotal |
($2,850) |
|
School for the Deaf, Riverside |
|
|
Replace doors and locks |
$150 |
|
Replace classroom carpets |
100 |
|
Repair modular building |
50 |
|
Install vehicle charging stations |
30 |
|
Replace digital controls |
20 |
|
Subtotal |
($350) |
|
Other |
|
|
Paint interiors at CSB |
$400 |
|
Paint building exterior at DCSC |
300 |
|
Work on boiler and asbestos abatement at DCCC |
100 |
|
Subtotal |
($800) |
|
Total |
$4,000 |
|
aReflects funds provided in Control Section 6.10. Provisional budget language earmarks an additional $1.8 million from the base State Special School operating budget for deferred maintenance. HVAC = heating, ventilation, and air conditioning; CSB = California School for the Blind; DCSC = Diagnostic Center—Southern California; and DCCC = Diagnostic Center—Central California. Posted July 2016. |
|
Child Care and Preschool Budget
(Dollars in Millions)
|
2014-15 Actual |
2015-16 Budget Acta |
2016-17 Budget Act |
Change From 2015-16 |
|||
|
Amount |
Percent |
|||||
|
Expenditures |
||||||
|
CalWORKs Child Care |
||||||
|
Stage 1 |
$311 |
$410 |
$413 |
$3 |
1% |
|
|
Stage 2b |
364 |
414 |
445 |
31 |
8 |
|
|
Stage 3 |
223 |
278 |
287 |
9 |
3 |
|
|
Subtotals |
($899) |
($1,103) |
($1,146) |
($43) |
(4%) |
|
|
Non-CalWORKs Child Care |
||||||
|
General Child Carec |
$274 |
$305 |
$321 |
$16 |
5% |
|
|
Alternative Payment Program |
182 |
251 |
267 |
16 |
6 |
|
|
Migrant child care |
28 |
29 |
31 |
2 |
5 |
|
|
Care for Children With Severe Disabilities |
2 |
2 |
2 |
—d |
5 |
|
|
Infant and Toddler QRIS Grant (one time) |
— |
24 |
— |
— |
— |
|
|
Subtotals |
($485) |
($611) |
($620) |
($9) |
(2%) |
|
|
Preschool Programse |
||||||
|
State Preschool—part dayf |
$409 |
$425 |
$447 |
$22 |
5% |
|
|
State Preschool—full day |
453 |
555 |
627 |
73 |
13 |
|
|
Transitional Kindergarteng |
626 |
680 |
719 |
39 |
6 |
|
|
Preschool QRIS Grant |
50 |
50 |
50 |
— |
— |
|
|
Subtotals |
($1,537) |
($1,710) |
($1,843) |
($133) |
(8%) |
|
|
Support Programs |
$73 |
$76 |
$89 |
$13 |
17% |
|
|
Totals |
$2,994 |
$3,500 |
$3,698 |
$199 |
6% |
|
|
Funding |
||||||
|
Proposition 98 General Fund |
$1,280 |
$1,565 |
$1,694 |
$129 |
8% |
|
|
Non-Proposition 98 General Fund |
790 |
977 |
983 |
6 |
1 |
|
|
Federal CCDF |
570 |
573 |
639 |
66 |
12 |
|
|
Federal TANF |
353 |
385 |
383 |
-2 |
-1 |
|
|
aReflects DSS revised Stage 1 estimates for cost of care and caseload. Reflects budget act appropriation for all other programs. bDoes not include $9.2 million provided to community colleges for certain child care services. cGeneral Child Care funding for State Preschool wraparound care shown in State Preschool—full day. dLess than $500,000. eSome CalWORKs and non-CalWORKs child care providers use their funding to offer preschool. fIncludes $1.6 million each year used for a family literacy program at certain State Preschool programs. gReflects estimates available at the time the 2016-17 budget was enacted. QRIS = Quality Rating and Improvement System; CCDF = Child Care and Development Fund; TANF = Temporary Assistance for Needy Families; DSS = Department of Social Services; and CDE = California Department of Education. Posted November 2016. |
||||||
2016-17 Child Care and Preschool Changes
(In Millions)
|
Proposition 98 Funds |
Other Funds |
Total |
|
|
Reimbursement Rates |
|||
|
Increases the Standard Reimbursement Rate 10 percent starting January 1, 2017 |
$44 |
$24 |
$68 |
|
Increases the Regional Market Rate to the 75th percentile of the 2014 regional market survey starting January 1, 2017a |
— |
56 |
56 |
|
Adjusts Transitional Kindergarten for LCFF increases |
39 |
— |
39 |
|
Increases license-exempt rate from 65 percent to 70 percent of family child care home voucher rates starting January 1, 2017 |
— |
14 |
14 |
|
Annualizes funding for Regional Market Rate ceiling increase initiated in 2015-16 |
— |
9 |
9 |
|
Annualizes funding for 5 percent license-exempt rate increase initiated in 2015-16 |
— |
5 |
5 |
|
Subtotals |
($82) |
($108) |
($190) |
|
Slots |
|||
|
Adjusts State Preschool for annualization of slots initiated in 2015-16b |
$31 |
$3 |
$34 |
|
Provides 2,959 full-day State Preschool slots at LEAs starting April 1, 2017 |
8 |
— |
8 |
|
Increases non-CalWORKs slots for statutory growthc |
1 |
1 |
2 |
|
Subtotals |
($40) |
($4) |
($44) |
|
Other |
|||
|
Increases funding for quality improvement activities |
— |
$12 |
$12 |
|
Creates three-year pilot program in Los Angeles County to fund training and wage increases for 150 child care workers |
— |
1d |
1 |
|
Removes one-time Infant and Toddler QRIS grant funds |
— |
-24 |
-24 |
|
Makes CalWORKs caseload and average cost of care adjustments |
— |
-25 |
-25 |
|
Other technical adjustments |
$7 |
-6 |
—e |
|
Subtotals |
($7) |
(-$42) |
(-$36) |
|
Totals |
$129 |
$70 |
$199 |
|
aIncludes a hold harmless provision so that no provider receives less than it received in 2015-16. bAnnualizes the cost of 5,830 LEA and 1,200 non-LEA full-day State Preschool slots initiated January 1, 2015. cReflects 0.13 percent growth in the birth-through-four population. dUses $1.4 million in unspent prior-year Proposition 98 funds. eLess than $500,000. LCFF = Local Control Funding Formula; LEA = local education agency; and QRIS = Quality Rating and Improvement System. Posted July 2016. |
|||
Child Care and Preschool Subsidized Slotsa
|
2014-15 Revisedb |
2015-16 Budget Act |
2016-17 Budget Act |
Change From 2015-16 |
||
|
Amount |
Percent |
||||
|
CalWORKs Child Care |
|||||
|
Stage 1 |
37,442 |
44,154 |
42,995 |
-1,159 |
-3% |
|
Stage 2c |
51,098 |
50,971 |
51,083 |
112 |
—d |
|
Stage 3 |
33,427 |
35,845 |
34,770 |
-1,075 |
-3 |
|
Subtotals |
(121,967) |
(130,970) |
(128,848) |
(-2,122) |
(-2%) |
|
Non-CalWORKs Child Care |
|||||
|
General Child Caree |
27,359 |
28,738 |
28,737 |
-1 |
—d |
|
Alternative Payment Program |
25,079 |
32,852 |
30,614 |
-2,238 |
-7% |
|
Migrant Child Care |
3,049 |
3,060 |
3,064 |
4 |
—d |
|
Care for Children with Severe Disabilities |
169 |
105 |
104 |
-1 |
-1 |
|
Subtotals |
(55,656) |
(64,755) |
(62,519) |
(-2,236) |
(-3%) |
|
Preschool Programs |
|||||
|
State Preschool—part day |
98,061 |
101,469 |
101,598 |
130 |
—d |
|
State Preschool—full day |
50,144 |
57,568 |
62,005 |
4,436 |
8% |
|
Transitional Kindergartenf |
83,321 |
83,321 |
85,500 |
2,179 |
3 |
|
Subtotals |
(231,526) |
(242,358) |
(249,103) |
(6,745) |
(3%) |
|
Totals |
409,148 |
438,083 |
440,470 |
2,387 |
1% |
|
aGenerally based on appropriation and annual average rate per child. Except where noted, slot numbers reflect DSS estimates for CalWORKs Stage 1; DOF estimates for CalWORKs Stage 2 and 3, Migrant Child Care, and Care for Children With Severe Disabilities; and LAO estimates for the Alternative Payment and State Preschool programs. bReflects actuals for all stages of CalWORKs. cDoes not include certain community college child care slots (1,300 to 1,800 slots annually). dLess than 0.5 percent. eState Preschool wraparound slots for non-LEAs (funded by General Child Care) are shown in State Preschool—full day. fReflects estimates available at the time the 2016-17 budget was enacted. DOF = Department of Finance; CDE= California Department of Education; LAO = Legislative Analyst’s Office; and DSS = Department of Social Services. Posted November 2016. |
|||||
Child Care and Preschool Funding Rates by Rate System, Setting, and Agea
|
2014-15 Actual |
2015-16 Estimated |
2016-17 Enacted |
Change From 2015-16 |
||
|
Amount |
Percent |
||||
|
LCFF Reimbursement Rates |
|||||
|
Transitional Kindergarten |
$7,789 |
$8,560 |
$9,065 |
$504 |
6% |
|
Standard Reimbursement Rates |
|||||
|
State Preschool Centers |
|||||
|
Part-Day State Preschool |
$3,899 |
$4,177 |
$4,386 |
$209 |
5% |
|
Full-Day State Preschool |
9,025 |
9,633 |
10,114 |
481 |
5 |
|
Child Care Centers |
|||||
|
Infants |
15,343 |
16,273 |
17,087 |
814 |
5 |
|
Toddlers |
12,635 |
13,402 |
14,072 |
670 |
5 |
|
Preschoolers |
9,025 |
9,573 |
10,051 |
479 |
5 |
|
School-aged children |
9,025 |
9,573 |
10,051 |
479 |
5 |
|
Family Child Care Homes |
|||||
|
Infants and toddlers |
12,635 |
13,402 |
14,072 |
670 |
5 |
|
Preschoolers |
9,025 |
9,573 |
10,051 |
479 |
5 |
|
School-aged children |
9,025 |
9,573 |
10,051 |
479 |
5 |
|
Regional Market Reimbursement Rates |
|||||
|
Averagesb |
|||||
|
Centers |
|||||
|
Infants and toddlers |
$14,376 |
$16,334 |
$16,973 |
$639 |
4% |
|
Preschoolers |
10,641 |
12,545 |
13,008 |
463 |
4 |
|
School-aged children |
8,176 |
8,961 |
9,408 |
447 |
5 |
|
Family Child Care Homesc |
|||||
|
Infants and toddlers |
8,948 |
9,382 |
10,140 |
757 |
8 |
|
Preschoolers |
8,338 |
8,825 |
9,417 |
592 |
7 |
|
School-aged children |
7,321 |
7,583 |
7,920 |
337 |
4 |
|
aAll rates reflect full-time, full-year care, with the exception of Transitional Kindergarten and Part-Day State Preschool, which operate part-day for 180 and 175 days per year respectively. bRMR average costs are weighted by the number of subsidized children receiving child care in each setting and county. Estimates assume half of children reimbursed at weekly rate and half at monthly rate. cLicense-exempt rates were 60 percent of the family child care home (FCCH) rates in 2014-15. The state increased the license-exempt rate to 65 percent of the FCCH rate beginning October 1, 2015 and to 70 percent of the FCCH rate beginning January 1, 2016. Posted July 2016. |
|||||
Higher Education Fundinga
(Dollars in Millions)
|
2014-15 Actual |
2015-16 Revised |
2016-17 Enacted |
Change From 2015-16 |
||
|
Amount |
Percent |
||||
|
University of California |
|||||
|
General Fund |
$2,991 |
$3,259 |
$3,541 |
$282 |
9% |
|
Tuition and feesb |
2,932 |
3,028 |
3,186 |
158 |
5 |
|
Other |
20,868 |
21,508 |
22,022 |
514 |
2 |
|
Subtotals |
($26,791) |
($27,795) |
($28,748) |
($954) |
(3%) |
|
California State University |
|||||
|
General Fund |
$3,018 |
$3,297 |
$3,572 |
$275 |
8% |
|
Tuition and feesb |
2,259 |
2,273 |
2,297 |
24 |
1 |
|
Other |
3,383 |
3,178 |
3,178 |
— |
— |
|
Subtotals |
($8,659) |
($8,748) |
($9,046) |
($299) |
(3%) |
|
California Community Colleges |
|||||
|
General Fund |
$5,389 |
$5,853 |
$6,029 |
$176 |
3% |
|
Local property tax |
2,306 |
2,569 |
2,767 |
198 |
8 |
|
Enrollment feesb |
410 |
429 |
435 |
7 |
2 |
|
Other |
275 |
296 |
300 |
4 |
1 |
|
Subtotals |
($8,380) |
($9,147) |
($9,532) |
($385) |
(4%) |
|
California Student Aid Commission |
|||||
|
General Fund |
$1,539 |
$1,477 |
$1,184 |
-$293 |
-20% |
|
TANF funds |
377 |
521 |
926 |
405 |
78 |
|
Other |
35 |
17 |
24 |
7 |
40 |
|
Subtotals |
($1,952) |
($2,015) |
($2,133) |
($118) |
(6%) |
|
California Institute for Regenerative Medicine |
|||||
|
General Fund |
$275 |
$369 |
$274 |
-$95 |
-26% |
|
Hastings College of the Law |
|||||
|
Tuition and feesb |
$32 |
$27 |
$22 |
-$5 |
-17% |
|
General Fund |
11 |
12 |
15 |
3 |
27 |
|
Other |
51 |
22 |
24 |
2 |
9 |
|
Subtotals |
($93) |
($61) |
($62) |
($1) |
(1%) |
|
Awards for Innovation in Higher Education |
|||||
|
General Fund |
$50 |
— |
$25 |
$25 |
N/A |
|
Totalsc |
$44,881 |
$46,728 |
$48,327 |
$1,598 |
3% |
|
General Fund |
$13,272 |
$14,268 |
$14,640 |
$372 |
3% |
|
Tuition and fees |
4,313 |
4,350 |
4,447 |
97 |
2 |
|
Local property tax |
2,306 |
2,569 |
2,767 |
198 |
8 |
|
Other |
24,989 |
25,541 |
26,472 |
931 |
4 |
|
a General Fund includes direct state support for pensions (for CSU and community colleges), retiree health care (for CSU), debt service (for Hastings and community colleges), and deferred maintenance (for CSU, UC, and Hastings) that comes from outside the segments’ main budget-act appropriations. b Reflects tuition after discounts and waivers. In 2016-17, UC, CSU, CCC, and Hastings plan to provide $1.1 billion, $671 million, $848 million, and $16 million, respectively, in such aid. At CCC, tuition waivers are offset by Proposition 98 funding. c Agency totals do not add because Cal Grant and Middle Class Scholarship tuition payments appear in UC and CSU tuition as well as CSAC General Fund. These payments total $1.3 billion in 2014-15, $1.4 billion in 2015-16, and $1.5 billion in 2016-17. Fund source totals add because these payments are excluded from tuition and appear only in General Fund. Posted July 2016. |
|||||
Higher Education General Fund Support by Segmenta
(Dollars in Millions)
|
2014-15 Actual |
2015-16 Revised |
2016-17 Enacted |
Change From 2015-16 |
||
|
Amount |
Percent |
||||
|
California Community Colleges |
$5,389 |
$5,853 |
$6,029 |
$176 |
3% |
|
California State University |
3,018 |
3,297 |
3,572 |
275 |
8 |
|
University of California |
2,991 |
3,259 |
3,541 |
282 |
9 |
|
California Student Aid Commissionb |
1,922 |
1,998 |
2,110 |
111 |
6 |
|
California Institute for Regenerative Medicine |
275 |
369 |
274 |
-95 |
-26 |
|
Awards for Innovation in Higher Education |
50 |
— |
25 |
25 |
N/A |
|
Hastings College of the Law |
11 |
12 |
15 |
3 |
27 |
|
Totals |
$13,655 |
$14,789 |
$15,566 |
$777 |
5% |
|
aIncludes state General Fund support for pensions (for community colleges and CSU), retiree health care (for CSU), debt service (for community colleges and Hastings), and deferred maintenance (for CSU, UC, and Hastings) that comes from outside the segments’ main budget-act appropriations. bIncludes Temporary Assistance for Needy Families and Student Loan Authority Fund support that directly offsets General Fund costs. Posted July 2016. |
|||||
Higher Education Funding Per Full-Time Equivalent (FTE) Studenta
|
2014-15 Actual |
2015-16 Revised |
2016-17 Enacted |
|
|
Universitiesb |
|||
|
Hastings College of the Law |
$43,332 |
$43,040 |
$43,051 |
|
Year-to-year change |
|||
|
Amount |
$7,496 |
-$292 |
$11 |
|
Percent |
21% |
-1% |
— |
|
University of California |
$23,723 |
$24,795 |
$25,666 |
|
Year-to-year change |
|||
|
Amount |
$954 |
$1,072 |
$872 |
|
Percent |
4% |
5% |
4% |
|
California State University |
$13,868 |
$14,120 |
$14,676 |
|
Year-to-year change |
|||
|
Amount |
$610 |
$252 |
$556 |
|
Percent |
5% |
2% |
4% |
|
Community Colleges |
|||
|
Proposition 98c |
$6,499 |
$6,895 |
$7,053 |
|
Year-to-year change |
|||
|
Amount |
$688 |
$396 |
$158 |
|
Percent |
12% |
6% |
2% |
|
Total Fundingd |
$7,449 |
$7,899 |
$8,126 |
|
Year-to-year change |
|||
|
Amount |
$689 |
$450 |
$227 |
|
Percent |
10% |
6% |
3% |
|
aAt Hastings, UC, and CSU, 1 FTE student represents 30 credit units for an undergraduate and 24 credit units for a graduate student. At CCC, 1 FTE student represents 525 contact hours per year, which equates to about 24 credit units. Enrollment includes resident and nonresident students. bIncludes all General Fund revenue and tuition and fee revenue net of discounts. General Fund includes direct state support for pension and retiree health care costs (for CSU), debt service (for Hastings), deferred maintenance (for CSU, UC, and Hastings), and Innovation Awards (for CSU and UC in 2014-15) that comes from outside the segments’ main budget-act appropriations. In 2016-17, discounts per FTE student are projected to be $18,595 at Hastings, $4,251 at UC, and $1,677 at CSU. cIncludes Proposition 98 General Fund and local property tax revenue. Beginning in 2015-16, includes $500 million for Adult Education Block Grant, of which more than $400 million goes to school districts for their adult education services. Block grant represents $425 per FTE student in 2016-17. Also includes Innovation Awards going to community colleges in 2014-15 and 2016-17. dIn addition to Proposition 98 funds, includes non-Proposition 98 General Fund, enrollment fees, and Lottery funds. Posted July 2016. |
|||
University of California Core Education Budget
(In Millions)
|
Revenuea |
Amount |
|
2015-16 Revised |
|
|
General Fund |
$3,259 |
|
Tuition and fees |
3,028 |
|
Total |
$6,287 |
|
2016-17 Changes |
|
|
General Fund |
$282 |
|
Tuition and feesb |
158 |
|
Otherc |
145 |
|
Total |
$584 |
|
2016-17 Enacted |
|
|
General Fund |
$3,541 |
|
Tuition and fees |
3,186 |
|
Total |
$6,726 |
|
Changes in Spending |
Amount |
|
UC’s Plan for Unrestricted Funds |
|
|
General salary increases (3 percent) |
$152 |
|
Academic quality initiativesd |
50 |
|
Faculty merit salary increases |
32 |
|
Operating expenses and equipment cost increases |
30 |
|
Health benefit cost increases (5 percent) |
27 |
|
Maintenance |
25 |
|
Pension benefit cost increases |
24 |
|
Debt service for capital improvements |
15 |
|
Nonresident enrollment growth (3.2 percent)e |
14 |
|
Dream Loan Program |
5 |
|
Retiree health benefit cost increases |
4 |
|
Subtotal |
($378) |
|
Restricted State General Fund |
|
|
Proposition 2 payment for UC Retirement Plan (one time) |
$171 |
|
Resident undergraduate enrollment growth in 2016-17 (3.4 percent) |
50 |
|
Deferred maintenance (one time) |
35 |
|
One-time research and public service initiatives |
29 |
|
One-time student support and outreach initiatives |
25 |
|
Resident enrollment growth in 2017-18 (1.1 percent) |
19 |
|
Equal employment opportunity best practices |
2 |
|
Remove one-time, prior-year funds |
-124 |
|
Subtotal |
($206) |
|
Total |
$584 |
|
aIncludes all state General Fund. Reflects tuition after discounts. In 2016-17, UC is projected to provide $1.1 billion in tuition discounts. bReflects increases in nonresident supplemental tuition (8 percent), the Student Services Fee (5 percent), and increased enrollment, offset by increases in discounts. cReflects: (1) General Fund for enrollment growth UC intends to carry forward, (2) savings from administrative efficiencies, (3) increased revenue from investments, and (4) philanthropy. dFor purposes such as increasing instructional support, reducing student-to-faculty ratios, recruiting faculty, increasing faculty salaries, and providing stipends to graduate students. UC indicates it will allow campuses to determine how to spend the funds. eFunded from nonresident supplemental tuition. Posted July 2016. |
|
One-Time Funding for UC Research and Public Servicea
(In Millions)
|
Initiative |
Description |
Funding |
|
Innovation and entrepreneurship activities |
Funding is pursuant to pending legislation which calls for each UC campus and the Lawrence Berkeley National Laboratory to expand programs and support services for entrepreneurs. The legislation requires UC to submit an annual report to the Legislature and the Department of Finance on these activities. |
$22 |
|
Precision medicine research |
Trailer legislation specifies funding is for supporting demonstration projects in both Northern and Southern California, to be selected by a committee of experts, and developing a public database of precision medicine assets (such as projects, data sets, and experts). The legislation requires an annual report, beginning January 1, 2017, updating the Legislature on the selected demonstration projects and a final evaluation once the projects are completed. |
10 |
|
Firearm violence research |
Funding is to establish a Firearm Violence Research Center. Funding is available for expenditure over five years. Trailer legislation specifies that the center would support research on public policies related to firearm violence by (1) conducting its own research and (2) distributing small grants to other institutions for research. The legislation requires UC to report every five years (beginning December 31, 2017) on the program. |
5 |
|
Transportation policy research |
Funding augments UC’s longstanding Institute of Transportation Studies. The budget act requires UC to develop an expenditure plan with the Transportation Agency and complete a review of the Project Resourcing and Schedule Management information technology system developed by the Department of Transportation. |
3 |
|
Marine mammal aid |
Funding reimburses the Wildlife Health Center at UC Davis for marine mammal stranding rescue centers ($2 million) and a response team to disentangle whales caught in fishing gear and marine debris ($100,000). |
2.1 |
|
aAll funding provided in the budget act. Funds flow through UC for every program listed except precision medicine research, for which funds flow through the Office of Planning and Research. All initiatives supported with state General Fund except for the transportation initiative, which is supported with monies from the Public Transportation Account in the State Transportation Fund. Trailer legislation refers to Chapter 24 of 2016 (AB 1602, Committee on Budget). Posted July 2016.. |
||
California State University Core Education Budget
(In Millions)
|
Revenuesa |
Amount |
|
2015-16 Revised |
|
|
General Fund |
$3,297 |
|
Tuition and fees |
2,273 |
|
Total |
$5,570 |
|
2016-17 Changes |
|
|
General Fund |
$275 |
|
Tuition and feesb |
24 |
|
Otherc |
101 |
|
Total |
$400 |
|
2016-17 Enacted |
|
|
General Fund |
$3,572 |
|
Tuition and fees |
2,297 |
|
Total |
$5,869 |
|
Changes in Spending |
Amount |
|
CSU’s Plan for Unrestricted Funds |
|
|
Employee compensation increase (5.2 percent) |
$171 |
|
Resident enrollment growth (1.4 percent) |
59 |
|
Employee health benefits |
35 |
|
Lease-revenue debt serviced |
8 |
|
Pension benefitse |
7 |
|
Maintenance of newly constructed facilities |
1 |
|
Otherf |
21 |
|
Subtotal |
($301) |
|
Restricted State General Fundg |
|
|
Pension benefitse |
$37 |
|
Deferred maintenance (one time) |
35 |
|
Graduation improvement plan (one time) |
35 |
|
Retiree health benefits |
12 |
|
Open educational resourcesh |
2 |
|
Equal employment opportunity best practices (one time) |
2 |
|
Student Success Network |
1 |
|
Remove one-time, prior-year funds |
-25 |
|
Subtotal |
($99) |
|
Total |
$400 |
|
aIncludes all state General Fund. Reflects tuition after discounts. In 2016-17, CSU is projected to provide $671 million in discounts. bGenerated from 1.4 percent enrollment growth. cIncludes some unspent funding from 2015-16 carried forward and some campus funds. dPart of a multiyear plan to provide ongoing funding for debt service on projects approved prior to 2014-15. The 2015-16 budget provided an increase of $7.3 million for this purpose. eBeginning in 2014-15, the state provides pension benefit adjustments based on CSU’s 2013-14 payroll level and requires CSU to fund the remaining adjustment from its unrestricted funds. fIncludes $15 million in one-time General Fund. CSU has not yet specified how it will allocate any of the $21 million. It has identified debt service on capital outlay and additional student success initiatives as possible priorities. gExcludes $20,000 ongoing for financial aid to students participating in the Semester at Sacramento program, administered by the Center for California Studies. hImplements Chapter 633 of 2015 (AB 798, Bonilla). Posted July 2016. |
|
Hastings College of the Law Core Education Budget
(In Millions)
|
Revenuea |
Amount |
|
2015-16 Revised |
|
|
Tuition and fees |
$27.0 |
|
General Fund |
12.1 |
|
Total |
$39.1 |
|
2016-17 Changes |
|
|
Tuition and fees |
-$4.6b |
|
General Fund |
3.3 |
|
Draw down reservesc |
3.8 |
|
Total |
$2.5 |
|
2016-17 Enacted |
|
|
Tuition and fees |
$22.5 |
|
General Fund |
15.4 |
|
Total |
$37.8 |
|
Changes in Spending |
Amount |
|
Restricted General Fund |
|
|
Deferred maintenance (one time) |
$2.0 |
|
General obligation bond debt service |
0.3 |
|
Subtotal |
($2.3) |
|
Hastings’ Plan for Unrestricted Funds |
|
|
Benefit cost increases |
$0.2 |
|
Salary increases (2.5 percent)d |
0.1 |
|
Subtotal |
($0.3) |
|
Total |
$2.5 |
|
aIncludes tuition after discounts. In 2016-17, Hastings is projecting to provide $16.3 million in discounts. Includes all state General Fund. bReflects a 3.7 percent decrease in enrollment (-$1.3 million) and a 25 percent increase in tuition discounts (-$3.3 million). cReserves come from tuition, fees, and other fund sources but not General Fund. dIncreases apply only to certain employees comprising about one-quarter of Hastings’ workforce. Posted July 2016. |
|
Hastings College of the Law: Deferred Maintenance Projects
(In Thousands)
|
Project Type |
Cost |
|
Kane Hall |
|
|
Roof |
$1,000 |
|
Electrical |
450 |
|
Window washing anchorage system |
250 |
|
Heating, ventilation, and air conditioning |
130 |
|
Water conservation |
57 |
|
Waterproofing |
42 |
|
Subtotal |
($1,929) |
|
Snodgrass Hall |
|
|
Heating, ventilation, and air conditioning |
$35 |
|
Roof |
23 |
|
Building infrastructure |
13 |
|
Subtotal |
($71) |
|
Total |
$2,000 |
|
Posted July 2016. |
|
California Community College Funding
(Dollars in Millions)
|
2014-15 Actual |
2015-16 Revised |
2016-17 Enacted |
Change From 2015-16 |
||
|
Amount |
Percent |
||||
|
Proposition 98 Funds |
|||||
|
General Funda |
$5,025 |
$5,415 |
$5,528 |
$113 |
2% |
|
Local property tax |
2,306 |
2,569 |
2,767 |
198 |
8 |
|
Subtotals |
($7,331) |
($7,983) |
($8,295) |
($311) |
(4%) |
|
Other Funds |
|||||
|
Non-Proposition 98 General Fundb |
$387 |
$439 |
$527 |
$88 |
20% |
|
Enrollment fees |
410 |
429 |
435 |
7 |
2 |
|
Lottery |
189 |
202 |
202 |
— |
— |
|
Special funds and reimbursements |
86 |
94 |
97 |
4 |
4 |
|
Subtotals |
($1,072) |
($1,163) |
($1,262) |
($99) |
(8%) |
|
Totals |
$8,403 |
$9,147 |
$9,557 |
$410 |
4% |
|
aIncludes $23 million in 2014-15 and $25 million in 2016-17 for Innovation Awards. Beginning in 2015-16, includes $500 million for Adult Education Block Grant, of which more than $400 million goes to school districts for their adult education services. bIncludes funding for state general obligation bond debt service and state contributions to the State Teachers Retirement System for community college districts. Also includes funding for Chancellor’s Office operations. Posted July 2016. |
|||||
Community College Programs Funded by Proposition 98
(Dollars in Millions)
|
2014-15 Actual |
2015-16 Revised |
2016-17 Enacted |
Change From 2015-16 |
||
|
Amount |
Percent |
||||
|
Apportionments |
$5,423 |
$6,017 |
$6,103 |
$85 |
2% |
|
Categorical Programs and Other Appropriations |
|||||
|
Adult Education Block Grant |
— |
$500 |
$505 |
$5 |
1% |
|
Student Success and Support Program |
$199 |
299 |
299 |
— |
— |
|
Strong Workforce Program |
— |
— |
200 |
200 |
N/A |
|
Student equity plan implementation |
70 |
155 |
155 |
— |
— |
|
Physical plant and instructional support (one time) |
196 |
100 |
154a |
54 |
54 |
|
Extended Opportunity Programs and Services |
89 |
123 |
123 |
— |
— |
|
Disabled Students Program |
114 |
115 |
115 |
— |
— |
|
Financial aid administration |
69 |
74 |
73 |
-1 |
-1 |
|
Basic Skills Initiativeb |
90 |
20 |
50 |
30 |
150 |
|
Proposition 39 energy efficiency projects |
38 |
39 |
49 |
11 |
27 |
|
CTE Pathways Initiative (one time)c |
48 |
— |
48 |
48 |
N/A |
|
Lease revenue bond payments |
65 |
56 |
47 |
-8 |
-15 |
|
CalWORKs student services |
35 |
35 |
44 |
9 |
25 |
|
Cal Grant B and C supplemental grants |
— |
39 |
41 |
2 |
6 |
|
Mandates block grant and reimbursements |
32 |
32 |
32 |
1 |
2 |
|
Apprenticeship (community colleges) |
7 |
31 |
32 |
1 |
2 |
|
Telecommunications and technology servicesd |
22 |
27 |
28 |
1 |
4 |
|
Institutional effectiveness initiative |
3 |
18 |
28 |
10 |
57 |
|
Innovation Awards (one time) |
23 |
— |
25 |
25 |
N/A |
|
Part-time faculty compensation |
25 |
25 |
25 |
— |
— |
|
Economic and Workforce Development |
73 |
23 |
23 |
— |
— |
|
Apprenticeship (school districts) |
16 |
20 |
21 |
1 |
5 |
|
Online course initiativee |
30 |
10 |
18 |
8 |
80 |
|
Intersegmental college success partnerships (one time) |
— |
— |
15 |
15 |
N/A |
|
Nursing grants |
13 |
13 |
13 |
— |
— |
|
Part-time faculty office hours |
4 |
4 |
7 |
4 |
104 |
|
Fund for Student Success |
4 |
4 |
6 |
2 |
62 |
|
Foster Parent Education Program |
5 |
5 |
5 |
— |
— |
|
Campus child care support |
3 |
3 |
3 |
— |
— |
|
Equal Employment Opportunity program |
1 |
1 |
3 |
2 |
261 |
|
Otherf |
636 |
196 |
3 |
-193 |
-99 |
|
Subtotals |
($1,909) |
($1,966) |
($2,192) |
($226) |
(11%) |
|
Totals |
$7,331 |
$7,983 |
$8,295 |
$311 |
4% |
|
aAlso receives $23.8 million in Proposition 98 settle-up funds and $6.4 million in prior-year funds. b2014-15 and 2016-17 amounts includes $70 million and $30 million, respectively, for one-time grants. Full 2016-17 amount becomes available for ongoing expenditure beginning in 2017-18. c2014-15 amount is for 2015-16 program costs. State provided $48 million non-Proposition 98 General Fund in 2014-15 for expenditure in 2014-15. Trailer legislation sunsets program July 1, 2017 and folds funding into Strong Workforce Program. d2015-16 amount includes $7 million one time to upgrade technology infrastructure. e2014-15 amount includes $20 million one time for expenditure in 2016-17 to accelerate development of the online course exchange. 2016-17 amount includes $5 million one time for a zero-textbook-cost degree initiative and $3 million ongoing to provide digital instructional materials for students who are inmates in Department of Corrections and Rehabilitation facilities. fncludes one-time allocations for mandate backlog payments, deferral pay down, and baccalaureate degree pilot program. Also includes programs with less than $2 million in ongoing funding (Academic Senate, transfer education and articulation, district financial crisis oversight, and part-time faculty health insurance). CTE = Career Technical Education. Posted July 2016. |
|||||
CCC Proposition 98 Funding Per Full-Time Equivalent Student
Higher Education Annual Tuition and Fees
Mandatory Charges for Full-Time Resident Students
|
2014-15 Actual |
2015-16 Actual |
2016-17 Adopteda |
Change From 2015-16 |
||
|
Amount |
Percent |
||||
|
Hastings College of the Lawb |
$44,186 |
$44,201 |
$44,218 |
$17 |
—c |
|
University of California |
|||||
|
Systemwide Tuition and Feesd |
|||||
|
Graduate—Professionale |
$16,192 to $50,740 |
$16,440 to $52,716 |
$16,494 to $52,770 |
$54 |
—c |
|
Graduate—Academic |
12,192 |
12,240 |
12,294 |
54 |
—c |
|
Undergraduate |
12,192 |
12,240 |
12,294 |
54 |
—c |
|
Average Campus Feesf |
1,125 |
1,211 |
1,272 |
61 |
5% |
|
California State University |
|||||
|
Systemwide Tuition and Fees |
|||||
|
Graduate—Doctoralg |
$11,118 to $16,148 |
$11,118 to $16,148 |
$11,118 to $16,148 |
— |
— |
|
Graduate—Master’sh |
6,738 |
6,738 |
6,738 |
— |
— |
|
Teacher credential |
6,348 |
6,348 |
6,348 |
— |
— |
|
Undergraduate |
5,472 |
5,472 |
5,472 |
— |
— |
|
Average Campus Feesf |
1,287 |
1,343 |
1,343 |
— |
— |
|
California Community Colleges |
|||||
|
Enrollment Fee |
$1,380 |
$1,380 |
$1,380 |
— |
— |
|
Maximum Campus Fees |
73 |
72 |
73 |
$1 |
1% |
|
aReflects rates adopted by the governing boards of Hastings, UC, and CSU. Reflects rate in state law for CCC. bReflects tuition and fees for juris doctor (JD) program only. Non-JD programs do not use residency classifications. The $17 increase in 2016-17 is for Hastings’ Health Services Fee. cLess than 0.5 percent. dReflects a 5 percent increase in UC’s Student Services Fee (charged to all students) from 2014-15 to 2015-16 and from 2015-16 to 2016-17. eReflects range for students in business, law, medicine, nursing and other professional programs. fReflects average for UC undergraduates. Campus fees for UC graduate students are lower. At CSU, campus fees are the same for undergraduate and graduate students. gReflects range for doctorates in education, nursing, and physical therapy. hIncludes one-year postbaccalaureate programs other than teacher credential programs. Posted July 2016. |
|||||
Higher Education Enrollment
Resident Full-Time Equivalent (FTE) Studentsa
|
2014-15 Actual |
2015-16 Revised |
2016-17 Enacted |
Change From 2015-16 |
||
|
Amount |
Percent |
||||
|
California Community Collegesb |
1,128,070 |
1,157,948 |
1,176,100 |
18,152 |
1.6%c |
|
California State Universityd |
|||||
|
Undergraduate |
324,019 |
334,271 |
338,948 |
4,677 |
1.4% |
|
Graduate/other postbaccalaureate |
29,817 |
30,885 |
31,317 |
432 |
1.4 |
|
Teacher credential |
5,843 |
6,061 |
6,146 |
85 |
1.4 |
|
Subtotals |
(359,679) |
(371,217) |
(376,411) |
(5,194) |
(1.4%) |
|
University of California |
|||||
|
Undergraduate |
175,024 |
173,406 |
180,114 |
6,708 |
3.9% |
|
Graduate |
36,978 |
37,263 |
37,686 |
423 |
1.1 |
|
Subtotals |
(212,002) |
(210,669) |
(217,800e) |
(7,131) |
(3.4%) |
|
Hastings College of the Lawf |
841 |
778 |
749 |
-29 |
-3.7% |
|
Totals |
1,700,592 |
1,740,612 |
1,771,060 |
30,448 |
1.7% |
|
aAt UC and CSU, 1 FTE student represents 30 credit units for an undergraduate and 24 credit units for a graduate student. At CCC, 1 FTE student represents 525 contact hours per year, which on average equates to about 24 credit units. bReflects funded enrollment levels. cReflects 2 percent systemwide growth plus 0.7 percent projected enrollment restoration (certain districts earning back slots they had lost within the past three years), offset by a 1.1 percent enrollment reduction in districts with declining enrollment. dFor 2016-17, assumes CSU campuses spread enrollment growth proportionately across each student category. eThe 2016-17 Budget Act directs UC to enroll 2,500 more resident students in 2017-18 over the 2016-17 level. This enrollment expectation is not reflected in the table. fIncludes juris doctor (JD) program only. Non-JD programs do not use residency classifications. Posted July 2016. |
|||||
California Student Aid Commission Budget
(Dollars in Millions)
|
2014-15 Actual |
2015-16 Revised |
2016-17 Enacted |
Change From 2015-16 |
||
|
Amount |
Percent |
||||
|
Expenditures |
|||||
|
Local Assistance |
|||||
|
Cal Grants |
$1,835a |
$1,915 |
$2,005 |
$90 |
5% |
|
Middle Class Scholarships |
62a |
48 |
74 |
26 |
53 |
|
Assumption Program of Loans for Education |
19 |
14 |
12 |
-3 |
-18 |
|
Chafee Foster Youth Program |
12 |
12 |
15 |
3 |
26 |
|
Student Opportunity and Access Program |
7 |
8 |
8 |
— |
— |
|
National Guard Education Assistance Awards |
2 |
2 |
2 |
— |
— |
|
Other programsb |
1 |
1 |
1 |
—c |
6 |
|
Subtotals |
($1,939) |
($2,001) |
($2,117) |
($116) |
(6%) |
|
State Operations |
$13 |
$14 |
$17 |
$2 |
17% |
|
Totals |
$1,952 |
$2,015 |
$2,133 |
$118 |
6% |
|
Funding |
|||||
|
General Fund |
$1,539 |
$1,477 |
$1,184 |
-$293 |
-20% |
|
Federal TANF |
377 |
521 |
926 |
405 |
78 |
|
Otherd |
35 |
17 |
24 |
7 |
40 |
|
aFigures reflect amounts assumed by the Department of Finance. The California Student Aid Commission reports spending $30 million less for Cal Grants and $13 million less for Middle Class Scholarships. bIncludes Cash for College, Child Development Teacher/Supervisor Grants, Graduate Assumption Program of Loans for Education, John R. Justice Program, Law Enforcement Personnel Dependents Scholarships, and State Nursing Assumption Program of Loans for Education for Nursing Faculty. cLess than $500,000 dIncludes College Access Tax Credit Fund, Student Loan Authority Fund, other federal funds, and reimbursements. TANF = Temporary Assistance for Needy Families. Posted July 2016. |
|||||
Cal Grant Spendinga
(Dollars in Millions)
|
2014-15 Actual |
2015-16 Revised |
2016-17 Enacted |
Change From 2015-16 |
||
|
Amount |
Percent |
||||
|
Total Spending |
$1,805 |
$1,915 |
$2,005 |
$90 |
5% |
|
By Segment: |
|||||
|
University of California |
$822 |
$865 |
$890 |
$25 |
3% |
|
California State University |
593 |
650 |
698 |
48 |
7 |
|
Private nonprofit institutions |
240 |
247 |
253 |
6 |
2 |
|
California Community Colleges |
122 |
132 |
145 |
12 |
9 |
|
Private for-profit institutions |
27 |
21 |
18 |
-2 |
-11 |
|
By Program: |
|||||
|
High School Entitlement |
$1,454 |
$1,547 |
$1,637 |
$90 |
6% |
|
CCC Transfer Entitlement |
220 |
217 |
190 |
-28 |
-13 |
|
Competitive |
123 |
145 |
172 |
27 |
19 |
|
Cal Grant C |
8 |
5 |
5 |
—b |
—b |
|
By Award Type: |
|||||
|
Cal Grant A |
$1,034 |
$1,084 |
$1,122 |
$38 |
3% |
|
Cal Grant B |
763 |
826 |
878 |
52 |
6 |
|
Cal Grant C |
8 |
5 |
5 |
—b |
—b |
|
By Renewal or New: |
|||||
|
Renewal |
$1,244 |
$1,352 |
$1,419 |
$67 |
5% |
|
New |
561 |
563 |
585 |
22 |
4 |
|
By Funding Source: |
|||||
|
General Fund |
$1,427 |
$1,392 |
$1,073 |
-$319 |
-23% |
|
Federal TANF |
377 |
521 |
926 |
405 |
78 |
|
Student Loan Authority Fund |
6 |
— |
— |
— |
— |
|
College Access Tax Credit Fund |
— |
2 |
5 |
3 |
166 |
|
aReflects California Student Aid Commission estimates. bLess than $500,000 or 0.5 percent. TANF = Temporary Assistance for Needy Families. Posted July 2016. |
|||||
Cal Grant Recipients
|
2014-15 Actual |
2015-16 Revised |
2016-17 Enacted |
Change From 2015-16 |
||
|
Amount |
Percent |
||||
|
Total Recipients |
318,834 |
330,650 |
347,936 |
17,286 |
5% |
|
By Segment: |
|||||
|
California State University |
115,066 |
121,514 |
128,956 |
7,442 |
6% |
|
California Community Colleges |
100,285 |
105,107 |
112,725 |
7,618 |
7 |
|
University of California |
69,258 |
71,638 |
73,384 |
1,746 |
2 |
|
Private nonprofit institutions |
27,973 |
28,386 |
29,107 |
721 |
3 |
|
Private for-profit institutions |
6,252 |
4,005 |
3,764 |
-241 |
-6 |
|
By Program: |
|||||
|
High School Entitlement |
237,526 |
247,595 |
262,770 |
15,175 |
6% |
|
Competitive |
42,991 |
48,507 |
54,215 |
5,708 |
12 |
|
CCC Transfer Entitlement |
28,910 |
27,632 |
23,951 |
-3,681 |
-13 |
|
Cal Grant C |
9,407 |
6,916 |
7,000 |
84 |
1 |
|
By Award Type: |
|||||
|
Cal Grant B |
199,537 |
209,835 |
223,585 |
13,750 |
7% |
|
Cal Grant A |
109,890 |
113,899 |
117,351 |
3,452 |
3 |
|
Cal Grant C |
9,407 |
6,916 |
7,000 |
84 |
1 |
|
By Renewal or New: |
|||||
|
Renewal |
191,861 |
201,986 |
214,991 |
13,005 |
6% |
|
New |
126,978 |
128,668 |
132,944 |
4,276 |
3 |
|
Note: Reflects California Student Aid Commission estimates. Totals do not match across all categories due to modeling issues. Posted July 2016. |
|||||
Middle Class Scholarship Programa
(Dollars in Millions)
|
Total Funding and Spending |
||||
|
2014-15 Actual |
2015-16 Revised |
2016-17 Enacted |
2017-18b Enacted |
|
|
Statutory appropriation |
$107 |
$82 |
$74 |
$117 |
|
Spending |
49 |
48 |
74 |
117 |
|
Differences |
$58 |
$34 |
— |
— |
|
Recipients and Spending by Segmentc |
|
|||
|
2014-15 Actual |
Recipients |
Spending |
Average Award |
Maximum Awardd |
|
California State University |
61,372 |
$34,714,173 |
$566 |
$768 |
|
University of California |
14,172 |
14,295,678 |
1,009 |
1,704 |
|
Both Segments |
75,544 |
$49,009,851 |
$649 |
|
|
2015-16 Revised |
Recipients |
Spending |
Average Award |
Maximum Awardd |
|
California State University |
44,424 |
$36,348,332 |
$818 |
$1,092 |
|
University of California |
9,003 |
11,968,856 |
1,329 |
2,448 |
|
Both Segments |
53,427 |
$48,317,188 |
$904 |
|
|
aReflects California Student Aid Commission estimates. bAnd each fiscal year thereafter. cThe budget does not include assumptions about recipients and spending by segment for 2016-17 and beyond. dThe maximum award is a percentage of mandatory systemwide tuition and fees at each segment: 14 percent for 2014-15 and 20 percent for 2015-16. Students with household income less than or equal to $100,000 receive the maximum award. Students with household income of $100,000 to $150,000 receive an award that is graduated downward for each $1,000 increase in income. Posted July 2016. |
||||
California State Library Budgeta
(Dollars in Millions)
|
2014-15 Actual |
2015-16 Revised |
2016-17 Enacted |
Change From 2015-16 |
||
|
Amount |
Percent |
||||
|
Expenditures |
|||||
|
Local Assistance |
|||||
|
Library Services and Technology Act |
$9 |
$11 |
$11 |
— |
— |
|
California Library Services Act |
4 |
2 |
7 |
$5 |
253% |
|
California Library Literacy and English Acquisition Program |
4 |
6 |
5 |
-1 |
-17 |
|
Statewide Library Broadband Services Program |
3 |
6 |
2 |
-4 |
-62 |
|
California Civil Liberties Public Education Program |
— |
— |
1 |
1 |
N/A |
|
California Historical Society |
— |
— |
1 |
1 |
N/A |
|
Telephonic Reading for the Blind |
1 |
1 |
1 |
— |
— |
|
Subtotals |
($21) |
($26) |
($28) |
($2) |
(7%) |
|
State Operations |
|||||
|
State Library Services |
$20 |
$21 |
$21 |
—b |
2% |
|
Library Development Services |
2 |
3 |
3 |
—b |
—b |
|
Information Technology Services |
2 |
2 |
2 |
—b |
—b |
|
Subtotals |
($24) |
($26) |
($26) |
($1) |
(2%) |
|
Totals |
$45 |
$52 |
$54 |
$2 |
4% |
|
Funding |
|||||
|
General Fund |
$28 |
$31 |
$33 |
$2 |
6% |
|
Federal Trust Fund |
15 |
18 |
18 |
—b |
—b |
|
Otherc |
2 |
2 |
3 |
—b |
9 |
|
aReflects one-time and ongoing funding. bLess than $500,000 or 0.5 percent. cIncludes California State Law Library Special Account, California Public Library Construction and Renovation Fund, Central Service Cost Recovery Fund, Deaf and Disabled Telecommunications Program Administrative Committee Fund, and reimbursements. |
|||||
Tracking State General Fund Support for Library Local Assistance Programsa
(In Millions)
|
Program |
2009-10 |
2010-11 |
2011-12 |
2012-13 |
2013-14 |
2014-15 |
2015-16 |
2016-17 |
|
California Library Services Act |
$12.9 |
$12.9 |
— |
$1.9 |
$1.9 |
$3.9 |
$1.9 |
$6.6 |
|
California Library Literacy and English Acquisition Program |
4.6 |
4.6 |
— |
2.8 |
2.8 |
3.8 |
5.8 |
4.8 |
|
Statewide Library Broadband Services Program |
— |
— |
— |
— |
— |
3.3 |
6.5 |
2.5 |
|
California Civil Liberties Public Education Program |
0.5 |
0.5 |
— |
— |
— |
— |
— |
1.0 |
|
California Historical Society |
— |
— |
— |
— |
— |
— |
— |
1.0 |
|
Public Library Fund |
12.9 |
12.9 |
— |
— |
— |
— |
— |
— |
|
California Newspaper Project |
0.2 |
0.2 |
— |
— |
— |
— |
— |
— |
|
Totals |
$31.1 |
$31.1 |
$0.0 |
$4.7 |
$4.7 |
$11.0 |
$14.2 |
$15.9 |
|
aExcludes the Library Services and Technology Act program, which is federally funded, and the Telephonic Reading for the Blind program, which is supported with special funds. |
||||||||