Reports by Policy Area
Who is in prison?
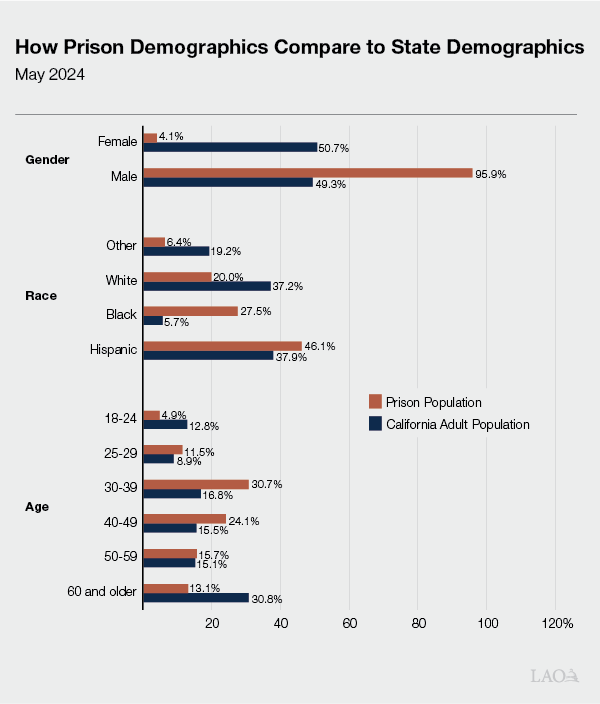
Some Groups Are Overrepresented in the Prison Population. Male, Black, Hispanic, and American Indian/Alaska Native people, as well as people between 25 and 49 years of age are overrepresented in the state prison population relative to their share of the adult population of California. The vast majority of the prison population is male. Black and Hispanic males comprise 64.3 percent of the population, but only 20.2 percent of the overall California adult population. Similarly, 65.1 percent of the prison population is between 25 and 49 years of age, compared to 41.7 percent of the broader population.
These Disproportionalities Also Occur Elsewhere in the Criminal Justice System. For example, according to Department of Justice data, of total adult felony arrests in California in 2024, people who are male made up 77.3 percent, Black made up 15.7 percent, and Hispanic made up 45.2 percent.
The Demographics of the Prison Population Have Changed Over Time. Since 2013, the number of people in prison has decreased by 33.6 percent. During this time, the share of the prison population that is Hispanic has increased by 14.4 percent, while the share that is white or Black has decreased. The prison population has also become older with a decrease in the share of people between 18 and 29 years of age and an increase in the share of people 50 years of age or older. Additionally, the portion of people in prison who are female has declined by 12.3 percent. For more information on the prison population, see the California Department of Corrections and Rehabilitation’s Population Data Points website.
Last Updated: June 2026