November 18, 2009

The 2010-11 Budget: California's Fiscal Outlook

Table of Contents

Executive Summary

Chapter 1: The Budget Outlook

Chapter 2: Economy, Demographics, and Revenues

Chapter 3: Expenditure Projections

Executive Summary

(View Mac Taylor's brief video summary of our major findings.)

Over $20 Billion of Budget Problems Need to Be Addressed in Coming Months

Our forecast of California’s General Fund revenues and expenditures shows that the state must address a General Fund budget problem of $20.7 billion between now and the time the Legislature enacts a 2010–11 state budget plan. The budget problem consists of a $6.3 billion projected deficit for 2009–10 and a $14.4 billion gap between projected revenues and spending in 2010–11. Addressing this large shortfall will require painful choices—on top of the difficult choices the Legislature made earlier this year.

Failed Budget Solutions Responsible for Newly Identified Budget Problem

The vast majority of the new budget problem we have identified for 2009–10 can be attributed to the state’s inability to implement several major solutions in the July 2009 budget plan, such as:

  • The expected inability of several programs—in particular, the prison system and Medi–Cal—to collectively achieve billions of dollars of spending reductions assumed in the 2009–10 budget.
  • The expected inability of the state to sell the State Compensation Insurance Fund (SCIF), a quasi–public workers’ compensation insurer, for the budgeted amount of $1 billion in 2009–10.
  • The state’s loss of a court case that makes the General Fund unable to benefit from over $800 million in transportation funds in 2009–10.
  • A nearly $1 billion increase in the Proposition 98 funding guarantee for K–14 education in 2009–10.

The ongoing impact of most of these problems further expands the multibillion–dollar operating shortfall that policymakers already expected in the 2010–11 budget year. Additional court cases threaten to drive our identified budget problem even higher.

Ongoing Annual Budget Problems Around $20 Billion

Consistent with legislative action in 2009 to eliminate most automatic cost–of–living adjustments (COLAs) for state programs, our forecast assumes no COLAs and no salary increases for state employees through 2014–15. Furthermore, under our forecast that assumes school funding at the minimum guarantee level for Proposition 98, districts will be affected by the loss of billions of dollars of temporary federal stimulus funding over the next two years. Even in this stringent scenario, we forecast that operating deficits after 2010–11 will be around $20 billion each year. The forecasted gap between revenues and expenditures is the greatest—$23 billion—in 2012–13 (the year when the state must pay back its loan from local governments pursuant to Proposition 1A of 2004).

No Way That California Can Avoid Reprioritizing Its Finances

Earlier in 2009, the Legislature adopted major temporary tax increases and significant cuts affecting most state–funded programs. An unexpectedly strong economic recovery theoretically could reduce the deficits we forecast. Nevertheless, the scale of the deficits is so vast that we know of no way that the Legislature, the Governor, and voters can avoid making additional, very difficult choices about state priorities. Moreover, strings attached to federal stimulus funding will result in much less spending flexibility than usual for the state in 2010–11. In the coming years, major state spending programs will have to be significantly reduced. Policymakers will also need to add revenues to the mix.

A Multiyear Approach Is Needed

In 2008 and 2009, the state repeatedly approached insolvency—unable at times to meet some of its basic financial obligations in a timely way. Unless the Legislature and the Governor take action over the next few years to address the deficit, there will be future periods when state finances teeter again near the brink. We urge the Legislature to craft a sustainable framework for California’s public finances. It is unlikely that the Legislature can address all of the state’s massive, ongoing budget problems with permanent, ongoing solutions in the next year. Nevertheless, steady progress in developing such a budget framework is imperative to restore the state’s fiscal health and enhance public trust in state government.

Chapter 1

The Budget Outlook

This report provides our projections of the state’s General Fund revenues and expenditures for 2009–10 through 2014–15 under current law, absent any actions to close the state’s budget gap. Our fiscal projections primarily reflect current–law spending requirements and tax provisions, while relying on our independent assessment of the outlook for California’s economy, demographics, revenues, and expenditures. The report aims to assist the Legislature with its fiscal planning as it begins to consider revisions to the 2009–10 budget and adoption of the 2010–11 budget. The basis of our estimates is described in the box on the next page.

Basis for Our Estimates

(Webcast: How We Develop Our Fiscal Forecast)

Our revenue and expenditure forecasts are based primarily on the requirements of current law, including constitutional provisions (such as the Proposition 98 minimum guarantee for school funding) and statutory requirements. In other cases, the estimates incorporate effects of projected changes in caseloads, federal requirements, and other factors affecting program costs. The estimates are not predictions of what the Legislature and the Governor will adopt as policies and funding levels in future budgets. Instead, our estimates are intended to be a reasonable baseline projection of what would happen if current–law policies continue to operate in the future. We intend the forecast to provide a meaningful starting point for legislative deliberations involving the state’s budget so that corrective actions can be taken.

No COLAs or Inflation Adjustments Assumed. In the 14 previous editions of this publication, we have assumed that most programs, state employees, and grant recipients receive annual price adjustments and cost–of–living adjustments (COLAs). These COLAs and inflation adjustments meant that prior forecasts were maintaining a “current services” budget—a budget in which the purchasing power of current state expenditures is not eroded by the effects of inflation. The Legislature, however, generally has not provided COLAs in recent years. Furthermore, measures included in the July 2009 budget package specified that most programs, including the universities, the courts, and various social services programs, would no longer receive “automatic” COLAs and inflation adjustments. Based on these recent actions, this year’s forecast includes no such COLAs or inflation adjustments. Should the Legislature choose to provide these adjustments in future years, we estimate that the state’s annual budget problems would be even greater than those indicated in our forecast—by about $700 million in 2010–11 and, if inflation adjustments were provided each year during the forecast period, by as much as $5 billion in 2014–15.

State Victories in Court Cases Assumed. Our forecast generally assumes that the state eventually prevails in active, budget–related court cases. (By active cases, we mean open cases at the trial or appellate court level.) The state currently faces an array of active cases, including cases challenging several billion dollars of spending reductions. These cases include ones related to the budgeted shift of local redevelopment funds, state employee furloughs, and various health and social services reductions. The state also is appealing a three–judge panel’s order to reduce the prison population to the U.S. Supreme Court. Similarly, our forecast also does not include spending which was vetoed by the Governor in July but is currently being challenged in court.

The Deteriorating 2009–10 Budget

Projected 2009–10 Year–End Deficit of $6.3 Billion

At the time the July 2009 revisions to the 2009–10 Budget Act were signed into law, the administration estimated that the General Fund would have a $500 million reserve at the end of 2009–10. We have updated our forecast of the 2009–10 General Fund condition to reflect updated revenue and expenditure forecasts based on current economic circumstances. As a result of these updated projections, we estimate that the state faces a 2009–10 year–end deficit of $6.3 billion if no actions are taken.

Inability to Achieve Budget Solutions Is the Key Problem. Spending is drifting well above the levels assumed in the July budget package. Our forecast indicates that General Fund spending obligations will be $4.9 billion higher than budgeted as of the July budget package. Major spending–related budget problems in 2009–10 (described in more detail in Chapter 3 of this report) include:

  • An estimated $1.4 billion problem in the California Department of Corrections and Rehabilitation (CDCR) budget, largely the result of higher–than–budgeted spending by the prison medical care Receiver, and policy adjustments that were insufficient to allow the prison and parole systems to meet budget reduction targets.
  • A nearly $1 billion increase in the Proposition 98 minimum school funding guarantee in 2009–10.
  • Nearly $900 million of higher–than–budgeted spending for the Medi–Cal Program—largely due to the state’s inability to obtain additional federal funds or flexibility to reduce program costs.
  • Over $800 million of higher General Fund spending related to the court decision mentioned earlier, which limits the state’s ability to use “spillover” gasoline sales tax and Public Transportation Account funds to reduce General Fund spending.

Our revenue estimate also includes no funds from the sale of the SCIF, which the July budget plan assumed would produce $1 billion in General Fund revenues in 2009–10.

Tax Revenues Coming in Somewhat Less Than Budgeted. The 2009–10 budget plan, as adopted in July, assumed that the General Fund would receive revenues and transfers totaling $84.1 billion in 2008–09 and $89.5 billion in 2009–10. For the fiscal year to date, General Fund taxes have been somewhat softer than expected. Based on our analysis of current and expected economic and revenue trends, we expect that General Fund revenues and transfers will be $83.6 billion in 2008–09 ($496 million less than budgeted) and $88.1 billion in 2009–10 ($1.5 billion less than budgeted). After accounting for the expected inability to sell SCIF, however, other revenues in our forecast are just $451 million less than budgeted in 2009–10. (We discuss our revenue and economic estimates in more detail in Chapter 2 of this report.)

Major New Budget Problem Looms in 2010–11

Even at the time the 2009–10 budget was revised in July 2009, policymakers acknowledged a multibillion–dollar shortfall for the upcoming 2010–11 budget. The administration at the time estimated the operating shortfall—that is, the gap between projected expenditures and projected revenues—to be $7.4 billion. In large part, this expected shortfall was the result of one–time and temporary budget solutions in the range of $20 billion—especially the use of federal stimulus funds, shifting funds from local governments to the benefit of the state, and one–time revenue accelerations—no longer being available to help balance the 2010–11 budget. The administration’s 2010–11 budget shortfall estimate in July, however, did not carry forward the $3 billion in lower tax revenues the Legislature incorporated into the final budget plan passed in July. Accordingly, the administration’s $7.4 billion shortfall estimate for 2010–11 was based on a revenue estimate that was too optimistic, to the tune of several billion dollars. Additionally, our estimate of the 2010–11 operating shortfall is several billion dollars higher than the administration’s prior estimates. This is due mainly to about $3.5 billion of higher net spending in our forecast—principally the result of continuing trends from 2009–10 in Medi–Cal, the transportation–related court case described above, and CDCR. In total, we project a 2010–11 operating shortfall of $14.4 billion. Figure 1 shows the state’s General Fund condition through 2010–11 under our updated projection. During the next several months, the Legislature will have to address this combined $20.7 billion budget problem and pass a budget plan that restores the General Fund to balance by the end of 2010–11.


Figure 1

LAO Projection of General Fund Condition If No Corrective Actions Are Taken

(In Millions)

2008–09

2009–10

2010–11

Prior–year fund balance

$4,071

–$4,086

–$5,246

Revenues and transfers

83,601

88,090

87,793

Total resources available

$87,672

$84,004

$82,547

Expenditures

91,758

89,251

102,196

Ending fund balance

–$4,086

–$5,246

–$19,649

Encumbrances

1,079

1,079

1,079

Reservea

–$5,165

–$6,325

–$20,728

a Special Fund for Economic Uncertainties. Assumes no transfers to the state’s Budget Stabilization Account.


Lingering Budget Problem Around $20 Billion for Years to Come

Our fiscal forecast also looks beyond the 2010–11 budget year to see where the state’s finances are headed in the longer term, through 2014–15. Figure 2 shows the budget problem that we estimate the Legislature will have to solve during each year’s budget process. (The first column in Figure 2 combines the $6.3 billion projected deficit for 2009–10 and the $14.4 billion operating shortfall in 2010–11.) The forecast of the General Fund’s annual operating shortfall is affected significantly by the expiration at the end of 2010–11 of all of the temporary tax increases approved in February 2009. These expirations, coupled with increasing program spending, cause the operating shortfall to rise to $21.3 billion in 2011–12. In 2012–13, the shortfall grows even larger to $23 billion as the state must bear the cost of paying back local governments for borrowing funds pursuant to Proposition 1A (2004). Thereafter, revenues grow by at least 6.6 percent per year and outpace annual spending growth. During the later years of the forecast, ending growth in various health and social services programs is expected to moderate as the economy improves. These factors cause the operating shortfall to moderate somewhat—declining to $18.4 billion in 2014–15.

FO_JD_OperatingShortfall.ai


Additional Risks, Uncertainties, and Cost Pressures

Our forecast captures our best estimates at this time regarding the state’s fiscal condition. Yet, the state faces an unusually high number of other risks, uncertainties, and cost pressures not accounted for in our forecast.

Economic Uncertainty and Revenue Volatility. California’s state tax system is volatile, which means it can respond very negatively to bad economic trends and very positively to certain favorable economic trends, such as significant increases in stock and other asset values. Forecasting when and how quickly the state will recover from the recession is particularly difficult. While our forecast represents a consensus view for modest recovery beginning in 2010, a rapid bounce–back in capital gains or, conversely, a new economic slump are both possibilities during the forecast period.

Addressing the Loss of Federal Stimulus Funds in 2010–11 and Beyond. Increased General Fund spending in 2010–11 and beyond assumes the state increases expenditures to make up for the loss of temporary federal stimulus funds in various health, social services, higher education, and prison programs, as required in most cases under existing policies. The Legislature, however, will have to determine whether to increase spending even more than indicated in our forecast to make up for the loss of federal funds provided to school districts. Reductions to school spending in 2008–09 and 2009–10, for example, were tempered by the flow of $6 billion in federal stimulus funding, which helped prevent additional hits to school district budgets. Our forecast assumes funding of school districts and community colleges at the Proposition 98 minimum guarantee, which we estimate will decline in 2010–11 and again in 2011–12. Thus, if the state funds schools at the levels reflected in our forecast, school districts could face significant difficulties due to the simultaneous decreases in federal and state/local funding.

Inflation and COLAs. Our forecast reflects a spending level in which current services and the purchasing power of salaries and grants funded by the state will be eroded by the effects of inflation during the forecast period. Under our forecast scenario, for example, most state employees would see no salary increase for eight or more years after receiving their last COLA in 2007. (Such a long wage freeze, we would note, could affect departmental operations negatively in various ways.) As noted earlier, the operating shortfall would be billions of dollars more by 2014–15 if COLAs and inflation adjustments were provided to state programs and employees throughout the forecast period.

Ongoing Court Cases. The state faces many ongoing lawsuits related to prior budgetary actions that could increase the budget shortfall by hundreds of millions or billions of dollars in any given year. Two of the most significant such issues are:

  • Challenges to the requirement in the 2009–10 budget for redevelopment agencies to make payments totaling $1.7 billion in 2009–10 and $350 million in 2010–11 to benefit the General Fund.
  • Over 20 lawsuits challenging the Governor’s state employee furlough policy, which was budgeted to provide over $1 billion in savings in 2009–10.

On the other hand, if the state were to comply with an anticipated ruling by a federal three–judge panel concerning prison overcrowding, General Fund spending could decline by hundreds of millions of dollars per year.

Federal Health Policy. Two major federal issues could have a major effect on state health program spending in the coming years. First, Congress is considering health care reform legislation that could expand the Medicaid program, change reimbursements to providers, and affect state employee benefit costs. Second, the state’s current Medicaid hospital waiver expires in August 2010. Due to the uncertainty concerning these matters, we could not incorporate spending driven by these issues into our forecast. It is conceivable that these issues could cause major changes in state spending in the future.

The Legislature’s Flexibility in Balancing the State’s Books

In General, the Legislature Retains Power Over the Budget… Some observers of the California budget process have asserted that—due to voter–approved propositions, federal law, and court decisions—the state’s budget is unmanageable and basically impossible to balance. In reality, however, the Legislature remains in control of the vast majority of state spending. This is particularly true over the longer term when there is enough time to allow major decisions by the Legislature to be fully implemented. Even in the shorter term, the Legislature generally holds a considerable degree of freedom to adjust state spending. Such decisions are often more restricted by the lack of political consensus as opposed to any structural budgetary constraint.

…But 2010–11 Presents Unusual Constraints and Challenges. The 2010–11 budget, however, will come with additional constraints that threaten the Legislature’s ability to bring the budget into balance. For instance, while federal stimulus funds contributed billions of dollars in budget solutions for 2009–10, the monies came with strings attached in the form of “maintenance–of–effort” requirements that apply through 2010–11. Particularly in both K–12 and higher education, the level of budget savings that can be achieved in 2010–11 in these areas under existing federal rules is dramatically lower than their share of overall spending. Similarly, provisions of the stimulus act take changes in Medi–Cal eligibility off the table as a budget–balancing tool until 2011. In addition, a series of court cases threaten to slow or halt altogether the implementation of budget solutions across many areas of the state budget. Finally, many one–time solutions used to balance the budget in 2009–10 are no longer available in 2010–11.

Over the Longer Term, the Legislature Faces Rising Costs for Debt Service and Retirement. As discussed in more detail in Chapter 3, two of the faster growing areas of the state budget are the costs for infrastructure debt service and retirement programs. Because they involve contractual obligations, these areas of the budget generally can only be changed on an incremental basis. As a result, the vast majority of costs for these programs are already locked in place for 2010–11 and are expected to continue to rise throughout our forecast:

  • Retirement Liabilities. Unfunded retirement–related liabilities of state entities may exceed $130 billion after declines in their investments in 2007–08 and 2008–09. Of perhaps even greater worry is that some categories of retirement costs—particularly retiree health costs and costs for the University of California’s pension plan—may rise significantly for decades, as the state has no plan to fully address those liabilities.
  • Debt–Service Costs. The state’s debt–service ratio (the portion of General Fund revenues consumed by debt service) is rising rapidly due to implementation of the large voter–approved 2006 bond package, as well as the recent sharp drop in state revenues. It now appears very likely that debt service will comprise 9 percent of General Fund revenues—an unprecedented level—by the end of 2014–15.

Retirement and debt–service costs combined make up about 12 percent of state General Fund revenues in 2009–10. During our forecast period, these costs grow to around 15 percent and leave less General Fund resources for other state programs, like education, corrections, health, and social services.

Keys to Balancing the Budget

One year ago, we advised the Legislature that closing the 2009–10 budget gap—which eventually swelled to $60 billion—would be a “monumental task.” Using every tool available to it—spending cuts, tax increases, borrowing, federal funds, and one–time budgetary maneuvers—the Legislature took sweeping action that, even after considering recent budgetary deterioration, closed around 90 percent of that gap. Because the Legislature already has made so many difficult decisions, addressing the immediate $20.7 billion budget problem in the coming months may be even more difficult. As the Legislature crafts a plan to bring the budget back into balance, here are some key components that should be part of its approach:

  • Take Early Action. Every month of delayed action in addressing the new budget gap means that the opportunity for various savings is lost. Solutions often need early action in order to get a full year’s worth of savings in 2010–11. Taking action beginning within the next few months would also help ensure that the state can continue to meet its cash flow needs.
  • Focus on Long–Lasting Solutions. The budget problems we predict are long–term in nature. They will not go away quickly. Accordingly, long–term solutions are needed. The Legislature should focus on actions that have ongoing impacts.
  • Make Hard Decisions on Priorities. The scale of the near–term and future budget gaps is so large that the Legislature will need to make significant reductions in all major state programs—beyond the reductions included in the 2009–10 budget. In the coming months or years, we know of no way the Legislature can avoid making such hard decisions concerning state funding priorities.
  • Include Revenue Options. Just as the Legislature will have to prioritize its spending commitments, we continue to recommend that it do the same on the revenue side. Through tax expenditure programs—special credits, deductions, and exemptions—the state provides subsidies to certain groups or individuals in ways that often have not been shown to be cost–effective. Their modification or elimination raises revenues without having to increase marginal tax rates. The Legislature should also look to increasing fees in those cases where the costs of state programs currently supported by the General Fund can appropriately be shifted to specific beneficiaries. The state’s fiscal situation is so dire, however, that the Legislature may also have to revisit some of the temporary tax increases that are set to expire by the end of 2010–11. We think the best candidates for extension would be the vehicle license fee, where a good policy case can be made to tax vehicles at a rate similar to all other property, and the dependent exemption credit, where the current level is more consistent with the practice of almost all other states. In sum, while we do not recommend further stressing the economy with additional tax rate increases above their current levels, the Legislature is unlikely to bring the budget into balance without adding revenues to the mix.
  • Aggressively Seek New Federal Assistance. The 2009–10 budget was closed in large part due to the availability of billions of dollars in federal relief. It will not be easy for California policymakers to convince Congress and the President to extend new budgetary relief to the states. Just as the state faces overwhelming fiscal problems, so does the federal government. Nevertheless, if the federal government does not extend relief for state funding of Medicaid and other health and social services programs, states like California may be forced to trim these programs further just as the economic recovery takes hold. If the federal government were to be convinced to extend just its relief of the federal medical assistance percentage and certain relief for Temporary Assistance for Needy Families, both components of the stimulus act, it could help the state address up to $2.5 billion of its 2010–11 shortfall and up to $5 billion of its 2011–12 shortfall. Other federal actions could help the state operate its education, prisons, and unemployment insurance programs at reduced state costs. To be able to consider such potential savings in the 2010–11 budget, California leaders need to convince the federal government to enact changes within the next six months or so.
  • Trying the Ballot Again Is an Option. The Legislature’s efforts to use the May 2009 Special Election to help balance the budget were unsuccessful, in part due to the complexity of the package presented to the voters. Despite this failure, the Legislature has the option of using the statewide elections scheduled for June and November 2010, presenting a more straightforward package of budget flexibility. Options include redirecting revenues away from Proposition 10 (early childhood development), Proposition 49 (after school programs), and Proposition 63 (mental health).

We urge the Legislature to craft a sustainable framework for California’s public finances. It is unlikely that the Legislature can address all of the state’s massive, ongoing budget problems with permanent, ongoing solutions in the next year. Nevertheless, steady progress in developing such a budget framework over the next few years could restore the state’s fiscal health and enhance public trust in state government.

Chapter 2

Economy, Demographics, And Revenues

Economic and demographic developments have a big impact on California’s fiscal condition, as they affect both tax revenues and expenditures in such areas as education, health, social services, corrections, and transportation. This chapter presents our economic and demographic projections for calendar years 2009 through 2015. We then discuss our forecast of General Fund revenues, which will support the state’s budget from 2009–10 through 2014–15.

The Economic Outlook

The latest evidence suggests that the state and national economies are stabilizing after a staggering drop–off in late 2008 and early 2009. The pace of the recovery, however, is still unclear. Our forecast reflects the current consensus that the state and national economies will experience a sluggish recovery in both 2010 and 2011. Given that the economy has endured the worst recession since the Great Depression, however, there are no recent precedents for reliably forecasting the immediate future. Figure 1 summarizes our revised forecasts for key economic variables for both the nation and California. In the rest of this section, we discuss our economic forecast in more detail.


Figure 1

The LAO’s Economic Forecast

(November 2009)

Actual

Estimated

Forecast

2008

2009

2010

2011

2012

2013

2014

2015

United States

Percent change in:

Real Gross Domestic Product

0.4%

–2.5%

2.0%

3.0%

3.7%

2.9%

2.6%

2.5%

Personal Income

3.8

–2.1

2.8

4.1

5.3

5.4

5.4

5.2

Wage and Salary Employment

–0.4

–3.8

–0.7

1.9

2.5

2.1

1.4

1.1

Consumer Price Index

3.8

–0.4

1.7

2.2

2.1

1.9

2.0

1.9

Unemployment Rate (percent)

5.8

9.2

10.0

9.4

8.5

7.9

7.6

7.3

Housing Permits (thousands)

903

586

863

1,301

1,579

1,677

1,677

1,713

California

Percent change in:

Personal Income

2.8%

–1.3%

2.1%

3.9%

5.1%

5.3%

5.5%

5.3%

Wage and Salary Employment

–1.1

–4.5

–1.2

1.5

2.3

2.3

2.0

1.6

Consumer Price Index

3.8

–0.4

1.7

2.2

2.1

1.9

2.0

1.9

Unemployment Rate (percent)

7.2

11.7

12.1

11.3

10.2

8.9

7.7

6.9

Housing Permits (thousands)

63

34

72

111

122

125

131

133


The U.S. Economy

U.S. Economy on the Upswing

Positive Growth in Third Quarter. The national economy’s free fall of late 2008 and early 2009 stemming from the worldwide financial crisis, appears to be over. Gross domestic product (GDP) grew at an estimated 3.5 percent annual rate in the third quarter of 2009, a major improvement over declines of 0.7 percent, 5.4 percent, and 6.4 percent in the previous three quarters. The third–quarter estimate probably overstates the economy’s underlying strength, as federal stimulus–related spending (including the “cash for clunkers” automobile incentives) boosted growth during the quarter. The data confirms, however, that the recovery has begun.

Job Losses Severe, but Slowing. The nation has shed over 7.2 million jobs since employment peaked at the end of 2007, a decline of 5.2 percent. Proportionately, this represents the largest job loss of any peacetime recession since the Depression (the drop resulting from demobilization after World War II was larger). The unemployment rate, which depends both on the rate of job growth and on workers’ decisions to enter or leave the work force, stood at an estimated 10.2 percent in October, its highest since 1983 and twice as high as in December 2007 (just before the start of the recession).

Recent job–loss figures, however, also imply that the worst is over. By the most recent estimates, the national economy lost 768,000 jobs during the third quarter of 2009, down from 2.07 million and 1.29 million in the first two quarters of the year. This pattern—growth in the economy accompanied by a continuing loss of jobs—is typical in the early stages of a recession recovery.

Leading Indicators Also Suggest Recovery. The national index of leading indicators has been positive for six straight months. In September, eight of the ten factors that make up the index were positive, including money supply and interest rates, consumer expectations, initial claims for unemployment insurance, stock prices, manufacturing orders, and deliveries. Only building permits and average hours worked in manufacturing were down.

Health of the Financial Sector Is Key. A sustained economic recovery will depend on a healthier financial sector. The financial sector imploded in late 2008 primarily due to the bursting of the housing bubble that exposed holders of mortgages and mortgage–derived assets. This caused lending activity to freeze and dragged the broader economy down. Concerns about the short–term solvency of big banks have mostly subsided, although mortgage and credit card defaults remain at high levels. As a result, lenders and borrowers alike have been very cautious lately—constraining the amount of economic growth.

U.S. Economy Headed to a Modest Recovery

The forecast reflects the mainstream view that the nation is likely to experience a modest recovery over the next few years followed by a relatively slow expansion over the latter part of the forecast period. As shown in Figure 2, we expect the positive growth of the third quarter to continue. Despite the positive growth in each of the last two quarters, we project a 2.5 percent real GDP decline for the U.S. in 2009.

FO_JG_RealGDP.ai

Current Economy Has Fundamental Problems. While we project growth rates of 2 percent for 2010 and 3 percent for 2011, these levels are historically low for a recovery from a deep recession. For instance, following the deep 1981–82 recession in which GDP shrunk by 2.9 percent from peak to trough, the economy bounced right back—growing 4.5 percent in 1983 and 7.2 percent in 1984.

In 2010, however, we expect the recovery to moderate because today’s economy has several fundamental shortcomings. The 2008–09 recession resulted from a burst real estate bubble and financial collapse that left a glut of unoccupied residential and commercial real estate, consumers struggling to get out from under historically large debt burdens, and banks unable or unwilling to lend even when they find willing borrowers. With the federal funds rate already close to zero, there is little room for the Federal Reserve to stimulate the economy.

The pattern that we are projecting for the U.S. economy fits the description of a “U–shaped” recovery, which has a slow pace normally associated with a mature expansion. Some economists, however, worry the country is heading into an “L–shaped” non–recovery, in which the economy stagnates for an extended period with little or no growth. The U.S. has never suffered an L–shape recession in the modern era. Japan experienced such a recession, known as its “lost decade” of the 1990s, after an asset bubble burst and its financial system collapsed. Given the similarities between the U.S. economy in 2010 and Japan in the early 1990s, there remains the possibility that the current recovery could mirror the experience of Japan in the 1990s.

Unemployment Will Fall Slowly. The unemployment rate usually peaks several quarters after a recession ends. We forecast national unemployment to peak at above 10 percent in the first quarter of 2010, three quarters after the GDP trough. Due to the slow pace of the recovery, however, our forecast projects that the unemployment rate will not return to its pre–recession level at any point in the forecast period. By 2015, unemployment is projected to be down to 7.3 percent—well above the pre–recession level of 4.9 percent.

Inflation Stays Low. The high unemployment rate throughout the forecast period reflects our assumption that the economy will not operate at full capacity. Largely because of this slack in the economy, inflation is expected to stay in the 1 percent to 2 percent range over the next five years. Currently, the federal government is taking extraordinary steps to boost the economy. The 2009 stimulus act added about $800 billion to the federal budget, and the Federal Reserve has taken unprecedented steps to keep interest rates low and ensure that loans are available through the banking system. Ordinarily, that would be a prescription for inflation. In today’s environment, however, inflation does not appear to pose a problem because the economy has so many idle resources, such as unemployed workers and underutilized facilities. As the economy improves, our forecast anticipates that the federal government will shift from a stimulative approach to a more neutral economic policy. Failure to act in a timely fashion could lead to inflationary pressures in the later years of our forecast.

The California Economy

California’s Recession—Longer and Deeper. The recession started earlier in California than in the rest of the nation. The state economy also has fallen further. For instance, state employment has dropped 6.6 percent (one million jobs) since peaking in July 2007, compared to the 5.2 percent fall in national employment. Similarly, housing prices dropped further than in other states.

Indications of Recovery. Current data suggest that the state economy, like the national economy, is on the mend. The pace of job losses, for instance, has subsided in the state. After major losses in the spring, employment data for the third quarter of 2009 show California losses during that period dwindling to about 0.6 percent of total employment. There are other signs that the state’s economy is no longer trailing the rest of the nation. Federal data on the current pace of the recovery shows California in the top half of all states. Even home prices are rising faster in the Los Angeles, San Diego, and San Francisco regions than in the rest of the country.

As the Nation Goes, So Goes California

California’s short–term prospects appear to be about on par with the nation’s—both the prospects for growth and the small possibility of an extended slowdown apply to the state economy as well as the nation’s. We expect the major forecast variables to follow the same pattern in California as in the nation. The recession will end in California in 2009, with recovery in 2010 and 2011. We expect low growth in personal income—2.1 percent and 3.9 percent annually over the next two years. In the remaining years of the forecast, growth in the state averages slightly above 5 percent. This also is low by historical standards. Unemployment will take more time to recover, peaking in 2010 at an average of 12.1 percent and gradually declining to 6.9 percent at the end of our forecast.

Housing Prices and Building Permits Stay Weak. Our forecast assumes that, in significant respects, California’s current housing market resembles the early 1990s: an economy recovering from a recession, housing prices falling substantially due to the bursting of a bubble, and a big supply of available residential and commercial real estate. While there are important difference between today’s economy and the one of the early 1990s, we expect the recovery in the housing sector over the next few years will follow the general pattern of the 1990s.

Figure 3 shows our projection of housing prices in California. The figure displays the Case–Shiller Index, which represents a weighted average of housing prices in the Los Angeles, San Francisco, and San Diego metropolitan areas. Our forecast shows prices staying fairly flat over the forecast period, with little change in 2010 and longer–term appreciation at roughly the rate of inflation. Although average house prices in California rose sharply between May and August (after losing more than 40 percent of their value from the peak in early 2006), this does not appear to signal a long–term trend. Distressed properties—such as foreclosures and homes that are not in foreclosure but can only be sold at a significant loss—are expected to be a problem for several years. As a result of the weak economy and continued problems with these properties, we expect building permits to rebound only partially from their extraordinarily low level of 2009. New construction will improve in 2010, but will remain low by historical standards, and the out–years of our forecast project a modest level of activity that is comparable to the early and middle 1990s.

FO_JG_HousePrices.ai

Unemployment Gradually Declines. Figure 4 illustrates our forecast of job growth in the state. Our forecast shows employment declining through the first quarter of 2010. After two quarters of basically flat numbers of jobs, growth in employment resumes in the fourth quarter. As a result, 2010 adds a modest 32,000 jobs, or 0.2 percent. For the remainder of the forecast period, we project that job growth slightly outpaces population growth. This very slow improvement in job markets suggests that the current recovery will resemble the recovery of the early 2000s. Job growth at that time was low by historical standards—under 2 percent a year. In contrast, the 1990s recovery saw job growth rates at about 4 percent.

FO_JG_JobGrowth.ai

Personal Income Growth Is Below Long–Term Trend. Our forecast reflects sustained increases in personal income over the forecast period, but at levels that are below typical long–term growth rates for the state. In 2010 and 2011, personal income is expected to increase slowly, gaining 2.1 percent and 3.9 percent respectively. From 2012 though 2015, personal income increases at an average of 5.3 percent.

These data reflect our modest expectations for the recovery in California. An annual growth rate of 5.3 percent is about a half percentage point below what we consider a typical growth rate for the state’s economy over the long run. The relatively weak national recovery compounded by the state’s housing woes combine to keep California’s long–term economic prospects below the long–run trend. While it is entirely possible the state economy will perform better than we project, the impetus for that growth is not evident at the current time.

Demographic Forecast

California’s population continues to grow at more than 1 percent each year. As of 2009, the state’s total population topped 38 million. The combined impact of the economic slowdown and high housing prices relative to the rest of the country will likely keep population growth to about 1 percent for 2009 and 2010. In the later years of our forecast, growth increases to about 1.2 percent annually. Figure 5 shows our forecast for the basic components of the state’s population growth.


Figure 5

The LAO’s Demographic Forecast

(In Thousands)

Estimated

Forecast

2008

2009

2010

2011

2012

2013

2014

2015

Totals (July 1st)

38,148

38,529

38,928

39,374

39,832

40,325

40,826

41,342

Change

436

381

399

446

458

493

500

516

Percent change

1.16%

1.00%

1.04%

1.15%

1.16%

1.24%

1.24%

1.26%

Births

571

583

584

586

591

597

603

610

Deaths

242

237

241

244

248

252

255

259

Net domestic migration

–135

–172

–151

–102

–90

–58

–56

–43

Net foreign migration

242

210

209

208

207

208

209

209


Birth and Death Rates Continue Long–Term Trends. As Figure 6 illustrates, birth rates for women younger than 25 have fallen over the past decade and risen for women 30 or older. These changes reflect the trend for young women to delay childbirth while they are in school and during the early years in the labor force. We project this trend to continue. Overall, total births increase slowly over the forecast period.

FO_JG_BirthRate.ai

Death rates have dropped each year since 1997 for every age group over 55. By 2007, death rates were more than a third lower than in 1990 for the 55–64 and 65–74 groups. Improvements in medical care as well as lower rates of smoking have significantly increased life expectancy over the past decade. We expect this trend to continue. Overall, births greatly exceed deaths over our forecast period. As a result, we project the underlying population trend (that is, excluding the effects of migration) results in growth of nearly 1 percent a year.

Domestic Migration. Based on available estimates from the Department of Finance, the state has experienced net outmigration in recent years, though not of the magnitude experienced during the recovery in the early 1990s. (See nearby box for a discussion of estimating issues.) Figure 7 shows estimated domestic migration since 1991 and our projection through 2015. We expect California to continue to lose population to other states throughout the forecast period. As the state’s improved job performance and housing affordability (relative to the nation) improve, however, the annual losses should diminish.

FO_JG_NetMigration.ai

Older Population Growing Fast. The overall annual growth rate of the state’s population masks wide variation in the growth of different age groups, as follows:

  • Over 65. The population over the age of 65 is projected to increase by more than 4 percent annually over the forecast period.
  • Working Age Adults. The group from age 18 to 64 is anticipated to grow at about 1 percent each year from 2009 through 2015. The “college–age group” will grow a little more slowly, at an average of 0.7 percent a year, but actually starts to contract by the end of the forecast period.
  • K–12 Students. The K–12 population is not expected to grow appreciably until 2013. By 2015, however, the annual K–12 growth rate increases to about 1 percent.

Population Estimate Is a Major Forecast Uncertainty

The federal Census Bureau estimates that migration out of California in recent years is far larger than the estimates reported by state Department of Finance (DOF). The federal data are available on an annual basis only since 2005 and only through 2007. As shown in the figure below, comparing the Census and DOF estimates for these three years reveals stark differences. The DOF estimates are significantly lower than the Census figures for all three years—the cumulative difference over the three years totals almost 370,000. These differences reflect the data sources used to estimate net domestic migration. The DOF method counts individuals who change where they live and apply for new drivers’ licenses in a new state. The Census Bureau tracks addresses as reported on federal income tax returns.

FO_PW_Migration_03.ai

The difference in migration estimates of the two agencies contributes to fairly different estimates of total California population. The DOF estimate of total population in 2008 is 38.2 million, 1.4 million (4 percent) larger than the Census figure of 36.8 million. These agencies had a similar disagreement at the end of the 1990s, when DOF also reported higher population estimates. In the end, the 2000 Census revealed that actual growth fell between the DOF and Census estimates.

Revenue Projections

The state General Fund is supported by revenues from a variety of taxes, fees, licenses, interest earnings, loans, and transfers. Almost 95 percent of the total, however, derives from the state’s “big three” taxes—the personal income tax (PIT), the sales and use tax (SUT), and the corporate income and franchise tax (CT). In this section, we summarize our updated General Fund revenue projections and provide detail behind our key revenue–related assumptions.

Revenues Are Basically On Track

Figure 8 shows our current revenue projections for the entire five–year forecast period, ending in 2014–15. Two major factors affect General Fund revenues over the forecast period. The first is the improving economy. “Baseline” General Fund revenues—the amount expected to be collected by the state before factoring in the effects of policy changes such as tax increases and accelerations—bottom out in 2009–10. Beginning in 2010–11 and 2011–12, baseline revenues increase an average of about 6.5 percent. While this is low compared to some past recoveries, it reflects the modest nature of our economic forecast for this period.


Figure 8

The LAO General Fund Revenue Forecast

(In Millions)

Revenue Source

2008–09

2009–10

2010–11

2011–12

2012–13

2013–14

2014–15

Personal Income Tax

$43,689

$46,932

$46,212

$46,305

$50,235

$54,479

$58,658

Sales and Use Tax

24,066

26,322

28,103

25,506

27,345

29,092

30,420

Corporation Tax

9,773

8,306

7,824

7,766

8,673

9,288

9,892

Other revenues and transfers

6,073

6,530

5,654

4,844

5,383

6,339

6,750

Total Revenues and Transfers

$83,601

$88,090

$87,793

$84,422

$91,636

$99,197

$105,720


The second major factor affecting revenues is the impact of policy changes made in 2008 and 2009—revenue accelerations, temporary tax increases, and permanent tax cuts. These policy changes boost revenues significantly in 2009–10 and 2010–11, but lower revenues in the out–years of the forecast. The overall effect of these measures is to smooth out the pattern of revenues—mitigating the declines in 2009–10 but flattening revenues in 2010–11 and 2011–12. Beginning in 2012–13, revenues grow slightly below typical long–term growth trends.

Current Budget’s Revenues a Little Soft

2008–09 Revenues—Down $496 Million. Figure 9 displays our assessment of General Fund revenues for 2008–09 and 2009–10 compared to the amounts assumed in the 2009–10 Budget Act. Based on preliminary data from the State Controller and the state’s tax agencies for 2008–09, we estimate that General Fund revenues and transfers totaled $83.6 billion, or $496 million (0.6 percent) below the level assumed in the 2009–10 Budget Act. The main elements of the shortfall are related to SUT (–$222 million), “other revenues and transfers” (–$230 million, mostly due to a shortfall in vehicle license fee [VLF] revenues), and PIT (–$135 million).


Figure 9

Revised LAO Revenues for 2009–10 and 2010–11
Compared With the
2009–10 Budget Act

(In Millions)

2008–09

2009–10

Revenue Source

Budget Acta

LAO

Difference

Budget Actb

LAO

Difference

Personal Income Tax

$43,824

$43,689

–$135

$47,231

$46,932

–$299

Sales and Use Tax

24,288

24,066

–222

26,684

26,322

–362

Corporation Tax

9,682

9,773

91

8,504

8,306

–199

State Compensation Insurance Fund

1,000

–1,000

Other revenues and transfers

6,303

6,073

–230

6,122

6,530

408

Totals

$84,097

$83,601

–$496

$89,541

$88,090

–$1,451

–0.6%

–1.6%

a Amounts were adjusted to reflect estimated revenues at the time of the 2009–10 budget’s enactment.

b Individual tax estimates were reduced to reflect the $3 billion reduction in revenues compared to the May Revision estimates.


2009–10 Revenues—Down $1.5 Billion. While the economy appears to be on the mend, General Fund revenues are still falling somewhat short of the 2009–10 budget assumptions. We project a $1.5 billion fall in General Fund revenues and transfers in 2009–10—a 1.6 percent reduction from the $89.5 billion level assumed in the 2009–10 Budget Act. The single biggest factor relates to the assumption in the enacted budget that the state could realize $1 billion in 2009–10 from the sale of insurance policies administered by the State Compensation Insurance Fund. The State Insurance Commissioner has opposed the sale in court, which makes it unlikely the sale will occur in the near term. Given the legal questions raised about the sale and the lack of a concrete sale plan to date, we do not include revenue from this proposal in our forecast.

After adjusting for this $1 billion, other revenues are down by $451 million. The big three taxes all are projected to decline somewhat. Personal income tax revenues are projected to fall $299 million (0.6 percent), as both withholding and estimated payments for the first quarter of 2009–10 were below targets. Our forecast also reflects the continuing weakness in consumer spending, with sales tax revenues falling short by $362 million (1.4 percent). Corporate tax revenues also fall by $199 million (2.3 percent). The softness in the state’s major taxes is offset somewhat by higher–than–expected collections from the insurance tax, oil royalties, and other minor sources.

Difficult Revenue Picture Over Next Two Years

2010–11 Revenues Stay Flat. Our economic forecast shows the rebound from the recession gaining some momentum in 2010–11. Our baseline revenues for the year grow by 6.4 percent. Our forecast, however, projects a $296 million decline (0.3 percent) in General Fund resources. This basically flat revenue picture for 2010–11 is caused by a reduction in revenues from state policy changes that were made as part of the last two budget acts, which increased revenues on a one–time or limited–term basis only. Specifically, the $4.5 billion increase generated by economic growth is offset by a reduction of $4.6 billion as the temporary impact of previous revenue accelerations, limits on CT credits and deductions, and other policy changes disappears.

2011–12 Revenues—Further Declines. This pattern of revenue growth resulting from stronger economic performance that is offset by expiring policy changes continues in 2011–12. In fact, our forecast shows a net decline of $3.3 billion in General Fund revenues, for a total of $84.2 billion. Our forecast shows baseline revenue growth increasing $5.5 billion in 2011–12, or 6.9 percent from the previous year. This growth, however, is overwhelmed by the loss of $9 billion in policy–induced changes. Chief among these changes are the expiring temporary tax increases in the PIT, SUT, and VLF.

Revenue Growth Returns Beginning in 2012–13

2012–13 Through 2014–15—“Trend” Growth. We project that revenues will increase at rates that are typical during times of sustained economic growth throughout the remainder of our forecast period. By 2012–13, the effects of the various expiring revenue increases and accelerations will have run their course, and sustained growth in revenues will begin again. Over the next three years, revenue growth averages about 7 percent. The significant uptick in 2012–13 revenues is due, in part, to the addition of $1.8 billion in new revenues from the restoration of the federal exemption for state estate taxes (see box on page 23). Given the large federal budget deficit, however, restoration of the state exemption is subject to considerable uncertainty.

Federal Tax Policies Affect Forecast

Our estimates include General Fund revenues that the state would receive because of the expiration of two federal tax provisions during the forecast period. Under existing federal law, reductions in personal income taxes and estate taxes that were enacted in the early 2000s sunset in 2011. Expiration of these provisions would indirectly increase state revenues. Because our forecast is based on the assumption that existing law determines the level of revenues and expenditures in future years, our revenue estimates are affected by these sunsetting provisions.

Accelerating Capital Gains. We project that the expiration of lower federal tax rates on capital gains will result in taxpayers accelerating capital gains realizations. In 2011, capital gains tax rates are slated to increase to 21 percent, up from 15 percent. While this increase has no direct effect on state tax rates, the advent of a higher tax on capital gains income likely will induce some taxpayers to sell assets earlier than they would otherwise (in order to take advantage of the lower rates in 2010). Recognizing this possibility, our forecast shifts $400 million in state capital gains revenues to 2010 from 2011. On net, however, we do not expect any significant increase in state revenues from this change.

Reestablishing the Estate Tax and State Exemption. A 2002 federal law phases out estate taxes so that, by 2010, the estate tax is eliminated entirely. In 2011, however, this provision sunsets, and estate tax laws revert back to the 2001 law. As a result, tax rates will return to their 2001 levels, exemptions on the size of estates that are subject to the tax will decline significantly from those in place in 2010, and the state “pickup” tax exemption will be restored. This pickup tax reduces federal estate taxes by the amount of state taxes levied on each estate, up to a certain level. As a result, many states—including California—set state tax levels at the maximum exemption level under federal law. Our forecast includes $840 million in 2010–11 to reflect a half–year effect of the state pickup feature. Beginning in 2011–12, our forecast includes about $1.8 billion annually due to this provision.

Detail on Individual Revenue Sources

Below, we provide additional details on our forecasts for the state’s three largest taxes, which are summarized in Figure 10.

FO_PW_StateTax_05.ai

Personal Income Tax

We estimate PIT revenues will increase from its 2008–09 level of $43.7 billion to $46.9 billion in 2009–10. For the next two years, though, revenues level off at about $46 billion—as personal income gains of about 4 percent each year are offset by the effects of prior accelerations and the end of temporary tax increases. In the final three years of our forecast, economic growth (about 6 percent annual personal income growth) results in PIT revenues increasing an average of 8 percent each year.

Capital Gains. The “wild card” of this forecast is our projection of capital gains income. Capital gains are both notoriously volatile and concentrated among the highest income taxpayers (who pay the highest average tax rates). Figure 11 shows capital gains as a proportion of personal income. As the figure illustrates, the swings in capital gain realizations are substantial, resulting in multibillion reductions in PIT revenues when a recession strikes.

FO_JG_CapitalGains.ai

Some level of capital gains remain even in the worst economic times. At the bottom of the “dot–com bust” in 2001 and 2002, capital gains equaled about 2.5 percent of personal income. The dramatic reduction in PIT revenues in 2008–09 suggest that capital gains were even lower. We forecast taxable capital gains to remain limited and bottom out at around 2 percent of total personal income from 2009 to 2011. We see few pressures pushing asset prices higher over this period other than the small uptick in 2010 stemming from the scheduled change in the federal tax treatment of capital gains (see box). Revenues from capital gains improve in the later years of our forecast, but at relatively modest levels.

Recent PIT Changes. Policy changes also affect PIT revenues significantly, particularly in 2009–10 and 2010–11:

  • Tax Increases. Two tax increases were enacted in 2009—a 0.25 percentage point increase in each marginal tax rate and a reduction in the dependent credit. Both are in effect for the 2009 and 2010 tax years only. We estimate these tax increases generate $2.9 billion in the current year and $2.2 billion in the budget year.
  • Other Changes. One–time revenue accelerations passed as part of the 2009 budget agreement, which increase 2009–10 PIT revenues an estimated $1.4 billion.

Sales and Use Tax

Estimated SUT receipts totaled $24.1 billion in 2008–09, a difference of 0.3 percent, or $222 million lower than the level assumed in the 2009–10 Budget Act. In the current year, we expect SUT receipts to improve to $28.2 billion, or a 6.8 percent ($1.8 billion) increase from the prior year—reflecting the temporary 1–cent increase. The increased tax rate ends on June 30, 2011, which results in a drop of SUT revenues of $2.6 billion (9.2 percent) to $25.6 billion in 2011–12. For the remainder of the forecast period, SUT revenues are expected to increase at an average annual rate of about 6 percent.

Taxable Sales. The main determinant of SUT receipts is taxable sales. The SUT is levied on purchases of tangible personal property. About two–thirds of taxable sales result from retail spending by consumers, including a significant portion on light vehicles and trucks. The remaining one–third come from the purchase of building materials involved in new building construction and business–to–business transactions, where a business is the item’s final consumer.

The weakness in housing and vehicle sales in 2009 plays a major role in our estimated 16 percent decline in taxable sales for the year. Underlying these trends is high unemployment and a relatively high savings rate that is reducing overall consumption. We forecast 2009 to be the bottom of this cycle, with sales showing modest growth beginning in the fourth quarter. There is downside risk to this forecast, however, if year–end holiday spending does not improve from 2008.

In 2010, we expect the recovery to spur a 6.8 percent growth in taxable sales. Housing and new car sales will increase significantly in 2010, but will remain far below the levels experienced in 2007. Baseline taxable sales under our forecast in 2011 and 2012 increase at about 8.5 percent, as the state economy enters a more robust stage of the recovery. Sales in the final years of our forecast grow at about 6 percent annually as growth levels off somewhat over the remainder of the forecast period.

Corporate Income Taxes

We estimate CT receipts for 2008–09 totaled $9.8 billion, an 8 percent decline from the previous fiscal year. Due to the slow recovery and policy changes enacted by the Legislature, we project CT receipts will continue to fall in 2009–10 and 2010–11. Corporate tax revenues bottom out in 2011–12, falling to $7.8 billion. Starting in 2012–13, CT collections rebound significantly, reaching $8.9 billion, or an increase of 12 percent. After this initial strong rebound, however, growth rates average about 6 percent in the final two years of our forecast period.

Corporate Profits. The single most important factor underlying CT receipts is the level of corporate profits. Corporate profits, in turn, reflect national and international economic conditions. Our forecast assumes that 2008–09 was the “bottom” in terms of corporate profits. We expect profits to improve somewhat in the current budget year, growing 5.4 percent. In 2010–11 and 2011–12, the state and national economies strengthen, and CT profits grow rapidly, increasing 12 percent and 9 percent respectively. Profits in the final years of our forecast grow at about 6 percent each year.

Policy Changes Reduce Long–Term Revenues. As with the PIT and SUT, policy changes made over the past two budget acts also play a major role in our forecast. Figure 12 illustrates the impact of policy changes on actual and projected CT revenues. In 2008–09, revenue increases from policy changes softened what would have been a major reduction in CT revenues. These changes, discussed below, increased CT collections by $1.8 billion in 2008–09 and $700 million in 2009–10.

FO_PW_CorpTax_04.ai

Beginning in 2010–11, the 2008–09 policies, plus new changes that were part of the 2009–10 Budget Act, reduce CT revenues. We estimate CT revenues will be about $1.2 billion lower each year once the changes are fully phased in. The major policy changes include:

  • Revenue Accelerations. The Legislature enacted several measures to collect revenues earlier, which temporarily increases the state’s cash flow (without increasing tax liabilities). These accelerations include collecting fees from limited liability companies at the beginning rather than the middle of the fiscal year, and changes in the required minimum payments that companies make throughout the year.
  • “Net Operating Loss” (NOL) Deduction. Legislation passed in 2008–09 suspends the NOL deduction for large companies in tax years 2008 and 2009. The change also expands the ability of all corporations to take advantage of the NOL deduction beginning in 2010.
  • Credits. Legislation also limits some credits and creates new credits in the CT program. In 2008 and 2009, this legislation limits the amount of business–related tax credits corporation may use to 50 percent of its tax liability. The measure also allows corporations to share these credits with other related companies beginning in 2010, which increases the value of these credits to some entities. Legislation also established several new temporary tax credits, including an employment credit and a credit for qualified film production.
  • New Single Sales Factor. The 2009–10 Budget Act includes a new “single sales factor” option, which gives multi–state corporations a new method to determine its California taxable profits beginning in 2011. Under the new law, corporations may elect to determine its California profits based on the existing formula (based on the proportion of California sales, workforce, and property) or solely on the proportion of sales made in California.

Chapter 3

Expenditure Projections

In this chapter, we discuss our General Fund expenditure estimates for 2008–09 and 2009–10, as well as our projections for 2010–11 through 2014–15. Figure 1 shows our forecast for major General Fund spending categories for all of these years. Below, we first discuss projected general budgetary trends and then discuss in more detail our expenditure projections for individual major program areas.


Figure 1

Projected General Fund Spending for Major Programs

(Dollars in Millions)

Estimates

Forecast

AverageAnnual Growth From

2008–09

2009–10

2010–11

2011–12

2012–13

2013–14

2014–15

2010–11 to 2014–15

Education

K–14—Proposition 98

$34,150

$35,977

$36,706

$34,907

$38,725

$41,801

$44,410

4.9%

Proposition 98 QEIA

450

450

450

450

264

CSU

2,099

2,275

2,579

2,576

2,576

2,576

2,576

UC

2,244

2,449

2,752

2,749

2,749

2,749

2,749

Student Aid Commission

897

972

1,086

1,163

1,236

1,309

1,390

6.4

Health and Social Services

Medi–Cal

12,833

11,752

14,075

16,568

17,418

18,310

19,249

8.1

CalWORKs

1,947

1,995

2,714

3,277

3,511

3,672

3,507

6.6

SSI/SSP

3,637

2,979

3,066

3,151

3,235

3,323

3,414

2.7

IHSS

1,588

1,535

1,622

1,885

2,024

2,173

2,332

9.5

Developmental Services

2,544

2,506

2,831

3,192

3,380

3,582

3,802

7.6

Mental Health

1,928

1,801

1,933

2,056

2,095

2,137

2,182

3.1

Other major programs

3,777

3,240

3,563

3,747

3,849

3,954

3,990

2.9

Corrections and Rehabilitation

9,527

8,941

9,795

9,868

10,383

10,620

10,821

2.5

Judiciary

2,209

425

2,049

2,043

2,043

2,043

2,043

–0.1

Proposition 42 Transfer

1,332

1,536

1,800

1,608

1,376

1,467

1,544

3.8

Proposition 1A Loan Costs

37

32

1,999

Infrastructure Debt Servicea

4,901

6,005

6,988

7,560

8,115

9,206

9,649

8.4

Other Programs/Costsb

6,143

4,861

8,149

8,852

9,448

9,820

10,155

5.7

Totals

$91,758

$89,251

$102,196

$105,684

$114,612

$119,193

$124,077

5.0%

Percent change

–2.7%

14.5%

3.4%

8.4%

4.0%

4.1%

a Assumes voter approval of $11.1 billion of general obligation water bonds in November 2010.

b In 2009–10, billions of dollars of one–time spending reductions are reflected in this category (as well as other categories of spending). As one–time spending reductions expire, costs in this category rise in 2010–11 and thereafter.


General Fund Budget Trends

2009–10 Outlook

General Fund expenditures are forecast to decline from $91.8 billion in 2008–09 to $89.3 billion in 2009–10—a decline of 2.7 percent. This is much less than the budgeted 7.6 percent decrease in expenditures that was expected in July—due principally to our projection that several major departments and programs, such as Medi–Cal and the prison system, are unable to achieve budgeted reductions and that there will be an increase in the Proposition 98 funding guarantee. General Fund expenditures in 2009–10 are billions of dollars below their normal levels due to one–time or temporary actions, including (1) the use of about $10 billion of federal stimulus funds, (2) over $3.6 billion of local government funds benefiting the state under the provisions of Proposition 1A (2004) and a fund shift related to redevelopment agencies, (3) over $1 billion from state employee furloughs that end on June 30, 2010, and (4) over $900 million from delaying the June 30, 2010 state payroll by one day.

Expenditure Growth During the Forecast Period

Sharp Growth in 2010–11 as One–Time Savings Measures Expire. In 2010–11, our forecast shows General Fund spending climbing by 14.5 percent. This is principally the result of billions of dollars of one–time savings measures expiring, as summarized above. For example, the California Work Opportunity and Responsibility to Kids (CalWORKs), Medi–Cal, the university systems, the California Department of Corrections and Rehabilitation (CDCR), and other programs’ expenditures rise due in large part to the exhaustion of federal stimulus funds that have reduced spending for those programs over the previous two fiscal years. We forecast that debt service costs will climb as expenses related to the voter–approved 2006 bond package rise. In contrast, the state’s General Fund payments toward the Proposition 98 minimum school funding guarantee rise only 2 percent in 2010–11.

Much Smaller Growth Projected After 2010–11. Our forecast shows General Fund spending growing by 3.4 percent in 2011–12, 8.4 percent in 2012–13, 4 percent in 2013–14, and 4.1 percent in 2014–15. As shown in Figure 1, this equates to an average annual growth rate of 5 percent between 2010–11 and 2014–15—roughly in line with the forecast rate of personal income growth in the state during that period. After 2011–12, as the economy continues its expected recovery, the General Fund’s expenditure drivers change significantly. Whereas Proposition 98 spending from the General Fund shows modest growth in 2010–11 and a decline in 2011–12 with the expiration of the temporary tax increases, it grows by an average of 8.4 percent per year between 2011–12 and 2014–15. The growth of health and social services programs, however, slows significantly during this same period, with Medi–Cal growing at an average of 5.1 percent per year between 2011–12 and 2014–15 and CalWORKs and Supplemental Security Income/State Supplementary Program (SSI/SSP) growing by under 3 percent per year. Due in part to the stated legislative policy of having no automatic cost–of–living adjustments (COLAs) or inflation adjustments for programs, our forecast (as discussed in more detail in Chapter 1) shows no growth in General Fund appropriations to the universities or the courts after 2010–11.

In the sections that follow, we provide a more detailed discussion of the expenditure outlook for individual major program areas.

Proposition 98—K–14 Education

(View a brief video summary of our forecast for Proposition 98.)

State spending for K–14 education—K–12 education and the California Community Colleges—is governed largely by Proposition 98, passed by the voters in 1988. Proposition 98 obligations are funded from the state General Fund and local property taxes and account for about two–thirds of total support for K–14 education.

Proposition 98 Forecast. Figure 2 shows our projections of the Proposition 98 minimum guarantee (or funding requirement) throughout the forecast period. For 2009–10, we project an increase in the Proposition 98 minimum guarantee of approximately $1 billion above the July budget appropriation. In 2010–11 and 2011–12, we project consecutive years of decline in the Proposition 98 funding requirement. Over the last three years of the forecast period, we project increases in the Proposition 98 minimum guarantee—with funding returning to pre–recession levels by 2013–14. Our forecast of local property tax revenues largely parallels our Proposition 98 forecast—two years of decreases in local property tax revenues with several years of increases at the end of the forecast period. The state begins 2009–10 with an $11.2 billion maintenance factor obligation. By the end of the forecast period, we estimate the state will still owe $7.6 billion in outstanding maintenance factor obligations.


Figure 2

Proposition 98 Forecast

(Dollars in Millions)

2009–10

2010–11

2011–12

2012–13

2013–14

2014–15

Minimum Guarantee

General Fund

$35,977

$36,706

$34,907

$38,725

$41,801

$44,410

Local property tax

15,406

14,343

14,150

14,335

14,702

15,260

Totals

$51,383a

$51,049

$49,057

$53,060

$56,502

$59,670

Percent change

–0.7%

–3.9%

8.2%

6.5%

5.6%

Proposition 98 "Test"

2

2

3

2

2

2

Maintenance factor created/paid (+/–)

–$2,108

–$823

$2,622

–$2,467

–$1,135

–$679

Underlying Forecast Factors (Percent Growth)

K–12 average daily attendance

–0.27%

0.05%

0.24%

0.41%

0.48%

0.38%

CCC full–time equivalent students

1.40

0.90

0.80

0.60

0.60

0.50

Per capita personal income (Test 2)

0.62

–2.30

0.99

2.71

3.85

4.01

Per capita General Fund (Test 3)

6.03

0.10

–4.47

8.63

6.56

5.62

Funding Relative to Baseline Costs

Year–to–year change

$630.2b

–$1,991.6

$4,002.9

$3,387.4

$3,064.1

K–14 COLA—Percent

–0.35%

1.62%

1.67%

1.92%

2.28%

K–14 COLA—Cost

–$178.3

$841.0

$817.2

$1,013.7

$1,274.0

K–14 attendance

116.9

181.3

234.5

280.3

264.8

Difference

$691.6

–$3,013.9

$2,951.3

$2,093.5

$1,525.3

a Reflects revised estimate of Proposition 98 minimum guarantee.

b Assumes projected increase in the 2009–10 minimum guarantee is used for one–time purposes in 2009–10 and is available for ongoing purposes in 2010–11.


Current–Year Minimum Guarantee On the Rise

Increase in Current–Year Funding Requirement of $1 Billion. One of the major drivers of the Proposition 98 forecast is General Fund revenues. While the enacted 2009–10 Budget Act reflected fairly accurate final 2008–09 tax revenues, Proposition 98 calculations used May estimates that did not capture a large fall off of revenues in the year‘s closing months. Consequently, actual General Fund tax proceeds will be about $2 billion lower than the figures used for the 2008–09 Proposition 98 calculations. In addition, our estimates of tax proceeds in 2009–10 are $400 million lower than budget estimates. Although these changes reflect a further deterioration of state revenues, they actually increase the Proposition 98 minimum requirement in 2009–10. This is because the Proposition 98 calculation is determined in part by the year–to–year change in state revenues. The larger drop in revenues in 2008–09 compared to 2009–10 results in a higher rate of revenue growth. This higher growth rate, in turn, results in a $1 billion increase in the Proposition 98 minimum guarantee.

Three Options for Addressing Increase in 2009–10 Minimum Guarantee. Considering the volatility and unpredictability of the state’s revenues, the Legislature likely will want to wait until revised revenue estimates are released next May before taking further 2009–10 action. Assuming that our forecast holds, the Legislature has various options for addressing the increase in the 2009–10 minimum guarantee.

  • Pay Now. The state could provide the additional $1 billion at the end of 2009–10 in a lump sum. Given the state’s huge budgetary shortfall, however, even greater reductions would have to be made to other state programs to free up the resources to provide the additional funds to K–14 education.
  • Create Settle–Up, Pay Later. Rather than paying this fiscal year, the Legislature instead could recognize a “settle–up” obligation and create an out–year payment plan (for example, paying $200 million annually over five years, beginning as early as 2010–11). Creating a settle–up obligation would provide a near–term budget solution to the state (as it would allow the state to postpone the $1 billion payment) but no long–term benefit (as it would not reduce the base for calculating the 2010–11 Proposition 98 requirement and would necessitate out–year settle–up payments).
  • Suspend Guarantee. Alternatively, the Legislature could suspend the Proposition 98 minimum guarantee and maintain the existing funding level. This would achieve $1 billion in 2009–10 budget solution and, because a suspension reduces the base for calculating the 2010–11 minimum guarantee, an additional $4 billion in cumulative solutions over the forecast period. It would, however, result in a future maintenance factor obligation of $1 billion. (The extra $1 billion obligation likely would not need to be paid during the forecast period.) This option would not reduce the amount of funding schools expected to receive based on the enacted 2009–10 budget.

Next Two Years Suggest Additional Reductions

Minimum Guarantee Projected to Decrease in 2010–11 and 2011–12. Assuming the state fully funds the Proposition 98 minimum guarantee in 2009–10, we project a small decrease in the funding requirement in 2010–11, with a larger drop in 2011–12. The 2011–12 drop is largely a result of projected declines in state revenues due to the phase–out of the temporary tax increases adopted as part of the February 2009 budget agreement. Prior reductions to education spending in 2008–09 and 2009–10 were tempered by the flow of $6 billion in federal funding from the American Recovery and Reinvestment Act (ARRA), which helped prevent additional reductions to school district budgets. Thus, if the state funds at the minimum level in 2010–11 and 2011–12 and does not “backfill” these ARRA funds, K–12 school districts and community colleges would face even more difficulty as they also are experiencing decreases in federal funding.

Growth Once the Economy Rebounds

Strong Growth for 2012–13 Through 2014–15. For the remaining three years in the forecast period, we project significant increases in the Proposition 98 minimum guarantee due to stronger General Fund revenue growth. By 2013–14, the minimum funding requirement would return to pre–recession levels. As the bottom part of Figure 2 shows, during the latter three years of the forecast period, the year–to–year increases in the Proposition 98 funding level would be more than sufficient to fund annual COLAs.

Higher Education

(View a brief video summary of our forecast for Higher Education.)

In addition to community colleges (which are discussed above as part of the Proposition 98 forecast), the state’s public higher education entities include the University of California (UC), the California State University (CSU), and the California Student Aid Commission (CSAC).

UC and CSU Expenditures

Our forecast assumes the universities’ operating costs will be roughly even at about $5.3 billion over the course of the forecast period. This amount is substantially higher than state spending in 2009–10, which takes advantage of one–time federal stimulus funds that offset state costs. We discuss the stimulus funds in more detail below.

Link Between State Funding and Enrollment Has Been Disrupted. In previous years, the state budget specified a level of student enrollment for UC and CSU that the Legislature expected would be accommodated with budgeted resources. For the past two years, however, the state budget has not specified university enrollment levels, instead giving the universities flexibility to adjust their enrollment to match available resources. Both university systems have indicated that they plan to reduce their enrollment for the next few years (see nearby box). Moreover, we project that underlying college–age population growth will slow to about zero by the end of the forecast period. For these reasons, we do not project any state augmentations for enrollment growth during the forecast period.

Universities Plan Enrollment Reductions

Both the University of California (UC) and the California State University (CSU) are reducing enrollment in response to budget constraints. Each system has already reduced fall 2009 freshman admissions, and CSU is eliminating spring 2010 admissions—primarily affecting community college transfer students. The UC has expressed its intent to maintain freshman admissions at their current level and increase transfer admissions for 2010–11, but these plans will no doubt evolve as the fiscal year takes shape. The CSU plans significant reductions in the tens of thousands for 2010–11 freshman and transfer admissions. In addition to employing traditional enrollment management tools, one CSU campus has announced that it will no longer provide a local admission guarantee to qualified applicants from its region.

Fees Projected to Continue Rising. A significant portion of core operating costs at the universities is covered by student fees. The state has no expressed policy for annual adjustments to these fees, which are set by the universities’ governing boards. For 2009–10, UC raised student fees by 9.3 percent, and at the time this report was prepared the Regents were considering a midyear increase of an additional 15 percent. By comparison, the CSU raised its student fees by 32 percent for 2009–10. Recent actions and statements by the universities suggest that student fees will continue to increase for the next few years. We assume that these fee increases will cover various new costs, such as inflation and expansion of institution–based financial aid programs, that are not covered in our General Fund forecast.

Expanded federal, state, and institutional student aid programs will offset a significant proportion of fee increases, particularly for financially needy students. However, uncertainty about future fee levels, as well as “sticker shock” from higher fees, may discourage some from even applying for admission.

Federal Funds Provided One–Time Budget Solution. The Governor vetoed $255 million from each of the universities’ 2009–10 General Fund support, with the expectation that this funding would be replaced with one–time federal stimulus funding. The 2009–10 budget also included additional one–time reductions of $50 million for each university, linked to the availability of federal stimulus funding. We assume that these two cuts, totaling $305 million for each university, would be restored to the universities’ base General Fund support in 2010–11. We assume that the remainder of the federal stimulus funding received by the universities was used to backfill 2008–09 reductions (and therefore does not need to be restored in 2010–11). We also assume that other base reductions made to the universities are ongoing, rather than one–time.

Key Choices Facing Legislature. Given that state General Fund resources are likely to be severely constrained for the next several years, the Legislature faces key questions with regard to the higher education budget.

  • How Much Enrollment Should Be Accommodated? The state’s Master Plan for Higher Education directs UC and CSU to accept all eligible applicants in the top one–eighth and one–third of high school graduates, respectively. The number of applicants depends upon a variety of factors, including the number of high school graduates, the cost of attendance, and alternative options such as employment. As discussed above, it is unclear how much enrollment the state budget currently is expected to fund. It is also unclear how the segments’ enrollment decisions interact with one another. The Legislature may wish to provide direction to the universities in this regard.
  • How Much Should Higher Education Cost? As noted above, the universities are likely to be increasing student fees at double–digit annual rates for at least the next several years. Not only does this affect the cost of education for students, it also increases state costs for the Cal Grant financial aid programs. The Legislature may wish to provide direction to the universities with regard to the share of education cost that non–needy students should be expected to pay.
  • How Should the Universities Reduce Operating Costs? Recent budget constraints have spurred the universities to consider a variety of cost–savings measures, including some designed to increase efficiency. The Legislature may wish to express expectations with regard to efficiency efforts such as student–faculty ratios, student remediation rates, articulation of course sequences, student assessment and placement, caps on number of course units to be subsidized by the state, use of summer session, and other considerations.

CSAC

Cal Grant Programs. Most of the state’s direct General Fund support for student financial aid is directed through the Cal Grant programs, which provide fee coverage and subsistence grants to eligible students. These costs increase with expanded program participation and fee increases. Based on these factors, we project that Cal Grant costs will increase from $1 billion in 2010–11 to $1.3 billion at the end of the forecast period.

Health

California’s major health programs provide health coverage and additional services for various groups of eligible persons—primarily poor families and children as well as seniors and persons with disabilities. The federal Medicaid program, known as Medi–Cal in California, is the largest state health program both in terms of funding and number of persons served. In addition, the state supports various public health programs, substance abuse treatment, community services and state–operated facilities for the mentally ill and developmentally disabled, and health care insurance for children through the Healthy Families Program (HFP).

Phase–Out of Enhanced Federal Match. One factor that increases state costs for some health care programs over the forecast period is the phase–out of the enhanced federal medical assistance percentage (FMAP) provided under ARRA. Historically, the state and federal government share most Medi–Cal costs on a roughly equal basis. However, ARRA temporarily increased the federal share for California to almost 62 percent for benefit costs beginning in October 2008 and continuing through December 2010. When the enhanced FMAP ends, it will reduce federal funding for programs in the departments of Health Care Services, Developmental Services, Mental Health, and Social Services, among others. Our forecast assumes that the reductions in federal funding will be backfilled with General Fund spending. Notably, this has the effect of increasing the year–over–year percentage growth in General Fund spending for these programs during the phase–out period.

While ARRA is in effect, the state is required to maintain its eligibility levels and procedures that were in place as of July 1, 2008. Our forecast assumes no such changes in eligibility.

We discuss other major federal funding changes that could affect the state’s major health programs in the nearby box.

Two Major Proposals Could Have Broad Impact On Health Programs

Two major proposals currently under consideration could have a major effect on state health program expenditures. First, Congress is debating nationwide health care reform legislation that could significantly overhaul the health care system. Among the issues being considered are a potential expansion of the Medicaid program, changes to reimbursement to providers for services, and mandates that individuals obtain insurance coverage. Second, a Medicaid waiver which restructured the state’s hospital financing system expires on August 31, 2010. The Department of Health Care Services, together with stakeholders is developing a waiver renewal request. Depending on the structure of the new waiver, it could have wide policy and fiscal implications for the state’s Medi–Cal Program. Due to the uncertainty as to whether federal health care reform legislation will be enacted, as well as regarding the final terms of the waiver, we have not incorporated the effects of these proposals into our forecast.

Medi–Cal

We estimate that General Fund spending for Medi–Cal local assistance in the current year will amount to almost $11.8 billion, or about 8 percent, more than appropriated in the 2009–10 Budget Act. We project that General Fund support will grow to $14 billion in 2010–11, a 19 percent increase from current–year expenditures, and will reach $19.2 billion by the end of the forecast period in 2014–15. The three biggest factors contributing to the projected spending growth are: (1) changes in the FMAP discussed above that result in the need for the state to backfill lost federal funds with General Fund over the next two fiscal years; (2) increases in caseload, utilization of services, and rising costs for those services; and (3) the erosion of some budget savings assumed in the 2009–10 budget plan.

Key Program Cost Drivers. A significant forecast factor is our assumption that the cost per person of Medi–Cal health care services will grow at an average rate of 4.5 percent annually. We also project that the overall Medi–Cal caseload will grow nearly 2 percent annually commensurate with increases in the state population and other underlying trends, but that the aged and disabled caseload will grow faster during the projection period.

Erosion of Assumed Budget Savings. The 2009–10 budget plan assumes $1 billion in General Fund savings from the receipt of additional federal funds and obtaining additional flexibility to reduce program costs. The budget plan also includes an unspecified reduction in Medi–Cal local assistance of $323 million from the General Fund. Our forecast assumes that $500 million in savings from federal flexibility will be achieved due to expected (1) federal approval of amendments to the current hospital waiver program and (2) adjustments that would increase the federal funding the state would receive under a current waiver program for family planning services. However, we assume that none of the $323 million unspecified reduction will be achieved.

Developmental Services

We estimate that General Fund spending for developmental services in 2009–10 will total about $2.5 billion. This is $138 million more than the amount appropriated in the 2009–10 Budget Act in order to backfill Public Transportation Account (PTA) funds with General Fund due to a court decision that PTA funds cannot be used to pay for regional center (RC) transportation costs.

We project that General Fund support will grow to more than $2.8 billion in 2010–11, almost a 13 percent increase from current–year expenditures, and will reach $3.8 billion by the end of the forecast period in 2014–15. This projected growth is largely due to increased caseload, utilization of services, and rising costs for those services, as well as the phase–out of the enhanced FMAP rate provided under ARRA. Our forecast assumes that RC caseloads will grow at an average annual rate of 4.2 percent, and that costs overall will grow at an average annual rate of 7.6 percent.

HFP

We estimate that $323 million from the General Fund will be spent for support of HFP in 2009–10. An additional $81 million provided by the California Children and Families Commission brings total state support for the program in 2009–10 to $405 million. (We assume these are one–time monies only.) We estimate that General Fund spending for HFP will grow to $431 million in 2010–11 and reach $543 million by the end of our forecast period in 2014–15. Chapter 157, Statutes of 2009 (AB 1422, Bass), raises $97 million in revenues from an assessment on managed care plans. While these revenues are deposited in the General Fund, they are intended to offset HFP costs.

Enrollment Rebound Expected. In 2009–10, HFP initially faced a significant shortfall due to reductions in state funding, and the program was closed to new enrollment for two months. Funding was largely restored by September 2009, but the program closure resulted in a steep decline in enrollment. We project that enrollment will largely rebound throughout 2009–10, and caseload will continue to grow throughout the forecast period.

Other Cost–Drivers. Our forecast assumes increased costs for provision of health care due to general growth in medical costs, but does not account for potential further increases in costs associated with implementation of the U.S. CHIP Reauthorization Act of 2009 (CHIPRA). Although the act contains several provisions which may increase state costs, such as requirements for new and enhanced services, there is considerable uncertainty at this time regarding what specific actions will be required of the state in order to comply with CHIPRA.

Social Services

California’s major social services programs provide a variety of benefits to its citizens. These include income maintenance for the aged, blind, or disabled; cash assistance and welfare–to–work services for low–income families with children; protecting children from abuse and neglect; providing home–care workers who assist the aged and disabled in remaining in their own homes; and subsidized child care for families with incomes under 75 percent of the state median. Although state departments oversee the management of these programs, the actual delivery of many services at the local level is carried out by county welfare and child support departments. Most social services programs are supported by a mix of state, federal, and county funds. (In the box below, we also discuss the rising General Fund costs of the federal–state unemployment insurance program.)

California’s Other Budget Deficit: Unemployment Insurance

The Unemployment Insurance (UI) program is a federal–state program that provides weekly UI payments to eligible workers who lost their jobs through no fault of their own. The UI program is financed by unemployment tax contributions paid by employers for each covered worker.

Insolvency. As we discussed in our 2009–10 Budget Analysis Series: General Government, the UI fund is currently insolvent. In its most recent fund forecast, the Employment Development Department (EDD) projects that the fund will experience a year–end deficit of $7.4 billion in the 2009 calendar year, rising to $18.4 billion in 2010 and $27.2 billion in 2011.

Federal Loans. Because of the insolvency, EDD obtains federal loans on a quarterly basis to cover projected fund deficits. To date, the state has borrowed about $4 billion, permitting California to make benefit payments to UI claimants without interruption. Federal loans lasting more than one year generally will accumulate interest charges of about 5 percent per year on the outstanding balance.

Temporary Federal Relief. The federal economic stimulus package enacted earlier this year, the U.S. American Recovery and Reinvestment Act, relieves states from making interest payments for UI loans through December 31, 2010. The EDD estimates that the waived interest costs are about $120 million for 2009 and $560 million for 2010. After December 2010, the state must resume making interest payments. The EDD also estimates that the interest amount due in September 2011, for nine months of interest accruing from January 2011 through September 2011, is about $730 million.

Addressing the Insolvency. To restore solvency, the state must increase employer taxes, reduce benefits, or do some combination of the two. The Governor introduced a proposal in November 2008 to restore solvency to the UI fund largely through tax increases and very modest benefit reduction. In addition, two bills were introduced earlier this year to address the insolvency. However, no such legislation has been enacted so far in 2009.

Budget Forecast. Absent corrective action, the UI fund will remain insolvent for the foreseeable future, and interest costs will continue to grow significantly—to about $1.5 billion by the final year of our forecast, 2014–15. Under federal law, these interest charges may not be paid from the UI fund. Our forecast assumes that these interest payments become a General Fund cost beginning in 2011–12.

Overall Spending Trends in Social Services. Based on current law requirements, we project that General Fund spending will increase from a revised $8.8 billion in 2009–10 to $11.8 billion in 2014–15, an increase of $3 billion. About $1 billion of this increase is attributable to backfilling federal funds from ARRA with support from the General Fund. Most of the remaining $2 billion increase is attributable to caseload growth in CalWORKs, In–Home Supportive Services (IHSS), and SSI/SSP.

Costs of Providing COLAs. If the Legislature elected annually to provide the discretionary California Necessities Index COLAs for social services benefits, total General Fund costs in 2014–15 would increase by about $600 million. This approach would provide an additional $367 million to CalWORKs, $166 million to SSI/SSP, and $67 million to Foster Care. Similarly, if the Legislature elected to provide the counties, which administer most of these programs, with annual inflationary adjustments, total General Fund costs in 2014–15 would increase by about $375 million. The cumulative costs of these COLAs are relatively low compared to prior years because we anticipate that inflation will remain modest during the forecast period.

CalWORKs

Overall Spending Trends. From an estimated 2009–10 spending level of $2 billion, we project that General Fund support for CalWORKs will increase by over $600 million in each of the next two fiscal years. Spending is expected to increase modestly for two more years and then decline in the final year of the forecast, 2014–15, to a total of $3.5 billion. The $1.5 billion spending increase over the forecast period is largely attributable to three factors: (1) backfilling federal ARRA funds, (2) caseload growth, and (3) the fixed federal Temporary Assistance for Needy Families (TANF) block grant, which does not adjust for caseload increases. The Legislature made substantial short– and long–term policy changes, as discussed below. Their fiscal effects are reflected in the forecast.

Backfill for Loss of Federal Funds. Because federal support for CalWORKs from the TANF Emergency Contingency Fund (ECF) ends in September 2010, the forecast assumes a backfill of about $430 million from the General Fund in 2009–10, increasing to about $580 million in 2011–12. (The ARRA authorized the ECF, which provides 80 percent funding for increases in grant costs.)

Caseload Costs Affected Mainly by Economic Conditions. The forecast reflects some significant assumptions about how the CalWORKs caseload and the state’s economy will change during the next five years. During 2008–09, the caseload increased by about 8 percent and was forecasted to increase by 14 percent in 2009–10 as the state suffered a severe recession. More recent monthly trends suggest that the caseload growth rate may have peaked as of December 2008. For this reason, we forecast a caseload increase of about 10 percent during 2009–10, with a gradual decline in the growth rate in the subsequent years as the state’s economy improves, followed by an outright decline in caseload in 2014–15.

State, Rather Than Federal Government, Bears Caseload Costs. Although General Fund support for CalWORKs is only $2 billion in 2009–10, total program costs, including federal funds, are approximately $6 billion. Once the ARRA funding expires in September 2010, each 1 percent increase in caseload results in state costs of about $60 million per year, because the TANF block grant is fixed.

Short–Term Policy Changes. For 2009–10 and 2010–11, the Legislature (1) exempted families with very young children or families with two or more preschool children from work participation requirements and (2) reduced associated county block grants for employment services and child care by $375 million. Our forecast reflects complete restoration of these reductions in 2011–12 and provides some “ramp–up” funds during 2010–11 for these activities.

Long–Term Changes. Commencing in 2011–12, the Legislature created a system of (1) shortened time limits for most families on aid, (2) increased sanctions, and (3) new county service obligations for families affected by these new policies. The net impact of these changes is very hard to estimate, but our forecast assumes net savings of about $200 million annually beginning in 2011–12.

SSI/SSP

State expenditures for SSI/SSP are estimated to amount to nearly $3 billion in 2009–10. We project that General Fund support for SSI/SSP will increase by about $85 million each year, reaching $3.4 billion in 2014–15.

Caseload Driven Heavily by Aging Population. The spending increases that we project in SSI/SSP are primarily due to expected caseload growth ranging from 1.9 percent to 2.3 percent annually. In our forecast, the primary driver of the caseload increase is the anticipated growth of the aged population.

IHSS

For 2009–10, we estimate that General Fund spending for IHSS will be about $1.5 billion, roughly $300 million above the appropriation. We project that General Fund support for IHSS will increase to $1.6 billion in 2010–11 and to over $2.3 billion in 2014–15.

Backfill for Loss of Federal Funds. The projected increase in General Fund support for IHSS is due in large part to the expiration of the ARRA relief funds (discussed above in the “Health” section of this chapter). Specifically, as ARRA relief ends in December 2010, the forecast assumes a General Fund backfill of $183 million in 2010–11, increasing to $366 million in 2011–12.

Court Cases Reducing Estimated Savings. Budget legislation for 2009–10 reduced state participation in provider wages and restricted eligibility and program services. However, a federal judge has blocked the implementation of these measures. As a result, we assume no savings from these budget reduction measures in the current year. We assume the state addresses the issues raised in the litigation and is able to achieve these savings beginning in 2010–11. However, we assume that these policies will be implemented beginning in fall 2010 and result in about $200 million in General Fund savings in 2010–11, growing to about $240 million as of 2011–12.

Antifraud Savings Likely Lower Than Assumed. Budget legislation included several antifraud activities that were estimated to result in General Fund savings of $162 million (about 10 percent of program costs) in 2009–10. Based on our knowledge of the program and the implementation to date of these changes, our forecast assumes that about 25 percent, or about $40 million, of the savings are achievable in the budget year.

Judiciary and Criminal Justice

The major state judiciary and criminal justice programs include support for two departments in the executive branch—the CDCR and the Department of Justice—as well as expenditures for the state court system.

CDCR

(View a brief video summary of our forecast for Corrections)

Our forecast assumes that General Fund spending for the support of CDCR operations will increase from $8.9 billion in 2009–10 to $10.8 billion in 2014–15. The projection reflects actions taken to reduce correctional spending in the 2009–10 budget and additional costs to staff and operate new prison facilities that are expected to be constructed during the forecast period.

As discussed below, we estimate that state spending on corrections will be about $1.4 billion higher than the budgeted amount for 2009–10, primarily due to the erosion of planned savings and increased expenditures for inmate medical care.

Full Budget Savings Not Achievable. The 2009–10 budget assumed about $1.2 billion in savings in CDCR’s budget from various policy actions to reduce the inmate and parole populations (such as by increasing the credits that inmates can earn to reduce their stay in prison), as well as from other administrative and programmatic changes. Our forecast assumes that slightly less than half of the $1.2 billion in savings will be realized in the current year. This is primarily due to implementation delays and the absence of a complete plan to achieve the full level of savings. Moreover, our forecast also assumes that a separate $231 million reduction in the 2009–10 budget to the federal Receiver’s medical services operations will not be achieved as planned.

General Fund Offsets Were One–Time Budget Solutions. As part of the 2009–10 budget package, one–time federal stimulus funds were used to offset $358 million in General Fund costs for state prisons. Similarly, funding from a local government finance shift will offset $588 million in state prison costs in 2009–10. Our forecast assumes that the General Fund will replace the total of $946 million in one–time offsets from these two funding sources in the budget year and future years.

Ongoing Operating Costs Projected to Increase. In 2008–09, $487 million was provided from the General Fund on a one–time basis for increased contract medical expenditures for inmates, such as for specialty medical care provided outside of prison. Based on the level of contract medical costs in recent years and the absence of a detailed plan to control such costs in future years, we assume that the prior–year level of contract medical spending will be maintained during the forecast period.

Chapter 7, Statutes of 2007 (AB 900, Solorio), authorizes the construction of thousands of additional prison beds. Our projections assume that about 15,800 additional prison beds will be constructed pursuant to AB 900 during the forecast period, resulting in an estimated $800 million in additional General Fund expenditures to staff and operate the new facilities. As the new facilities are built, the Legislature will need to make policy and budgetary decisions regarding the level of programming and staffing to be provided at these facilities, which will determine the actual increase in operational costs.

Impact of Pending Litigation Not Included in Projections. On August 4, 2009, a federal–three judge panel issued a ruling requiring the administration to provide a prison population plan to the court that will reduce the inmate population to 137.5 percent of design capacity—which is roughly 40,000 inmates—within two years. Although the administration submitted an inmate reduction plan on September 18, 2009, the court rejected that plan and on October 21, 2009 ordered that a revised plan be submitted within 21 days. Given that the three–judge panel has not specifically ordered a reduction in the inmate population at this time, and that the administration continues to appeal the panel’s orders in court, our forecast does not reflect the savings that could result from such a massive population reduction. If the inmate population were to be reduced to 137.5 percent of design capacity, we estimate that annual General Fund expenditures could decline by about $600 million in 2014–15 relative to our baseline forecast for CDCR, depending on the specific actions taken to reduce the population. This estimate takes into account the population reduction proposals approved as part of the 2009–10 budget package and the new prison facilities that are expected to be constructed in the forecast period.

Inflationary Adjustments Not Included in Projections. As discussed earlier in this report, our forecast assumes no price adjustments for CDCR operating expenses. If the Legislature were to provide such adjustments each year, we estimate that the department’s operating expenditures would increase by about $490 million annually by the end of the forecast period, relative to our baseline projections.

Judicial Branch

General Fund spending for the support of the judicial branch is projected to remain relatively flat at roughly $2.4 billion from 2010–11 through 2014–15. This amount, however, is substantially higher than the amount the state will spend in 2009–10. As part of the 2009–10 budget package, funding from a local government fund shift will offset about $1.5 billion in General Fund costs for the courts in the current year. Our forecast assumes that the General Fund will replace the $1.5 billion in the budget year and future years.

Inflationary Adjustments Not Included in Projections. As discussed earlier in this report, our forecast assumes no inflationary adjustments to the operating budget of trial courts. If the Legislature were to provide such adjustments, we estimate that operating expenditures for trial courts would increase by roughly $200 million annually by the end of the forecast period, relative to our baseline projections.

Other Programs

Employee Compensation

The 2009–10 Budget Act assumes over $2.5 billion in cost reductions from various actions affecting state employee pay and benefit costs, including state employee furloughs and a one–day delay in the June 30, 2010 state payroll. Almost all of these savings are one–time in nature, including the Governor’s furlough program, which ends June 30, 2010.

Future State Employee Costs to Be Decided by Policymakers. Our forecast assumes virtually no growth in employee costs through 2014–15 (similar to our treatment of COLAs and inflation adjustments elsewhere in the forecast). Many factors make it difficult to project future employee compensation costs at this point in time. New labor agreements with state employee bargaining units, however, could increase costs for compensation. An adverse court ruling on the legality of the furlough program or the changes in overtime and holiday policies could result in judgments of hundreds of millions of dollars. On the other hand, action by the Governor and/or the Legislature to (1) extend the furlough program, (2) lay off a significant number of state employees and curtail the services they currently provide, or (3) cut state employee salaries could reduce annual General Fund costs in the hundreds of millions of dollars.

Public Employee Retirement Costs

Our forecast reflects an increase in the state’s annual payments to four major public employee retirement programs: pension programs for state and CSU employees, the teachers’ pension program, state and CSU retiree health benefit programs, and pension programs for judges. (The teachers’ pension program is administered by the California State Teachers’ Retirement System [CalSTRS], and the other three programs are administered by the California Public Employees’ Retirement System [CalPERS].) The state’s required contributions to CalPERS for state and CSU pensions are about $3 billion (all funds) in 2009–10. In our forecast, these payments to CalPERS grow to over $4 billion during the forecast period. The General Fund pays just under 60 percent of these costs. The state’s required payments to CalSTRS are estimated to be $1.2 billion in 2009–10, all of which is paid from the General Fund. We forecast that these payments to CalSTRS grow to $1.7 billion in 2014–15—in part to restore the system’s funding level due to the effects of the large drop in stock and other investment values that affected all pension systems in 2007 and 2008. The state’s retiree health contributions to CalPERS are forecast to grow from $1.3 billion in 2009–10 to $2 billion in 2014–15.

Rate–Setting Method, State Payroll, and Stock Prices Drive CalPERS Costs. Our forecast assumes that CalPERS continues to use its current pension rate–setting methodology. Several years ago, after the value of its investments fell 22 percent between 2000 and 2002, CalPERS chose to spread higher state and local government payments over many more years. Due to the system’s huge investment declines in 2007–08 and 2008–09, the CalPERS board already has decided to delay payments even further for local governments. The board is expected to decide whether to delay payments for the state at its December 2009 meeting. This decision could mitigate our projected payment increases in some years of the forecast. Our forecast, however, assumes no significant increase in state payroll during the forecast period. Since pension contributions are based on a percentage of payroll, salary increases for state employees would increase pension contributions above our forecast. The forecast also assumes that CalPERS meets its annual investment return target of about 8 percent each year.

Unfunded Liabilities Will Persist. The state’s retirement programs are expected to have significant unfunded liabilities of over $100 billion combined for much or all of the period through 2014–15. Based on current law, the state will be making payments on these unfunded liabilities each year in our forecast. The lingering unfunded liabilities will contribute to rising costs over the long term as well.

No Additional State Payments for UC Retirement Programs Assumed. Consistent with past funding practices, our forecast assumes no additional state contributions between 2009–10 and 2014–15 to cover costs of UC’s pension and retiree health programs. Both have unfunded liabilities, and currently, no significant contributions are being paid by UC or its employees to the pension program. Unless UC identifies non–state funding sources for these programs soon, their costs will escalate significantly over the long term.

Debt Service on Infrastructure Bonds

The General Fund incurs debt–service costs for both principal payments and interest owed on two types of bonds used to fund infrastructure—voter–approved general obligation bonds and lease–revenue bonds approved by the Legislature. We estimate that General Fund costs for debt service on infrastructure bonds will be $6 billion in 2009–10 and $7 billion in 2010–11. The relatively high pace of debt–service growth in the forecast period—projected to be 8.4 percent annually between 2010–11 and 2014–15—is due in part to the increase in bond sales from the large general obligation bond authorizations in 2006 and 2008, as well as the start of issuance of AB 900 lease–revenue bonds for the prison system. Our forecast assumes the planned sale schedule of bonds that have already been authorized, including the recently approved water bonds (which still require voter approval).

Debt–Service Ratio (DSR) Expected to Rise. The DSR for infrastructure debt—that is, the ratio of annual General Fund debt–service costs to annual General Fund revenues and transfers—is often used as one indicator of the state’s debt burden. There is no one “right” level for the DSR. The higher it is and more rapidly it rises, however, the more closely bond raters, financial analysts, and investors tend to look at the state’s debt practices, and the more debt–service expenses limit the use of revenues for other programs. Figure 3 shows what California’s DSR has been in the recent past and our DSR projections for the forecast period.

FO_Diego_02.ai

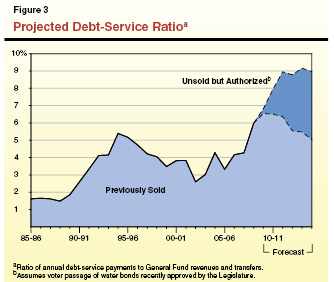
The DSR we are projecting—over 9 percent at its peak—is considerably higher than it has been in the past. In part, this reflects the sharp, recent fall–off in General Fund revenues, which drives up the ratio for a given level of debt service. To the extent additional bonds are authorized and sold in future years beyond those already approved, the states debt–service costs and DSR would be higher than projected in Figure 3.

Acknowledgments

The Legislative Analyst's Office (LAO) is a nonpartisan office which provides fiscal and policy information and advice to the Legislature.

LAO Publications

To request publications call (916) 445-4656. This report and others, as well as an E-mail subscription service, are available on the LAO's Internet site at www.lao.ca.gov. The LAO is located at 925 L Street, Suite 1000, Sacramento, CA 95814.


Return to LAO Home Page