Legislative Analyst's Office, January 1996
 |
Child Abuse and Neglect in California
Part II |
-
- Most Child Abuse/Neglect Cases Are Closed After Initial Intake
- Proportion of Abuse/Neglect Reports "Screen Out" Varies Among Counties
- Counseling and Crisis Intervention Are the Most Common Services
- Fewer Children in the CWS Program Are Receiving Family Maintenance Services
- Types of Foster Care Placements
- Foster Care Occupancy Rates Are Below Capacity
- Foster Care Caseloads Increasing
Spurred by the failure of the CWS system to address
the needs of abused and neglected children, the federal
government enacted the Adoptions Assistance and Child Welfare Act of
1980. This act required states to enact specific reforms as a condition
for receiving federal funds. In 1982, California incorporated
various reforms into state law through the enactment of Chapter
978, Statutes of 1982 (SB 14, Presley). The major goals of Chapter
978 were to (1) reduce unnecessary foster care placements by
providing treatment services to families, (2) safely reunify foster
care children with their families, (3) increase the stability of foster
care placements, and (4) place more foster care children into
adoptions when appropriate.
County welfare departments administer the CWS
Program under statutes and regulations established by the state.
Nevertheless, there is some variation among the counties in how
they operate their CWS Programs. This variation may be partly due
to differences in demographics, administrative structure, or the
child welfare philosophy of the county.
Currently, much data about the CWS cases are unavailable
on a statewide basis. However, state law requires the
implementation of a single statewide CWS case management system. This
system -- scheduled for completion in October 1997 -- is designed
to provide a statewide data base, case management tool, and
reporting system for the program.
Most Child Abuse/Neglect Cases
Are Closed After Initial Intake
1994
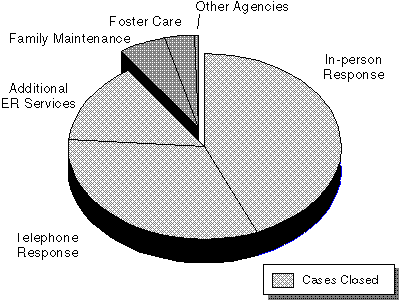
- In 1994, 664,294 children were served by the Emergency
Response (ER) component of the CWS Program.
- Of those ER cases, 90 percent were closed after initial intake
services were provided. These cases were closed out because the social
worker determined that either: (1) an in-person investigation was
unnecessary after conducting a telephone assessment ("screened out")
(32 percent), (2) services were unnecessary after conducting an
in-person investigation (44 percent), or (3) the case could be closed
after additional ER services (crisis intervention, counseling) had been
provided (14 percent).
- Those cases that were not closed out were continued as ongoing
cases or transferred to other agencies. The ongoing cases consist of
those transferred to the Family Maintenance component of the CWS
Program or to foster care.
Proportion of Abuse/Neglect Reports
"Screened Out" Varies Among Counties
1994
- As part of the Emergency Response component, counties are
required to screen -- by use of telephone assessments -- reports of child
abuse/neglect to determine whether an in-person investigation is
necessary. A statewide guideline for screening reports exists in order to
assist the counties and facilitate uniformity.
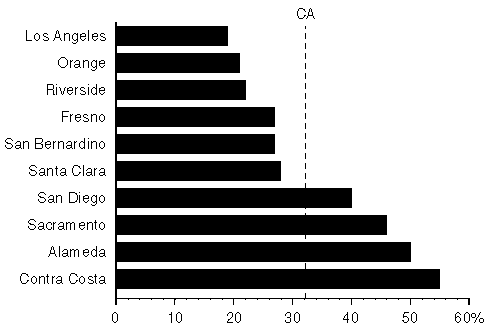
- The percentage of reports "screened out" varies substantially
among the counties. In 1994, for example, Los Angeles County
"screened out" about 19 percent of reports, compared to 55 percent in
Contra Costa County. Some of the variation among counties may be due to
a lack of specificity in the state guideline, thereby allowing counties
to adopt different screening policies.
- Overall, the proportion of reports that are "screened out"
statewide has increased from 24 percent in 1990 to 32 percent in 1994.
Counseling and Crisis Intervention
Are the Most Common Services
January 1993
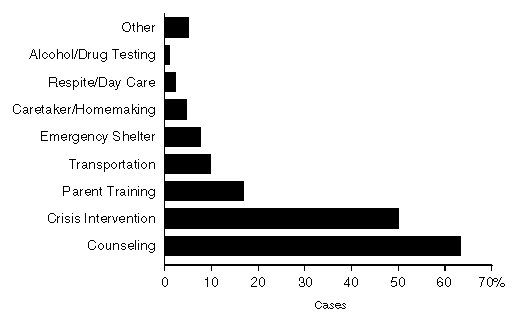
- Children and families in the CWS Program receive a broad array
of services including crisis intervention, counseling, parent training,
transportation, and substance abuse testing.
- In January 1993, the most common support services provided
through the Emergency Response and Family Maintenance components
were counseling (63 percent of cases) and crisis intervention (50 percent
of cases). Counseling includes activities such as psychiatric
services; crisis intervention includes such services as assistance to families
in need of housing.
Fewer Children in the CWS Program Are
Receiving Family Maintenance Services
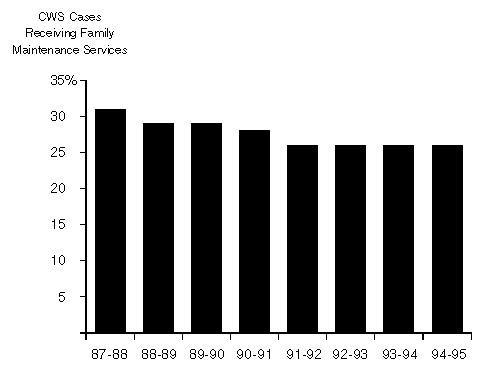
- Fewer children in the CWS Program are receiving services in the
home. Specifically, in 1987-88, 31 percent of children who were in the
CWS Program received family maintenance services, compared to 26
percent in 1994-95. This means that a higher proportion of children
are receiving services outside of their homes through the use of
foster care placements.
- This trend is probably due to several factors. We noted in our
1992 report on child abuse, for example, that social workers reported a
lack of external support services such as drug treatment, which limited
the number of children who could be served effectively by the
Family Maintenance program. Another potential factor is that a higher
proportion of children with more severe problems may be entering
the CWS Program.
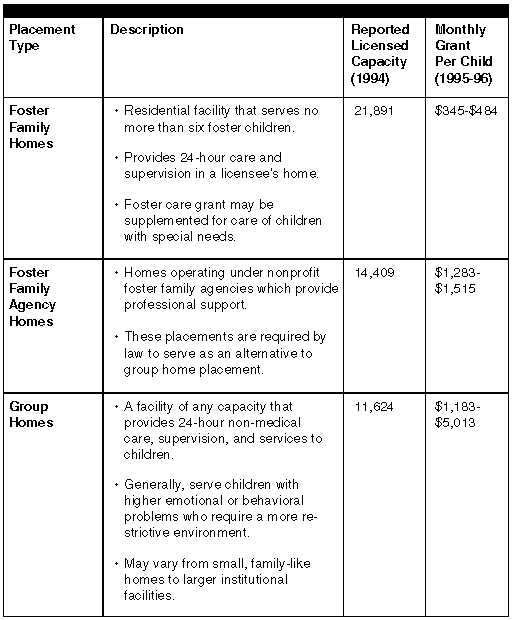
Types of Foster Care Placements
Foster Care Occupancy Rates Are Below Capacity
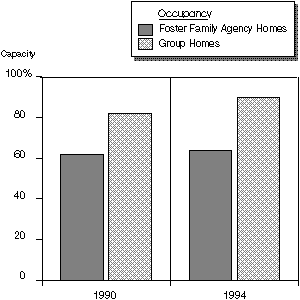
- Between December 1990 and December 1994, the occupancy rate
for foster family agency homes increased slightly, from about 62
percent to 64 percent, while the group home occupancy rate increased
from 82 percent to 90 percent.
- While the data suggest that there is still unused placement
capacity statewide, individual counties may still lack appropriate homes
for foster care children because the availability of different
placement options varies among the counties.
Foster Care Caseloads Increasing
In Thousands
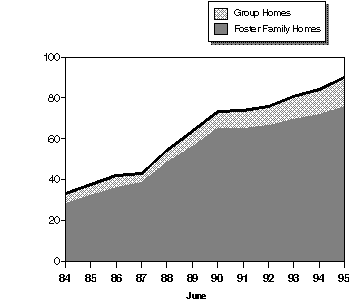
- Foster care caseloads have increased from about 33,000 in June
1984 to 90,000 in June 1995, representing a 170 percent increase. The
average annual increase was 10 percent.
- The sharp increase during the late 1980s and the slowdown since
1991 corresponds to trends in the number of reports of child
abuse/neglect received during the same period. The slower
growth since 1991 may be partly due to an increase in the counties' share
of AFDC-Foster Care costs, which gave counties a greater incentive
to contain expenditures.
- The proportion of children placed in group homes increased
from about 12 percent in June 1984 to 14 percent in June 1995.
Return to the Table of Contents
Continue to Part III, The Child Welfare Services System Part B
Return to Part I, Introduction
Return to LAO Home Page


