
Budget and Policy Post
March 11, 2024California’s Low-Wage Workers and Minimum Wage
Who Are California’s Low-Wage Workers?
In this post, we describe some demographic and economic characteristics of California’s low-wage workers. We use the term “low-wage workers” to refer to employees who made up to $17.50 per hour at their main job in 2023. These workers likely would be affected directly by proposals to increase the statewide minimum wage.
Limitations of Survey-Based Estimates. Like many economic measurements, our estimates come from survey data. The estimates in the first section come from the 2023 Occupational Employment and Wage Survey (OEWS), which collected information about employment and wages in May 2022 and used an employment cost index to update wage estimates to the first quarter of 2023. The estimates in the other sections come from the January 2023 through December 2023 monthly Current Population Surveys (CPS). As described in the Appendix, various aspects of the data make our estimates imprecise, though we have tried to make them as accurate as possible.
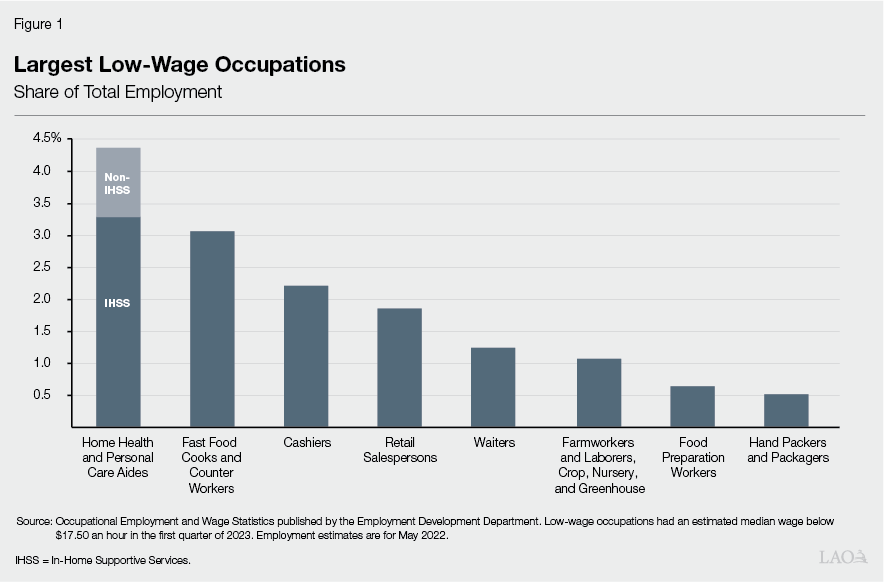
Largest Low-Wage Occupations
Definition of “Low-Wage Occupation.” We define low-wage occupations as occupations with a median hourly wage no greater than $17.50 per hour. Linking this definition to the one laid out above, most—but not necessarily the vast majority—of the workers in each low-wage occupation are low-wage workers.
Largest: Home Health and Personal Care Aides. As shown in Figure 1, the state’s largest low-wage occupation consists of home health and personal care aides, who make up more than 4 percent of the state’s overall workforce. We estimate that three-quarters of home health and personal care aides work as providers in the state’s In-Home Supportive Services (IHSS) program. IHSS provides personal care and domestic services to low-income individuals to help them remain safely in their own homes and communities. In most cases, recipients of IHSS benefits are responsible for hiring and supervising their own IHSS providers—oftentimes family members or relatives.
IHSS providers’ wages are determined through collective bargaining with county governments. As of February 2024, IHSS provider wages in many counties exceeded $18 per hour. Nevertheless, the OEWS estimates suggest that the median wage for home health and personal care aides was below $17.50 per hour in 2023. (As discussed in the Appendix, OEWS wage measurements are not very precise.)
Second-Largest: Fast Food. In 2023, fast-food cooks and counter workers were the state’s second-largest low-wage occupation. As we noted in another post, a new law will raise many of these workers’ wages to $20 per hour on April 1, 2024. After that law goes into effect, fast-food workers very likely will not be a low-wage occupation as defined above.
Mostly In-Person Services. As shown in Figure 1, many of the largest low-wage occupations involve the provision of services in close physical proximity to customers. These customer interactions can affect workers in a variety of ways. One of the risks of being a “frontline worker”—exposure to respiratory disease—became especially salient in the initial years of the COVID-19 pandemic.
Low-Wage Workers’ Basic Demographics
Low-Wage Workers Roughly Half Men, Half Women. As shown in Figure 2, a very slight majority of California’s low-wage workers are women. In contrast, a slight majority of mid-to-high-wage workers are men.
Most Low-Wage Workers Are Latino. The number of low-wage workers who are Latino is roughly two and a half times the number who are white, four and a half times the number who are Asian/Pacific Islander, and 18 times the number who are Black.
Racial/Ethnic Distribution Roughly Similar for Men and Women. Figure 2 shows that Latino and white low-wage workers are roughly half men and half women. The estimates suggest that women likely make up substantial majorities of Black and Asian/Pacific Islander low-wage workers, though these comparisons are less precise due to the smaller sizes of these groups.
Many Low-Wage Workers Are Immigrants. Most low-wage workers were born in the United States. That said, more than 40 percent of low-wage workers immigrated to the U.S. from other countries, whereas just one-third of mid-to-high-wage workers are immigrants.
Half of Latino Low-Wage Workers Are Immigrants. As shown in Figure 2, the share of low-wage workers who are immigrants varies substantially by race/ethnicity. Half of Latino low-wage workers are immigrants. Most white and Black low-wage workers were born in the U.S. A substantial majority of Asian/Pacific Islander low-wage workers are immigrants. Nonetheless, the number of Latino immigrant low-wage workers is three times the number of Asian/Pacific Islander immigrant low-wage workers.
Low-Wage Workers’ Household Structures
Most Low-Wage Workers Are Not Married. As shown in Figure 3, a slight majority of low-wage workers have never been married, while slightly more than one-third are currently married. For mid-to-high-wage workers, these numbers are reversed: a slight majority are currently married, while slightly more than one-third have never been married. Roughly 10 percent of both groups are divorced, separated, or widowed.
Most Low-Wage Workers Live With at Least One Other Worker. Compared to mid-to-high-wage workers, low-wage workers are much less likely to live in households with exactly two workers and much more likely to live in households with three or more workers. Roughly three-quarters of low-wage workers live with at least one other worker. Strikingly, around 40 percent live with at least two other workers. (Most of these households include multiple generations of related workers.) Just one-quarter of low-wage workers are the sole wage earner in the household. We suspect that low-wage workers’ high likelihood of living in three-earner (or more) households might be due largely to California’s high housing costs. (We further examine housing affordability for minimum-wage workers in another post.)
Most Low-Wage Workers Have No Minor Children. Figure 3 shows that most low-wage workers live in households without any children under 18. Roughly 20 percent live with one child, 15 percent with two children, and fewer than 10 percent with three or more children. The numbers for mid-to-high-wage workers are similar.
Roughly 10 Percent of Low-Wage Workers Are Sole Breadwinner With Children. Combining information about the presence of other workers and children in the household, we see that roughly 10 percent of low-wage workers are the only wage earner in a household with at least one child under 18. Most of these sole breadwinners have one or two children.
Low-Wage Workers’ Educational Attainment
Most Low-Wage Workers Did Not Go to College. As shown in Figure 4 below, most low-wage workers did not attend college. Roughly one-quarter have some college education but do not hold a bachelor’s degree. In contrast, roughly three-quarters of mid-to-high-wage workers attended college, and half hold a bachelor’s degree.
Among Low-Wage Workers, Women More Likely to Have Gone to College Than Men. Low-wage workers’ educational attainment varies by gender. Roughly half of female low-wage workers attended college and roughly one-fifth hold bachelor’s degrees. In contrast, just over one-third of male low-wage workers attended college and one-eighth hold bachelor’s degrees. Among mid-to-high-wage workers, gender differences in educational attainment are somewhat similar but less pronounced.
Low-Wage Workers’ Weekly Hours
Half of Low-Wage Workers Work Full-Time. As shown in Figure 5, roughly half of low-wage workers work at least 40 hours per week at their primary jobs. (In the CPS, roughly 4 percent of California’s low-wage workers indicate that they hold multiple jobs. Some research suggests that CPS respondents likely underreport independent contracting work.) Weekly hours among part-time low-wage workers vary substantially, with many working less than half-time and many others working nearly full -time.
Among Low-Wage Workers, Men More Likely to Work Full-Time Than Women. Roughly 60 percent of male low-wage workers work at least 40 hours per week, compared to roughly 45 percent of female low-wage workers. Among mid-to-high-wage workers, gender differences in weekly hours are somewhat similar but less pronounced.
Differences in Weekly Hours Amplify Earnings Inequality. Figure 5 shows that mid-to-high-wage workers are much more likely to work full-time than low-wage workers. As a result, the gap between these groups’ weekly earnings is wider than the gap between their hourly wages.