
 Report in PDF
LAO Report
October 10, 2023Achieving the Goals of the SB 678
County Probation Grant Program
Executive Summary
State Created Performance‑Based Incentive Program for County Probation to Achieve Three Goals. Chapter 608 of 2009 (SB 678, Leno)—also known as the Community Corrections Performance Incentives Act of 2009—established a performance‑based incentive grant program intended to achieve three primary goals related to county probation: (1) reduce the rate at which people on felony probation were sent to state prison, (2) create state savings, and (3) improve public safety. In order to achieve these goals, SB 678 required that a portion of the state savings created when fewer people on felony probation are sent to prison be provided to counties through a performance‑based formula. It also required the funds be used to support evidence‑based practices—meaning practices shown to be effective at reducing criminal offending. Since the enactment of SB 678, the state has awarded a total of over $1 billion to county probation departments.
Sentencing Changes Have Impacted Probation, Resulting in Various Modifications to the SB 678 Formula. Since the enactment of SB 678, the state has implemented various sentencing changes that impacted probation in significant ways, such as by changing when people on felony probation can be sent to prison. For example, the 2011 public safety realignment made fewer people eligible for prison by shifting responsibility for lower level offenses from the state to counties. As a result of these sentencing changes, the original SB 678 formula has been frequently modified. These modifications were made in an attempt to prevent county grant awards from changing for reasons unrelated to performance.
Unclear on Extent to Which SB 678 Program Is Currently Achieving Its Goals. Our review of the SB 678 grant program indicates that the program appeared to effectively achieve its three goals in the initial years of implementation. However, significant sentencing changes and modifications to the formula over the years have made it unclear whether the program continues to achieve its goals. This is because (1) the effects of SB 678 on the prison population, state savings, and crime are difficult to distinguish from other policy changes; (2) components of the current formula do not align with the original goals of the program; and (3) it is unclear whether counties are actually implementing evidence‑based practices, which is important for achieving the goal of improving public safety. We also find that it is more challenging to use state savings to incentivize performance given the various sentencing changes affecting felony supervision. However, there continue to be state benefits from supporting evidence‑based practices at the local level.
Recommend Creating a New Funding Formula. In view of our findings, we recommend the Legislature establish a new formula for the SB 678 program to better ensure that the program’s goals are achieved. Specifically, we recommend creating a new formula with two portions: (1) a portion based on direct measures of performance and state savings and (2) a portion designed to pay for specific evidence‑based practices. This, as well as establishing additional oversight mechanisms of the program, would better ensure the program is effectively reducing failure‑to‑prison rates for those on county felony supervision, creating state savings, and improving public safety.
Introduction
The state has a clear fiscal interest in the success of county probation because people supervised by probation departments can be sent by the courts to state prison. In order to reduce admissions into state prison from people on county probation, the state enacted Chapter 608 of 2009 (SB 678, Leno) to establish the Community Corrections Performance Incentive grant program, commonly referred to as the SB 678 grant program. The program is a performance‑based incentive grant that awards county probation departments for reducing the rate at which people on county felony supervision are sent to prison, known as the “failure‑to‑prison rate.” In addition to reducing the failure‑to‑prison rate, the program is intended to generate state savings and improve public safety by incentivizing counties to use evidence‑based practices—meaning practices shown to be effective at reducing criminal offending. Since the enactment of SB 678, the state has awarded a total of over $1 billion to county probation departments to fund evidence‑based practices intended to reduce the failure‑to‑prison rate. In this report, we (1) provide background on felony sentencing, probation, and the SB 678 grant program; (2) assess whether the program is currently achieving its goals; and (3) recommend steps to help ensure the program achieves its goals.
Background
Felony Sentencing
There are three types of crimes: felonies, misdemeanors, and infractions. A felony is the most severe type of crime. A package of legislation referred to as “the 2011 public safety realignment” shifted (or realigned) the responsibility for certain felony populations from the state to counties. This resulted in the current division of responsibility for felony populations, which we describe below. (See the box below for more information on the 2011 public safety realignment.)
The 2011 Public Safety Realignment
Shifted Certain Felony Populations From State to County Responsibility. The 2011 public safety realignment was a package of legislation that shifted (or realigned) the responsibility for incarcerating and supervising tens of thousands of people convicted of certain felonies from the state to counties. (We note that the public safety realignment was part of a larger 2011 realignment that shifted various responsibilities to the counties, including responsibilities unrelated to public safety.) Prior to the realignment, the state was responsible for all people convicted of felonies, with the exception that county probation departments were responsible for supervising people convicted of a felony crime but placed on felony probation in the community instead of being incarcerated. As a result of the 2011 public safety realignment, counties became responsible for the following populations:
- People Convicted of Nonserious, Nonviolent, Non‑Sex Offenses With No Prior Convictions for Such Offenses. These people generally serve their terms in county jail or through a split sentence rather than in state prison. (A split sentence is a combination of jail and mandatory supervision in the community provided by county probation officers.) However, courts may continue to place these people on felony probation, as was done prior to realignment. A key difference under realignment is that people on felony probation for crimes no longer eligible for prison who violate the terms of their supervision are not sent to prison—unless the violation is a new prison‑eligible crime.
- People Released From Prison Whose Current Offense Is a Nonviolent and Nonserious Felony. These people are generally placed on Post‑Release Community Supervision and supervised by county probation officers rather than state parole agents.
- People Violating the Terms of Their Parole Supervision. These people are generally placed in county jail rather than state prison.
The state also realigned certain non‑General Fund revenues—namely, a set portion of sales tax—to the counties to help pay for these new responsibilities. Currently, these revenue sources provide the counties roughly $2 billion annually for the above populations.
Implemented to Reduce Prison Overcrowding, Create State Savings, and Improve Outcomes. There were three main reasons the state implemented the 2011 public safety realignment. First, the state sought to reduce prison overcrowding by reducing the number of people held in state prison. This was primarily due to a federal court order that declared that overcrowding was the primary reason why the state was unable to provide constitutionally adequate health care to people in prison. Second, the state was in the midst of a significant fiscal crisis and the broader realignment helped the state address its budget shortfall by providing counties with a dedicated revenue stream outside of the state General Fund to pay for the realigned activities, thereby reducing General Fund costs. Finally, it was thought that counties would be able to achieve better outcomes than the state for various reasons. For example, it was thought that counties could more effectively coordinate services—such as behavioral health, which was already largely a county responsibility—for the people they became responsible for.
Some Felonies Are Classified as Violent and/or Serious Offenses. Existing state law classifies some felonies as “violent” or “serious,” or both. Examples of felonies currently defined as violent include murder, robbery, and burglary of an occupied residence. While almost all violent felonies are also considered serious, other felonies—such as selling certain illegal drugs to a minor or making criminal threats of violence—are defined only as serious. Felonies not classified as violent or serious include sale of illegal drugs to adults.
Felony Convictions Can Lead to Incarceration and/or Community Supervision. People convicted of felonies are typically sentenced to one of the following:
- County Jail. People convicted of a felony who have no prior or current convictions for serious, violent, or sex offenses can be sentenced to serve their term in county jail.
- Split Sentence. Rather than a county jail sentence, courts may require people who have no prior or current convictions for serious, violent, or sex offenses to serve a “split sentence” with a portion of their sentence being in jail and a portion being in the community under “mandatory supervision” provided by a county probation officer.
- State Prison and Parole or Post‑Release Community Supervision (PRCS). Those convicted of a felony who are ineligible for county jail because of their criminal history can be sentenced to state prison. Upon release from prison, people with a current serious or violent offense are supervised in the community by state parole agents. The remainder of people released from prison are generally placed on PRCS and supervised by county probation officers.
- Felony Probation. Instead of sentencing those convicted of a felony to the typical term for their crime—such as prison, jail, or a split sentence as discussed above—a court may place someone on felony probation, depending on the person’s criminal history. People placed on felony probation are typically assigned to a county probation officer who supervises them in the community.
Community Supervision Violations Can Lead to Incarceration. People who violate the terms of their mandatory supervision, PRCS, or felony probation—we refer to these forms of supervision collectively as county felony supervision—can be punished in various ways. People on PRCS and mandatory supervision can be placed in jail for violations. People on felony probation who violate the terms of their supervision can be required to serve the typical term for their crime in prison if they are on probation for a prison‑eligible crime. Otherwise, people on felony probation can be required to serve the typical term for their crime in jail or through a split sentence for violations. People on all forms of county felony supervision can be sent to prison if they commit a new prison‑eligible crime. (People on state parole who violate the terms of their supervision can also be punished in various ways, including through incarceration.)
Role of Probation Departments in County Felony Supervision
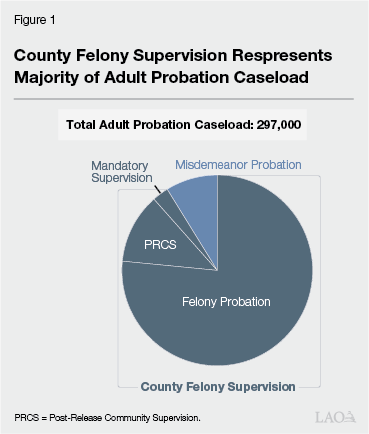
Most of the Population Supervised by Probation Departments Are on County Felony Supervision. Probation departments—overseen by a chief probation officer who, based on local practice, is appointed by either the local presiding judge or the county board of supervisors—are responsible for supervising adults on county felony supervision and misdemeanor probation, as well as all youths in the juvenile justice system. However, adults make up roughly 90 percent of probation department caseloads statewide. As shown in Figure 1, most of the adult caseload consists of people on county felony supervision. The county felony supervision population totaled about 271,000 in 2022.
Probation Departments Have Key County Felony Supervision Responsibilities. These responsibilities include:
- Investigations. Probation departments provide presentencing reports to the courts after a conviction. These reports usually detail the relevant history of the person, including prior criminal arrests and convictions, family circumstances, work experience, and educational background. The court uses these reports, which frequently include a sentencing recommendation, to make sentencing decisions for people who are convicted.
- Supervision. Probation officers are responsible for making sure that those on supervision comply with the terms of their supervision. These terms generally include avoidance of criminal activity and other requirements such as drug testing, electronic monitoring, restitution payments, community service, and participation in drug treatment or domestic violence counseling. Probation officers typically conduct home visits or meet people in the probation office, as well as review drug test results and progress reports from treatment providers. When people violate their supervision terms, the probation officer recommends an outcome to the court, which could include continuation on supervision—perhaps with stricter supervision requirements—or being sent to county jail or state prison depending on the crime and type of supervision the person is on.
- Program Referrals. The supervising probation officer typically is responsible for referring people to specific program providers in the community that are intended to help people avoid committing new crimes and improve their lives. These programs are usually operated by other county agencies or through contracts with nonprofits or private, for‑profit companies. These programs can include anger management, sex offense treatment, or substance use treatment.
SB 678 Grant Program
Senate Bill 678—also known as the Community Corrections Performance Incentives Act of 2009—established a grant program intended, among other things, to reduce the number of people on felony probation who are sent to state prison (known as the failure‑to‑prison rate). In this section, we detail the specific goals of the SB 678 grant program and discuss how the funding formula for the program has changed due to various sentencing changes that have been implemented since the program was created.
Program Goals
The SB 678 program was established to achieve three primary goals related to probation:
- Reduce Failure‑to‑Prison Rates. When the program was first established, the state was facing litigation related to prison overcrowding. One reason for the overcrowding was because counties exercised significant discretion in sending someone on felony probation to prison. Specifically, prior to the 2011 public safety realignment, probation officers could recommend that courts send anyone on felony probation to prison if they violated their terms of the supervision—even if the violation was not a new crime. On average, about 19,000 people were entering prison each year as a result of a probation failure—about 40 percent of all prison admissions at the time.
- Create State Savings. In 2009, the state faced significant budget challenges due to the Great Recession. Accordingly, it was hoped that, by encouraging counties to divert people on probation away from prison, the program could create significant state savings to help address the fiscal crisis. For each person diverted from prison, the state could avoid paying the associated costs of prison and parole.
- Improve Public Safety. Prior to SB 678, concerns were raised that probation departments were not effectively preventing people from committing crimes. This is because many probation departments reported not using or not contracting with providers that use evidence‑based practices that research has shown to be effective in reducing recidivism (criminal reoffending). (There was also uncertainty whether other criminal justice entities were utilizing evidence‑based practices.) As a result, it was unclear whether the practices they were using to prevent people from committing new crimes were effective at doing so. (For additional information on evidence‑based practices, see the nearby box.)
Evidence‑Based Practices
Definition of Evidence‑Based Practices. Broadly speaking, evidence‑based practices are specific practices that research has shown to be effective in achieving a particular outcome. In the context of probation supervision practices, this often means practices that are effective at reducing recidivism—or the rate at which people previously convicted of crimes commit new crimes. More specifically, to be evidence based, a practice must be both of the following:
- Research Based. Practices that are research based are designed to be similar to practices that have undergone rigorous evaluations showing that they reduce recidivism.
- Implemented With Fidelity. A research‑based practice that is implemented with fidelity not only is designed to be similar to a proven practice, but is also actually carried out in the same manner as the proven practice. In contrast, a practice that is designed to be similar but fails to actually be carried out in a similar manner on a day‑to‑day basis would be research based, but not implemented with fidelity. Ensuring that a practice is implemented with fidelity to a research‑based model increases the likelihood that it could successfully reduce recidivism.
Examples of Evidence‑Based Probation Supervision Practices. Some examples of evidence‑based probation supervision practices include (1) using assessments to identify a person’s risk of committing new crimes and varying supervision levels based on that assessed risk, (2) having people on supervision complete treatment programs based on their risks and needs, and (3) providing an intervention in an amount that is sufficient and that matches the characteristics of the target population. According to research, these practices have been found to result in more effective supervision, reduced recidivism, better prioritization of limited supervision resources, and reduced incarceration costs. For example, the state of Maryland evaluated its efforts of integrating risk and needs assessments into supervision and found that, when switching to a model where probation and parole officers regularly use risk and needs assessments and track people’s progress towards specific goals (such as completing treatment), the people on supervision were less likely to be rearrested for a new crime. This held true even after researchers accounted for other factors that could explain the lower numbers of crimes, such as prior criminal history.
In order to achieve these goals, SB 678 required that a portion of the state savings created by the program would be provided to counties—through the formula we describe below—specifically to support the use of evidence‑based practices. Senate Bill 678 defined evidence‑based practices as “supervision policies, procedures, programs, and practices demonstrated by scientific research to reduce recidivism” among people under local supervision. The legislation also required Judicial Council to collect and report data from county probation related to the above goals. Specifically, Judicial Council is required to annually report, for each county, failure‑to‑prison rates, the amount of state savings it was estimated to have created, and information on its use of evidence‑based practices.
Original SB 678 Funding Formula
Formula Initially Tied Funding Closely to Performance and State Savings. When SB 678 was enacted, it included a funding formula designed to tie the amount counties receive closely to (1) their ability to divert people on felony probation from prison and (2) the amount of state savings they generated by doing so. The legislation specified that the amount of savings was to be estimated by the Department of Finance (DOF), in consultation with other agencies (such as Judicial Council). As shown in Figure 2, under the original SB 678 formula, each county’s actual number of felony probation failures was compared to the number of failures it was expected to have based on its current population and the baseline felony probation failure‑to‑prison rate. The baseline for each county was calculated as the county’s average felony probation failure‑to‑prison rate in 2006 through 2008 (the three‑years before SB 678 was enacted). If the actual number of people on felony probation sent to prison in a given year was less than the expected number, the county would receive 40 percent to 45 percent of the state savings for each person diverted from prison. The state savings of $29,000 per person diverted was based on the marginal cost of prison and parole supervision and average length of stay at that time.
Figure 2
Example of Estimated State Savings Under Original
SB 678 Formula
|
County A |
County B |
County C |
|
|
Baseline Failure‑to‑Prison Ratea |
15.0% |
10.0% |
1.3% |
|
Felony Probation Population |
5,000 |
10,500 |
5,000 |
|
Expected Failures to Prison |
750 |
1,050 |
63 |
|
Actual Failure‑to‑Prison Rate |
10.0% |
8.6% |
1.2% |
|
Actual Felony Probation Failures to Prison |
500 |
900 |
60 |
|
People Diverted From Prison |
250 |
150 |
3 |
|
State Savings Createdb |
$7,250,000 |
$4,350,000 |
$87,000 |
|
aCalculated as the average felony probation failure‑to‑prison rate between 2006 and 2008. |
|||
|
bState savings were calculated at about $29,000 per person diverted from prison and parole. |
|||
Higher Performing Counties Received Larger Share of State Savings. Counties could receive a higher share of state savings if they had sufficiently low failure‑to‑prison rates (meaning that they sent fewer people on felony probation to prison). Figure 3 shows the grant amounts that the example counties in Figure 2 would have received under the original SB 678 formula. Counties with failure‑to‑prison rates near or below the statewide average—known as Tier 1 counties—received 45 percent of the savings they generated for the state. The remainder of counties that generated savings for the state—known as Tier 2 counties—received 40 percent of the savings. Alternatively, counties with very low failure‑to‑prison rates—more than 50 percent below the statewide average—could each receive a proportionate share, based on their population of adults ages 18 to 25, of 5 percent of the overall state savings created by SB 678. (The overall state savings was the sum of the savings created by each county.) Counties that chose to receive this award were ineligible for awards based on the number of people they diverted from prison. Typically, counties chose this option if their baseline failure‑to‑prison rates were already so low that it would be difficult for them to divert more people from prison.
Figure 3
Example of County Award Amounts Under Original SB 678 Formula
|
County A |
County B |
County C |
|
|
Grant Type Eligibilitya |
Tier 2 |
Tier 1 |
Tier 1 or High Performanceb |
|
Tier Grant Amountc |
$2,900,000 |
$1,957,500 |
$39,150 |
|
High Performance Grant Amountd |
Ineligible |
Ineligible |
$50,000 |
|
County Award Amount |
$2,900,000 |
$1,957,500 |
$50,000 |
|
aCounties with failure‑to‑prison rates up to 25 percent above the statewide failure rate were eligible for Tier 1. All other counties that diverted people from prison were eligible for Tier 2. Counties with failure‑to‑prison rates more than 50 percent below the statewide average were eligible for high‑performance grant awards. |
|||
|
bCounties cannot receive both a tier grant and a high‑performance grant, they choose one. |
|||
|
cTier 1 counties receive 45 percent of state savings they create. Tier 2 counties receive 40 percent of state savings they create. |
|||
|
dHigh‑performance grants are estimated as 5 percent of statewide savings divided between high‑performing counties based on their proportionate share of the population of adults 18 to 25. |
|||
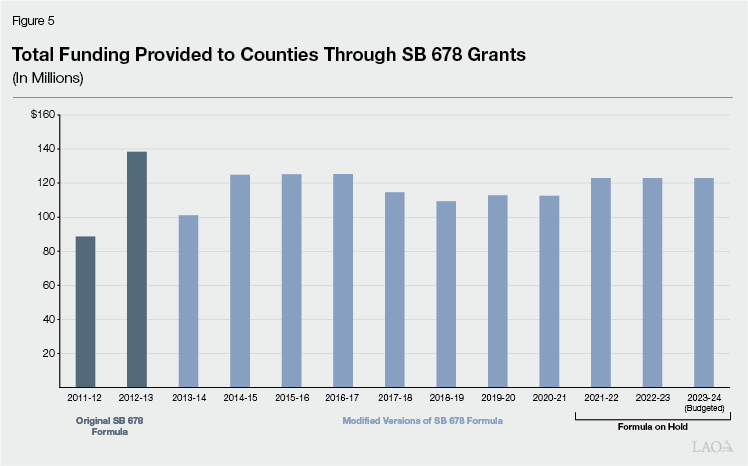
State Distributed an Average of $113 Million Annually Through Original Formula. The legislation specified that the original formula would sunset in January 2015. However, as we discuss later, this formula was only used in 2011‑12 and 2012‑13. The first payments made under the original SB 678 formula were in 2011‑12 and based on how counties performed in 2010. The average county award was about $1.5 million for a total allocation of $89 million. In 2012‑13—the last year the original formula was used—the average county award was $2.4 million for a total allocation of $138 million. Over these two years, the program distributed a total of about $227 million in grant awards.
Sentencing Changes Affecting Probation Following SB 678
Since the enactment of SB 678, the state has implemented various sentencing changes that impacted probation in significant ways. The most notable changes were the 2011 public safety realignment and Proposition 47 (2014). As we discuss in the subsequent section, the original SB 678 formula was modified to account for the expected impacts of these sentencing changes.
2011 Public Safety Realignment Reduced Eligibility for Prison. The 2011 public safety realignment made fewer people eligible for prison by shifting responsibility for lower level offenses from the state to counties. Specifically, as a result of the realignment, generally only people with current or prior felony convictions for serious, violent, or sex offenses could be admitted to prison. This meant that people on felony probation could only be sent to prison for violating the terms of their supervision if they were on felony probation for a prison‑eligible offense and/or committed a new prison‑eligible offense while on probation.
Impact of Realignment on SB 678 Grant Formula. The 2011 public safety realignment’s limit on who can be placed in prison was expected to artificially increase SB 678 grants to counties beginning in 2013‑14, the third year of the formula’s implementation. This would be problematic as the increase would have been unrelated to county performance.
Proposition 47 Converted Various Felonies to Misdemeanors. Proposition 47, which was approved by voters in November 2014, changed certain crimes from felonies to misdemeanors and allowed for the resentencing of people currently in state prison for crimes affected by the measure. As a result, Proposition 47 made fewer crimes eligible for prison and fewer people eligible for felony probation. Because Proposition 47 reduced the total population of people on felony probation, it reduced the number of people probation departments could divert from prison.
Impact of Proposition 47 on SB 678. The changes made by Proposition 47 were expected to affect the SB 678 grant allocations in 2015‑16, the fifth year of the formula’s implementation, in different ways. On the one hand, the reduction in the size of the felony probation population could have artificially reduced grants by reducing the number of people probation departments could divert from prison. On the other hand, it could have artificially increased grants. For example, if the remaining people on felony probation had higher rates of success, county grant rates would have artificially increased. Either case would be problematic as award amounts would be changing for reasons unrelated to county performance.
SB 678 Formula Modified to Account for Sentencing Changes
The SB 678 formula has been frequently modified since it was first implemented in response to various sentencing and policy changes, such as the 2011 public safety realignment and Proposition 47. These changes were made in an attempt to prevent county grant awards from changing for reasons discussed above unrelated to performance. Below, we discuss those modifications and the funding that has been distributed under the modified versions of the SB 678 formula.
Formula Temporarily Modified for 2013‑14 and 2014‑15. In an attempt to adjust for the effects of the 2011 public safety realignment, legislation was enacted to modify the original SB 678 formula for 2013‑14 and 2014‑15 to (1) reflect that fewer people on felony probation could now be sent to prison and (2) reward counties when they successfully send fewer people on felony probation to prison and jail (rather than just to prison as in the original formula). Separate legislation also changed the amount of funding awarded to counties for each person diverted from prison or jail to about $27,000 beginning in 2014‑15 to reflect the costs of contract beds the state was using at the time to house some people in prison. The original formula used $29,000 for each person diverted which reflected the state cost of housing people in state‑operated prisons and associated parole costs rather than contract beds.
Formula Permanently Modified in 2015‑16. Due to (1) the original formula sunsetting in January 2015 and (2) the major sentencing changes affecting probation that were implemented since the enactment of SB 678, the Legislature passed Chapter 26 of 2015 (SB 85, Committee on Budget and Fiscal Review). Specifically, SB 85 modified the formula by incorporating the new county felony supervision populations created by the 2011 public safety realignment (PRCS and mandatory supervision) and creating a new methodology for allocating funds to counties, while attempting to preserve the incentive for counties to reduce prison commitments. Under the SB 85 revisions, the formula now has three key components but is still generally referred to as the SB 678 formula. Similar to the original formula, DOF and Judicial Council are required to annually analyze the data collected from probation departments to establish county payments. The new formula consists of the following three components:
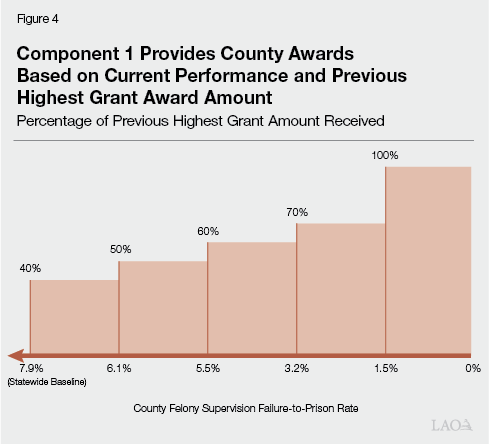
- Component 1: Funding for Reducing County Felony Supervision Failure‑to‑Prison Rate Below Baseline. The first funding component compares a county’s felony supervision failure‑to‑prison rate (meaning the rate that people on felony probation, PRCS, and mandatory supervision are sent to state prison) to the statewide average felony probation failure‑to‑prison rate between 2006 to 2008, which is 7.9 percent. Depending on how the county’s rate compares to this baseline rate, the county will receive between 40 percent and 100 percent of the highest payment received between 2011‑12 and 2014‑15. For example, as shown in Figure 4, if a county’s felony supervision failure‑to‑prison rate is below 1.5 percent, the county will receive 100 percent of its highest prior payment. However, if a county’s felony supervision failure‑to‑prison rate is above 6.1 percent but not higher than 7.9 percent, the county will receive 40 percent of its highest prior payment. Counties with county felony supervision failure‑to‑prison rates higher than 7.9 percent would not receive funding under this first component. This component is intended to (1) incentivize counties to reach a rate that is below this baseline and (2) ensure that a county that is already below the baseline will continue to receive funding even if it is not able to further reduce its failure‑to‑prison rate.
- Component 2: Funding for Reducing County Felony Supervision Failure‑to‑Prison Rate Below Prior Year. The second funding component compares a county’s most recent annual county felony supervision failure‑to‑prison rate with its rate from the previous year. If the failure‑to‑prison rate is lower than the previous year, the county receives 35 percent of the estimated state savings associated with that reduction, which was estimated to be $36,600 per person diverted, based on the state’s annual costs to incarcerate people in a contract facility at the time. (The cost of contract beds was used because, at the time, increases or decreases in the prison population resulted in increases or decreases in the number of contract beds used by the state.) For example, in 2020‑21, a county with a failure‑to‑prison rate lower than the previous year received about $12,800 for each additional person diverted relative to the previous year under this component. This second component is intended to incentivize counties to continue to reduce their felony supervision failure‑to‑prison rates each year. The funding that counties receive under Component 2 is in addition to the amount received under Component 1.
- Component 3: Funding to Guarantee $200,000 Minimum Award. The third funding component guarantees that each county receives at least $200,000. If the total amount that a county receives under Components 1 and 2 is less than $200,000, the county will receive funding under Component 3 to increase the total amount to $200,000. This third component is intended to ensure all counties receive a minimum amount of state funding for evidence‑based practices.
New Formula Temporarily Put on Hold From 2021‑22 Through 2023‑24. From 2015‑16 through 2020‑21, the state implemented the new SB 678 formula. However, as part of the 2021‑22 budget, the formula was temporarily put on hold. Specifically, each county received their highest SB 678 grant award from the prior three fiscal years (2018‑19, 2019‑20, or 2020‑21), irrespective of their performance. This action was taken due to a concern that grant awards would fluctuate for reasons unrelated to county performance. The two major reasons this was a concern were:
- COVID‑19 Pandemic. Various policies adopted in response to the COVID‑19 pandemic could have artificially affected grant awards. For example, many people on county felony supervision were not admitted to prison despite committing new prison‑eligible crimes because intake to prisons was halted to prevent the spread of the virus during the pandemic. This resulted in reduced county felony supervision failure‑to‑prison rates, which in turn would have artificially increased grant awards under the new SB 678 formula.
- Reduced Probation Terms Under Chapter 328 of 2019 (AB 1950, Kamlager). Chapter 328 reduced maximum probation terms from five years to two years. The change likely affected probation failure‑to‑prison rates. In particular, data show that people on felony probation generally become less likely to be sent to prison over time and, by reducing maximum probation terms, Chapter 328 removed people from felony probation who are less likely to be sent to prison while retaining people who are more likely to be sent to prison. Absent the temporary hold, grant awards could have been artificially reduced because people on felony probation that are more likely to fail would remain in the caseload driving up failure‑to‑prison rates.
Due to concerns that the pandemic and Chapter 328 would continue to impact grant awards for reasons unrelated to performance, the 2022‑23 and 2023‑24 budgets continued to place a temporary hold on the SB 678 formula and, instead of reverting to the new formula, provided counties the same amount of funding they received in 2021‑22. Absent any changes, the formula would have allocated $59.4 million (48 percent) more in 2021‑22, $11.5 million (9 percent) less in 2022‑23, and $9.7 million (8 percent) less in 2023‑24. In 2024‑25, the temporary hold on the formula will expire and the new formula will once again become operative barring any further changes.
State Distributed Average of $118 Million Annually Through Modified Formulas. As shown in Figure 5, starting in 2013‑14, counties began receiving grant awards under modified versions of the SB 678 formula. Between 2013‑14 and 2023‑24, county probation departments received $1.3 billion through SB 678, an average of $118 million annually. The average county award over this time period was $2 million annually.
Assessment
Our review of the SB 678 grant program indicates that the program appeared to effectively achieve its various goals in the initial years of implementation. However, we find that this might not still be the case. This is because (1) the effects of SB 678 on the prison population, crime, and state savings are difficult to distinguish from other policy changes; (2) components of the current formula do not align with the original goals of the program; and (3) it is unclear whether counties are actually implementing evidence‑based practices, which is important for achieving the goal of improving public safety. We also find that it is more challenging to use state savings to incentivize performance given the various sentencing changes affecting felony supervision. However, there continue to be state benefits from supporting evidence‑based practices at the local level.
SB 678 Initially Appeared to Achieve Its Goals
Prison Population and Crime Declined, Resulting in State Savings in Initial Years. As previously mentioned, funding was first provided to counties in 2011‑12 based on their performance in 2010. Thus, SB 678 provided an incentive for counties to reduce their felony probation failure rates beginning in 2010. This is notable as, following the implementation of SB 678, the state prison population and crime declined. Specifically, the state prison population was about 168,000 in June 2009 compared to 162,000 in June 2011 (a few months before the 2011 public safety realignment). In addition, the violent crime rate in 2009 was about 470 violent crimes per 100,000 people and the property crime rate was over 2,700 property crimes per 100,000 people, compared to about 410 violent crimes and 2,600 property crimes per 100,000 people in 2011. It is reasonable to think that SB 678 partially contributed to these reductions. For example, data suggest that SB 678 successfully diverted thousands of people from prison in the initial years. This not only helped reduce the prison population but also could mean the people diverted from prison committed fewer crimes than they otherwise would have. Additionally, Judicial Council estimates that the diversion of these people from prison generated hundreds of millions in state savings during this time period.
Notable Increase in Reported Use of Evidence‑Based Practices. As previously mentioned, a key aspect of the SB 678 program was to support evidence‑based practices. Counties self‑certify each year to Judicial Council that they are spending their SB 678 funds on evidence‑based practices. These responses imply probation departments are implementing evidence‑based practices statewide at substantially higher rates than previously. Much of the increase in the use of these practices occurred in the initial years of the formula’s implementation. For example, Judicial Council data show that the percentage of counties reporting use of evidence‑based practices increased in all areas measured by the survey from 2011 to 2013.
Unclear on Extent to Which Program Is Currently Achieving Its Goals
Difficult to Distinguish Effects of SB 678 on Prison Population, Crime, and State Savings From Other Policy Changes. The prison population and (in most years) crime continued to decline after the initial implementation of SB 678. However, because of the sentencing changes that were implemented—most notably the 2011 public safety realignment—it is difficult to determine the extent to which the SB 678 grant program contributed to these outcomes. For example, it is difficult to assess whether reductions in the number of people on county felony supervision sent to prison are the result of improvements in county supervision practices or simply the result of fewer people being eligible for prison due to the 2011 public safety realignment and Proposition 47. Given the challenge of disentangling the effects of the SB 678 grants from the effects of other factors, the actual amount of state savings SB 678 currently creates is unclear.
New Formula Undermines Goal of Creating State Savings and Reducing Failure‑to‑Prison Rates. The changes made to the SB 678 grant formula by SB 85 conflict with some of the key goals of the original program. Specifically, they conflict with the program’s goals of achieving state savings and reducing prison commitments. This is due to the following factors:
- Grants Through Component 1 Based on Previous Grant Awards Instead of People Diverted From Prison. As discussed earlier, Component 1 awards grants to counties based on a percentage of the county’s highest payment between 2011‑12 and 2014‑15. There is little reason to think that the amount of savings counties are currently creating for the state through their probation practices is related to the grant amounts distributed between 2011‑12 and 2014‑15. As such, it is possible the state is paying some counties more than the state is saving through the program by not directly awarding counties based on the actual number and rate of people a county diverted from prison. We find that this prevents the state from maximizing the program’s goal of achieving state savings.
- Component 1 Baseline Rate Inconsistent With Program Goals. The baseline failure‑to‑prison rate of 7.9 percent used in Component 1 is based on the average probation failure‑to‑prison rates between 2006 and 2008 when counties could revoke felony probationers to prison regardless of whether they committed a new crime. However, since people on county felony supervision often can only go to prison for new, prison‑eligible crimes, it no longer makes sense to compare current county felony supervision failure‑to‑prison rates to this probation failure rate. Typically, county felony supervision failure‑to‑prison rates stay within 3 percent—much lower than the historical probation failure‑to‑prison rates used to calculate the baseline. This means counties with relatively poor performance can still qualify for payment through Component 1. We find that this is inconsistent with the goal of reducing prison commitments. In addition, this prevents the state from maximizing state savings as it can result in the state paying some counties more than what they are actually saving.
- Estimated Savings of Component 2 No Longer Reflective of State Savings. Counties currently receive $12,800 for each person diverted from prison—35 percent of the $36,600 DOF estimates the state saves for each person diverted. However, based on limited data on marginal costs and average length of stay in prison and on parole, we estimate the state saves about $73,000 for each person diverted from prison, which could translate to $25,500 in savings passed on to counties at rate of 35 percent. This suggests that the state may be paying counties less than originally intended because the full amount of state saving including parole costs are not included in the calculation, which could be weakening the incentive for counties to reduce their failure‑to‑prison rate.
- Component 3 Disconnects Actual State Savings From Performance. The minimum guarantee of $200,000 to counties undermines the goal of generating state savings and reducing prison commitments. This is because a county could continue to receive SB 678 funds despite not diverting anyone from prison. This disconnects actual state savings from performance, thereby providing little incentive for improvement for some counties with lower performance.
Expansion in Evidence‑Based Practices Has Stalled. As discussed above, reports indicate that county probation departments initially expanded their use of evidence‑based practices. However, in recent years, increases in the reported use of evidence‑based practices have stalled. For example, the reported percent use of validated risk and needs assessments—a key evidence‑based practice—only increased by 7 percentage points between 2014 and 2021 and some counties were not using such assessments for all of their supervised population as of 2021. This suggests that the program may no longer be effectively incentivizing counties to expand their use of evidence‑based practices.
Unclear Whether All Practices Adopted by Counties Are Evidence Based. While Judicial Council’s surveys show initial increases in reported use of evidence‑based practices, Judicial Council does not monitor whether counties are actually using evidence‑based practices. In addition, there are no required audits or assessments of the practices counties are using. This makes it difficult for the Legislature to assess whether counties that report funding evidence‑based practices and programs are in fact doing so. This is concerning given one of the goals of the program is to improve public safety by incentivizing the use of these practices.
Using State Savings to Incentivize Performance Is More Challenging Given Recent Policy Changes
Performance‑Based Funding Creates an Incentive for Success. Generally, basing allocations to county probation departments on performance is a worthwhile goal when the performance can be accurately measured and there are minimal outside factors affecting the outcomes. In such cases, performance‑based funding can affect the behavior of departments in ways that benefit the state. For example, county probation departments historically responded to the incentives created by SB 678 by finding ways through evidence‑based practices to reduce the rate at which people commit new crimes and are sent to prison, such as by conducting risk and needs assessments to effectively target rehabilitation programs at those most in need of them. This resulted in improvement in outcomes which provided counties with additional resources to make further improvements while also creating savings for the state.
Policy Changes Can Affect Grant Awards in Problematic Ways. A drawback of a performance‑based formula for the SB 678 program is that policy changes (such as Chapter 328 or the 2011 public safety realignment) can cause fluctuations in grant amounts for reasons unrelated to performance. This is problematic because it undermines the goals of the program in various ways. First, it undermines a county’s incentive to improve its failure‑to‑prison rate because its grant award may increase or decrease despite there being no corresponding change in performance. Second, if grant amounts increase for reasons unrelated to performance, it means the state is paying counties regardless of whether their actions create savings for the state. Finally, if grant amounts decrease for reasons unrelated to performance, counties receive less funding for evidence‑based practices to sustain their performance. A reasonable way to still achieve the benefits of performance‑based funding despite the policy changes affecting probation is by establishing a new formula with a baseline that reflects the changes. For example, this could be done by comparing current county felony supervision failure‑to‑prison rates to a new baseline based on county felony supervision failure‑to‑prison rates that occurred after the policy changes took effect. This would reduce the extent to which the measure of a county’s performance is affected by the policy changes.
Constantly Adjusting Formula to Account for Policy Changes Can Be Problematic. The heavy reliance on performance measures that fluctuate for reasons unrelated to performance creates the need to constantly modify the funding formula, such as by putting the formula on hold or changing the formula in a way that accounts for a new policy impacting the county felony supervision population. This can be problematic as it makes it difficult for counties to know how grants will be calculated in the future. As a result, counties can be reluctant to invest in evidence‑based practices that require ongoing funding since they lack the ability to predict how such spending will affect future grant amounts or whether funding for those programs will continue to be available when policies change their performance and grant awards. It also has the potential to weaken the incentive for counties to reduce prison commitments as counties do not know how prison commitments will affect their grant allocations if the formula is subject to constant change.
State Benefits by Continuing to Provide Funding for Evidence‑Based Practices
Evidence‑Based Practices Support Positive Outcomes. For a program to be evidence‑based, it must be shown in an evaluation that the intervention improved outcomes of various metrics, which can include crime or recidivism. That means that evidence‑based practices are supported by the best information available on what works to improve outcomes. In the case of probation programs, these improved outcomes often provide benefits to the state either directly or indirectly, such as reductions in crime or spending on prisons. Spending on evidence‑based practices can also ensure the state is spending funds in ways that are cost‑effective instead of investing resources into practices that may not yield any benefits. However, these benefits can only be achieved if the practices supported are actually evidence based. Accordingly, it is also important for the state to ensure that the programs counties support with their funds are in fact evidence‑based practices.
Reducing Funding for Evidence Based Practices Could Increase State Costs. As discussed above, one way of addressing many of the weaknesses of the existing SB 678 grant formula is by establishing a new formula with a baseline that reflects the various policy changes affecting probation. However, SB 678 grant awards would likely decline significantly with such a change. This is because the failure‑to‑prison rate of people on county felony supervision is now lower than the years prior to the implementation of SB 678, meaning counties may not be able to further reduce the number of prison commitments to generate significant award amounts. This in turn could reduce the funding available for evidence‑based practices. To the extent counties are using SB 678 grants to fund evidence‑based practices that successfully reduce prison commitments, reductions in this funding could be problematic. This is because reductions in funding for evidence‑based practices could lead to increased crime and state costs if probation departments are no longer able to fund practices that successfully prevent crime and reduce prison commitments. Such an increase in state cost would also run counter to the program’s goal of creating state savings.
Recommend New Funding Formula
In view of our above findings, we recommend the Legislature establish a new formula for the SB 678 program to better ensure that the program’s goals—reducing the county felony supervision failure‑to‑prison rates, creating state savings, and improving public safety—are achieved. Specifically, we recommend creating a new formula with two portions: (1) a portion based on direct measures of performance and state savings and (2) a portion designed to pay for specific evidence‑based practices.
First Portion of Formula: Provide Funding Directly Tied to County Performance
Award Counties for Reducing County Felony Supervision Failure‑to‑Prison Rate. First, we recommend awarding grants to counties for diverting people on county felony supervision from prison, similar to the way the original SB 678 formula awarded counties for diverting people on felony probation from prison. Specifically, based on a county’s baseline felony supervision failure‑to‑prison rate and its county felony supervision population, an estimate of the number of people the county is expected to send to prison each year would be calculated. If the actual number of people sent to prison in a given year is less than this estimate, the county would receive a portion of the state savings for each person diverted from prison. State savings would be based on annual estimates of the cost of state prison and parole, which we currently estimate to be about $73,000. This approach would allow the state to more effectively achieve the program’s goals of reducing the failure‑to‑prison rate, creating state savings, and improving public safety.
Key Steps for Implementation. To implement this portion of the formula, the Legislature will want to take the following steps:
- Establish Baseline. In selecting a new baseline rate, a key consideration is what year or years should be used. We recommend that the new baseline be based on years that fully reflect all of the policy changes that have impacted the county felony supervision failure‑to‑prison rate and do not reflect other factors that could have temporarily affected the rate for reasons unrelated to performance (such as the effects of the COVID‑19 pandemic). One option is choosing an average of the county felony supervision failure‑to‑prison rates that occur in 2022 and 2023 as the baseline, if no additional policy changes are implemented that would significantly affect the supervision failure‑to‑prison rate. The rationale for these two years is that the effects of Chapter 328 would likely be fully reflected and the COVID‑19 pandemic would likely no longer be significantly affecting county felony supervision failure‑to‑prison rates. The Legislature could choose to update the baseline to account for any significant policy changes affecting probation in the future. The Legislature could determine whether this is necessary on a regular basis.
- Decide What Percentage of State Savings to Transfer to Counties. There is a trade‑off to consider in deciding what percentage of state savings to transfer to counties. A higher percentage provides greater incentive and resources to the counties to reduce prison commitments but reduces the amount of state savings achieved. A lower percentage does the opposite. Determining how much of the state savings should be shared with the counties ultimately depends on how the Legislature weighs the goal of achieving state savings versus reducing prison commitments. Historically, the percentage of state savings that has been passed on to counties has been between 35 percent and 45 percent.
Second Portion of Formula: Provide Additional Grants for Specific Evidence‑Based Practices
Ensuring Sustainable Funding to Reduce Prison Commitments. If the state only provides funding based on performance as we recommend for the first portion, then SB 678 grant awards would likely decline significantly. This is because the new baseline would be based on current county felony supervision failure‑to‑prison rates that tend to be around 3 percent—much lower than the historical felony probation failure‑to‑prison rate baseline of 7.9 percent—meaning counties may not be able to further reduce the number of prison commitments to generate significant award amounts. Moreover, this reduction would be even more difficult to achieve for counties that have already successfully implemented evidence‑based practices as such counties could have little room for improvement. Such a reduction in funding could be problematic if it results in counties that have relied on the SB 678 funding for evidence‑based practices spending less on such practices that successfully reduced prison commitments. As such, we recommend also providing counties with funding for using specific evidence‑based practices likely to generate net savings for the state. This second portion of our proposed funding formula would provide sustainable funding to probation departments to support such practices.
Key Steps for Implementation. When developing the second portion of the new formula, the Legislature will want to take the following steps:
- Identify Practices to Be Funded. We recommend that a group of experts, such as criminal justice academic researchers and staff at county probation departments successfully implementing and evaluating evidence‑based practices, be convened to identify evidence‑based practices that are likely to reduce the number of prison commitments from the county felony supervision population. Only these identified evidence‑based practices would be eligible for funding through this portion of the grant. Counties that have already adopted these practices would continue to receive funding for them. Counties that have not done so would need to adopt them to continue to receive funding. This would make it more likely that counties are using the funds in ways that improve public safety, reduce prison commitments, and yield net benefits to the state—consistent with the goals of the SB 678 program. We note that the Board of State and Community Corrections (BSCC) regularly convenes groups of criminal justice experts to make grant allocation recommendations. Accordingly, we recommend that the Legislature task BSCC with this responsibility.
- Estimate Level of Savings and Award Amount for Each Evidence‑Based Practice. Only paying for the evidence‑based practices that generate savings for the state from people diverted from the prison system is ideal. However, it is difficult to know the direct impact of an evidence‑based practice on each person diverted. Estimating the state savings of each practice or program is the next best alternative. Therefore, we suggest providing a county funding for each evidence‑based practice based on a portion of the expected savings the practice would generate for the state. We note that research on the fiscal effect of numerous evidence‑based practices is already available from a variety of sources, such as the Pew‑MacArthur Results First Initiative. (For more on the Pew‑MacArthur Results First Initiative, see the box below.) We recommend the Legislature direct BSCC to collaborate with experts to use such research to estimate the amount of savings likely to be created by each evidence‑based practice identified in the previous step. The Legislature could then determine what portion of the cost of the practice would be covered through the grant by weighing its preference for expanding the use of evidence‑based practices against its interest in creating state savings.
- Establish Total Amount for Grant and Determine Allocation. The Legislature would need to establish the total amount it is willing to spend on additional grants for specific evidence‑based practices and determine a county allocation formula. The Legislature could consider setting this amount such that the two portions of the grant would be roughly similar to the amount provided in the past three budget years—roughly $120 million annually—in order to ensure counties do not need to reduce funding for evidence‑based practices. One option for a formula allocation would be to base each county’s maximum share of funds on the overall county felony supervision population. A county would then receive an award for each evidence‑based practice it has implemented, up to the maximum award amount.
- Establish Oversight on Use of Evidence‑Based Practices. To improve oversight of the program, we recommend the Legislature require BSCC, which is responsible for promoting effective state and local corrections efforts, to have an oversight role of the program. Specifically, BSCC would be required to audit counties to ensure compliance with the selected evidence‑based practices and to ensure outcomes at the local level are regularly evaluated. This could include conducting site visits and assessments of fidelity, ensuring counties devote funds to evaluating the effectiveness of those practices implemented, providing technical assistance, as well as making recommendations to the county for improvement. Given its existing responsibilities in working with county probation departments, BSCC is well positioned to take on this role. The BSCC budget would have to increase to account for its new duties related to the grant. We estimate that this could require a few million dollars annually. We note that this amount could be paid from the state savings created by the program.
Pew‑MacArthur Results First Initiative
Results First Identifies Cost Savings Associated With Evidence‑Based Practices. The Pew‑MacArthur Results First Initiative works with states and other governmental entities to identify cost‑effective government practices, including those in criminal justice, such as probation supervision practices. For example, the Results First Initiative has developed an inventory of practices that have been evaluated in various states and cities and have been shown to reduce recidivism. Results First uses these evaluations to calculate the potential fiscal effects of implementing the practice in the jurisdictions it works with. These estimates (1) assume the practices will have the same effect on recidivism in the jurisdiction as they did when implemented elsewhere and (2) estimates the potential costs and benefits of each practice based on how much it costs and the jurisdiction‑specific costs associated with recidivism (such as prison and jail operational costs).
Some California Probation Departments Have Already Partnered With Results First. Some probation departments in California have already partnered with Results First to complete some of this work. Notably, the Santa Cruz County Probation Department partnered with Results First between 2014 and 2018 and was able to calculate estimated savings of the different programs it could offer to people on supervision. As a result, the county has made decisions on which programs would yield the most benefits. This led the department to rebid its contracts for community‑based services and include language in the contracts that prioritized funding for effective evidence‑based programs.
Under our recommended formula, funding awarded would remain stable so long as counties maintain the same evidence‑based practices.
Conclusion
The Legislature established the SB 678 program to reduce failure‑to‑prison rates for those on county felony supervision, create state savings, and improve public safety. Under the program, these goals would be achieved by distributing a portion of state savings to support the use of evidence‑based practices. However, significant changes to probation and modifications to the formula over the years have made it unclear whether the program continues to achieve those goals. For example, as a result of pandemic‑related and other policy changes, the formula has been put on hold until 2024‑25. Moreover, once the formula is no longer on hold, it will revert to a formula that appears to run counter to the program’s goals. This presents an opportune time for the Legislature to revisit the formula entirely. As such, we recommend the Legislature establish a new formula which would (1) award funding to counties based on direct measures of performance and the level of state savings they create and (2) award funding to counties for their use of specific evidence‑based practices. This, as well as establishing additional oversight mechanisms of the program, would better ensure the program is effectively achieving its intended goals.