The 2018-19 Budget:
California's Fiscal Outlook
See a list of this year's fiscal outlook material, including a fuller discussion of Proposition 98, on our fiscal outlook budget page.

November 15, 2017
The 2018-19 Budget:
California's Fiscal Outlook
- The Economy
- Revenues
- Expenditures
- General Fund Condition in 2018‑19
- Uncertainty in 2018‑19
- Decisions for the Legislature in the 2018-19 Budget
CHAPTER 2: LONGER‑TERM OUTLOOK
Executive Summary
Each year, our office publishes the Fiscal Outlook in anticipation of the upcoming state budget process. In this report, we summarize our assessment of California’s budget condition. The goal of this report is to provide the Legislature with a planning document to show how the budget may fare under current laws and policies. This report does not attempt to predict how the Legislature or other entities (such as the federal government) will act to change those policies. (This report is supplemented by a more detailed Proposition 98 budget outlook publication and various other posts.)
Near‑Term Outlook Positive. Under our current revenue and spending estimates, and assuming the Legislature makes no additional budget commitments, the state would end the 2018‑19 fiscal year with $19.3 billion in total reserves (including $7.5 billion in discretionary reserves), as we discuss in Chapter 1. In the budget process, the Legislature will face decisions about how to use discretionary state resources, including whether to build more budget reserves or make new one‑time and/or ongoing budget commitments. In addition, we estimate the Legislature will have $5.3 billion in uncommitted school and community college funds to allocate in 2018‑19. The state could use these resources to fully implement the Local Control Funding Formula and support a variety of other one‑time and ongoing activities.
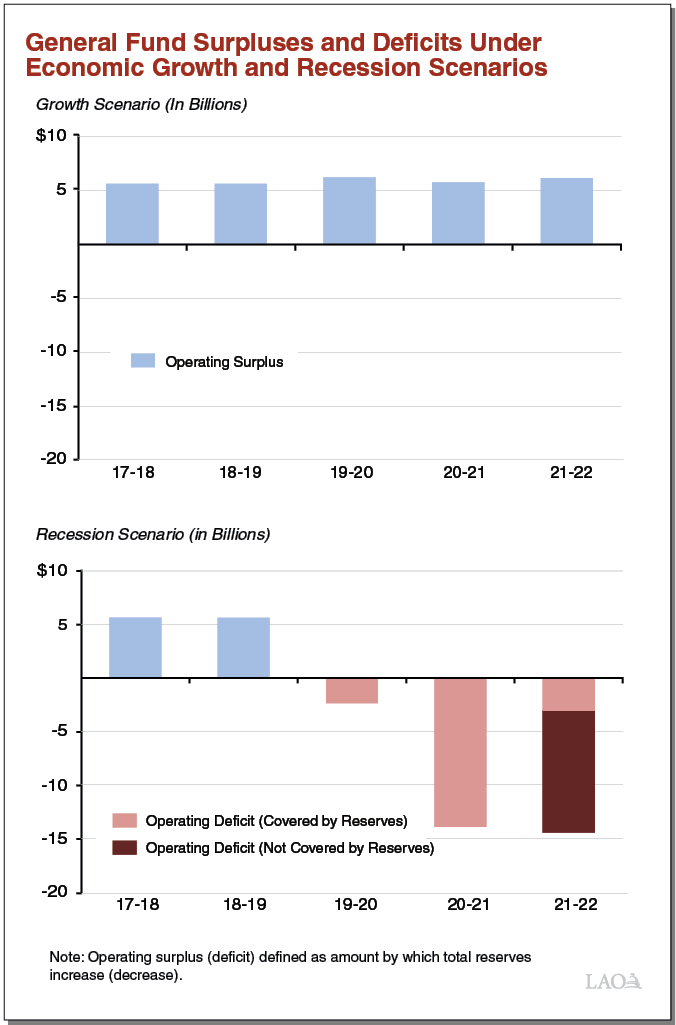
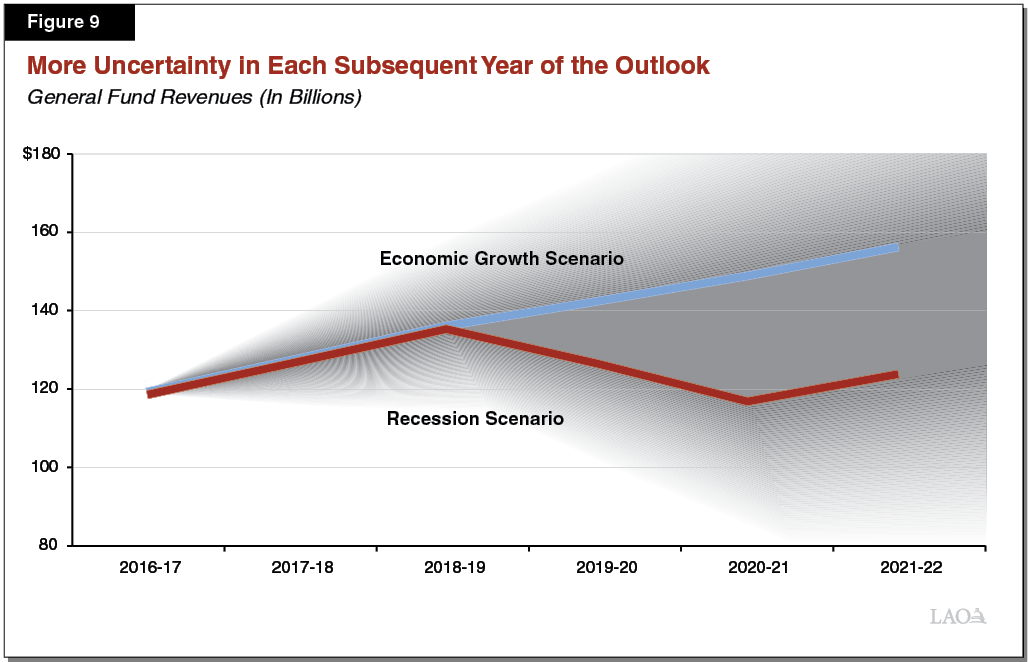
Longer‑Term Outlook: Significant Progress Made in Preparing for Next Recession. The nearby figure displays our longer‑term General Fund outlook under two different scenarios discussed in Chapter 2. The first scenario assumes continuing economic growth and the second assumes a moderate recession beginning in 2019‑20. If the economy continues to grow, as shown in the top part of the figure, the state has operating surpluses of about $6 billion each year. If the economy experiences a moderate recession, as shown in the bottom part, the state has enough reserves to cover its deficits until 2021‑22. At that point, available reserves are sufficient to cover only a portion of the operating deficit, and the state would need to use some combination of spending reductions or tax increases to address the remaining $11 billion. Both of these scenarios assume the state makes no additional budgetary commitments in any year over the period. If instead the state committed to new spending or tax reductions, the budget’s bottom line would be worse off.
Decisions by Federal Government or State Executive Branch Can Influence Budget Condition. Although our outlook assumes the Legislature maintains its current laws and policies, decisions by other entities can either help or hurt the budget’s bottom line. In particular, the federal government could make changes to health care, tax, immigration, trade, or other policies. Similarly, in the upcoming budget process, the state executive branch has discretion to allocate different levels of revenues from two recent measures—Proposition 55 and Proposition 56—to Medi‑Cal, the state’s health care program for low‑income Californians.
The Importance of Building More Reserves. Given all of the uncertainties faced by the state budget, we encourage the Legislature to continue its recent practice of building more reserves.
Chapter 1: Near‑Term Outlook
The Economy
Our near‑term outlook is based on a September 2017 consensus forecast of the U.S. economy—provided by an economics advisory firm, Moody’s Analytics. The consensus forecast anticipates continuing expansion in the U.S. economy. Using this scenario (including an October 2017 update of stock market data), we develop independent projections for near‑term trends in the California economy.
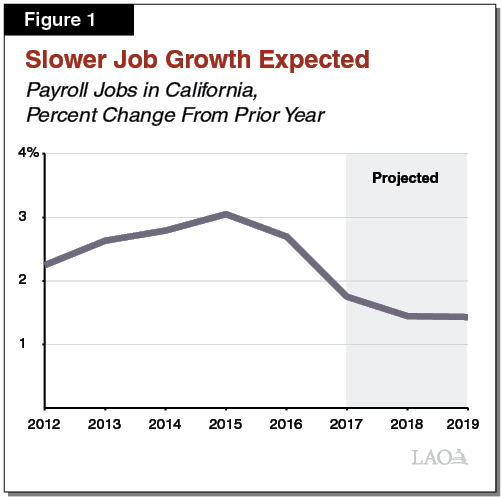
Slower Job Growth Expected. Employment growth in California this year has slowed from recent years, with a noteworthy stagnation in reported growth in the state’s professional and technical services sector (which includes many technology jobs). As Figure 1 shows, we anticipate slower job growth will continue in California through at least 2019. This is consistent with an expected slowing of national job growth and a cooling of growth in California technology jobs, as well as a tight labor market with relatively low unemployment rates.
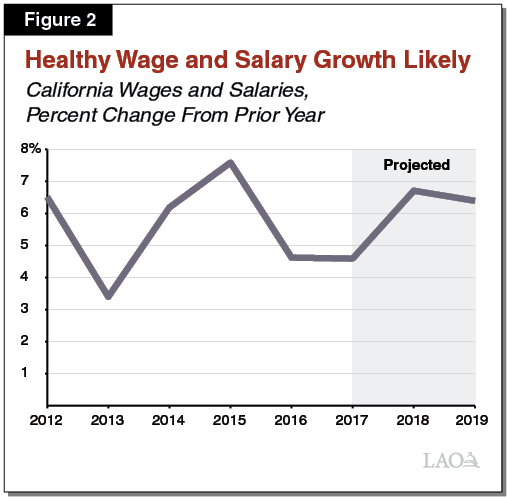
Healthy Wage Growth Likely. While we anticipate a slowing rate of job growth in the state, we think two trends likely will lead to continuing, healthy increases in total wages and salaries over at least the next year or two (see Figure 2). First, with California’s unemployment rate at 5.1 percent as of September (down from 12.2 percent in the fall of 2010), the state has a much tighter job market than seen in years. Employers likely will continue to raise pay to attract and retain workers. Second, California’s statewide minimum wage—now at $10.50 per hour for employers with 26 or more workers—is slated to rise to $11 in 2018, $12 in 2019, and eventually $15 as early as 2022.
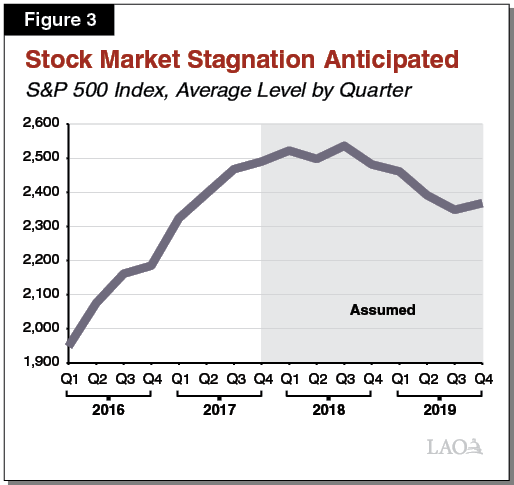
Stock Market Weakness Anticipated. California state revenues—especially the state government’s largest tax source, the personal income tax (PIT)—fluctuate significantly along with stock prices. Stock prices have risen substantially since the beginning of 2016. Our economic scenario assumes this growth trend will not continue, as shown in Figure 3. We stress, however, that it is impossible to predict quarter‑by‑quarter trends in stock prices. In any given quarter, stock prices could be well above or below the levels shown in Figure 3. Moreover, recent stock price growth might be stemming from investors’ expectations of future reductions in federal taxes. To the extent that federal tax changes are not approved or differ from investors’ expectations, stock prices could be lower or higher than now anticipated.
Revenues
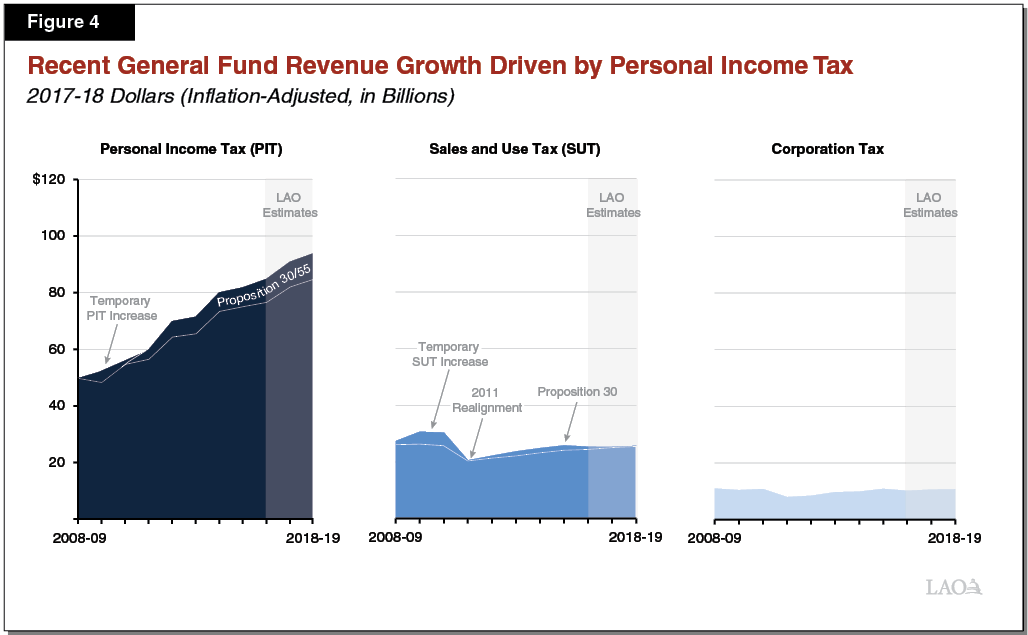
PIT Has Fueled Revenue Growth Since Recession. California has enjoyed steady General Fund revenue growth since 2008‑09. In inflation‑adjusted terms, revenues from the three largest state taxes have grown $34 billion since 2008‑09. (These three state taxes make up over 95 percent of General Fund revenue.) As Figure 4 shows, inflation‑adjusted PIT revenues have grown $35 billion over the same period—which explains the growth in these revenues. PIT growth has been due in part to Proposition 30’s tax increases on high‑income taxpayers that were passed by voters in 2012 and extended by Proposition 55 (2016). (More detail on our revenue projections are available in Appendix Figure 1.)
We Expect Revenue Growth Will Continue in Near Term. Consistent with our economic assumptions, we estimate General Fund revenues will continue to grow in the near term, as shown in Figure 5. The PIT provides most of the growth in our near‑term outlook, with modest contributions from the sales and use tax and corporation tax.
Figure 5
Near‑Term Revenue Outlook
LAO November 2017 General Fund Estimates (In Millions)
|
2016‑17 |
2017‑18 |
2018‑19 |
|
|
Personal income tax |
$83,012 |
$90,912 |
$95,800 |
|
Sales and use tax |
24,869 |
25,285 |
26,214 |
|
Corporation tax |
10,002 |
10,620 |
10,965 |
|
Subtotals |
($117,884) |
($126,818) |
($132,978) |
|
Insurance tax |
$2,426 |
$2,332 |
$2,398 |
|
Other revenues |
1,739 |
1,546 |
1,593 |
|
Rainy‑day fund deposit |
‑3,014 |
‑3,222 |
‑1,897 |
|
Other transfers |
‑501 |
‑522 |
390 |
|
Total Revenues and Transfers |
$118,534 |
$126,951 |
$135,463 |
We Assume Capital Gains Surge in 2017. We estimate PIT revenues in 2017‑18 will be nearly $8 billion higher than the 2016‑17 level. Much of this growth comes from income taxes on capital gains—income that individuals receive when they sell stocks and other assets. For over a year, there has been strong stock market growth. We have expected that growth to be accompanied by an increase in quarterly tax payments (typically made by higher‑income taxpayers). That surge has not yet materialized. We suspect that many high‑income individuals might have a large tax liability for 2017 but have nonetheless been making quarterly payments more consistent with their 2016 tax liability. If we are right, monthly revenue collections in December 2017, January 2018, and/or April 2018 will exceed the administration’s most recent projections (on which the June 2017 budget was premised), perhaps by billions of dollars for the three months combined. We should have a better sense of the capital gains situation by the end of January 2018.
Expenditures
This section describes major programmatic spending changes through 2018‑19. In particular, three program areas experience the largest year‑over‑year General Fund spending growth between 2017‑18 and 2018‑19: (1) the General Fund share of the minimum funding level for schools and community colleges ($1.3 billion); (2) Medi‑Cal, the state’s Medicaid program ($2.2 billion); and (3) state employee compensation costs, including for pensions and pay ($1 billion). We outline the major components of these changes below. (More detail concerning our near‑term expenditure projections is in Appendix Figure 2.)
Schools and Community Colleges
Proposition 98 Sets Minimum Funding Level for Schools and Community Colleges. State funding for schools and community colleges is governed largely by Proposition 98, passed by voters in 1988 and modified in 1990. The measure establishes a minimum annual funding requirement, commonly referred to as the minimum guarantee. The state adjusts the minimum guarantee each year based on various factors including General Fund revenue, per capita personal income, and K‑12 student attendance. The state meets the minimum guarantee through a combination of state General Fund and local property tax revenue, with increases in property tax revenue generally reducing General Fund costs. Although the state can provide more funding than Proposition 98 requires, in practice it usually funds at the guarantee.
Minimum Guarantees Up in 2017‑18 and 2018‑19. Figure 6 shows our estimates of the minimum guarantee. For 2017‑18, the guarantee is $651 million (0.9 percent) above the level assumed in the June budget plan. The increase is due to General Fund revenue growing more quickly than previously assumed. Most of the associated cost of funding the higher guarantee, however, is covered by local property tax revenue coming in higher than anticipated. For 2018‑19, the guarantee is $2.6 billion (3.4 percent) above the revised 2017‑18 level. This increase is driven primarily by growth in per capita personal income. About half of the associated cost of funding the higher guarantee is covered by the state General Fund ($1.3 billion) and half by local property tax revenue ($1.3 billion). The year‑over‑year increase in property tax revenue is due primarily to a 5.9 percent increase in assessed property values, which is close to the historical average over the past two decades.
Figure 6
Tracking Changes in the Minimum Guarantee
(In Millions)
|
2017‑18 |
2018‑19 |
|||||
|
June Budget Plan |
November LAO Estimate |
Change From Budget Plan |
November LAO Estimate |
Change From LAO 2017‑18 |
||
|
Minimum Guarantee |
$74,523 |
$75,175 |
$651 |
$77,745 |
$2,570 |
|
|
Funding sources: |
||||||
|
General Fund |
$52,631 |
$52,766 |
$135 |
$54,079 |
$1,313 |
|
|
Local property tax |
21,892 |
22,408 |
516 |
23,666 |
1,258 |
|
Substantial Funding Available for Proposition 98 Priorities. The higher 2017‑18 guarantee results in the Legislature having an additional $651 million available for one‑time purposes. In addition, the Legislature would have $5.3 billion to allocate for any combination of one‑time or ongoing purposes in 2018‑19. This $5.3 billion consists of a $3.2 billion increase in the guarantee (from the level included in the June budget plan to our estimated 2018‑19 level) and more than $2 billion freed up from other adjustments—primarily the end of various one‑time initiatives that were funded in 2017‑18 but do not continue in 2018‑19.
Districts Face Pressure Primarily From Rising Pension Costs and Staffing Decisions. Whereas Proposition 98 sets an overall funding level, school and community college districts are responsible for developing their own local budgets. One of the most significant budget challenges for districts is the increase in contribution rates for the California State Teachers’ Retirement System and the California Public Employees’ Retirement System (CalPERS). In 2018‑19, costs are expected to increase by about $1.3 billion as result of these higher rates. Districts also are affected by costs for health benefits, which have been growing more quickly than inflation for many years. Additionally, districts typically face pressure to increase their salary schedules and, in some cases, reduce their student‑teacher ratios. Though the state sets district employer pension rates, districts typically make decisions in these other areas of their budgets through collective bargaining agreements.
Medi‑Cal
The state’s Medicaid program, known as Medi‑Cal, provides health care services to low‑income Californians. The Children’s Health Insurance Program (CHIP) is also administered through Medi‑Cal. CHIP provides health insurance coverage primarily to children in low‑income families with incomes too high to qualify for Medicaid. This section discusses cost drivers in both overall Medi‑Cal and CHIP spending.
2017‑18 Expenditures Down From Budget Act Estimate. We project that Medi‑Cal General Fund spending will be $18.9 billion in 2017‑18, which is over $600 million lower than what was assumed in the 2017‑18 Budget Act. This downward adjustment largely reflects (1) higher‑than‑anticipated estimated Proposition 56 (tobacco tax) revenues for Medi‑Cal in 2017‑18 (that serve to offset General Fund costs) and (2) our assumption that federal funding for CHIP will be reauthorized by Congress at a higher federal cost share than assumed by the 2017‑18 Budget Act.
Growth in 2018‑19 Spending. We estimate Medi‑Cal spending will be $21.1 billion in 2018‑19, a $2.2 billion (nearly 12 percent) increase over the revised 2017‑18 level. The major drivers of this growth are:
- Underlying Growth Primarily in Per‑Enrollee Costs. While Medi‑Cal enrollment has risen significantly in recent years, recent enrollment counts suggest that caseload growth might be slowing. We therefore assume that overall Medi‑Cal enrollment will increase by less than 1 percent in 2018‑19, translating into roughly 50,000 additional enrollees. Based on recent trends, we assume that per‑enrollee costs will grow by about 4 percent. We estimate that growth in caseload and per‑enrollee costs together, will result in General Fund expenditure growth in Medi‑Cal of about $950 million in 2018‑19.
- Significant Reduction in Proposition 56 Revenue Available to Fund Year‑Over‑Year Growth. Proposition 56 increased state excise taxes on cigarettes and other tobacco products and directed most associated revenues to Medi‑Cal. An agreement reached in the 2017‑18 budget package dedicates a portion of these revenues to fund increases in health care provider rates, with the remainder available to cover year‑over‑year growth in Medi‑Cal (thereby reducing General Fund costs). Consistent with the agreement, we assume that significantly more revenue ($800 million) funds rate increases in 2018‑19. Combined with a lower level of Proposition 56 revenues compared to 2017‑18, there are fewer resources available in 2018‑19 to offset year‑over‑year growth in the Medi‑Cal program. As a result, General Fund spending on the program increases by about $750 million.
- State Share of Cost for Optional Expansion Increases in 2018‑19. As part of federal health care changes, in 2014, California expanded Medi‑Cal eligibility to childless adults with incomes up to 138 percent of the federal poverty level, known as the optional expansion population. Until 2016, the federal government paid 100 percent of the cost for this population. Under current law, the federal share is scheduled to gradually decline between 2017 and 2020, with the state eventually paying 10 percent of the cost of health care services for the optional expansion population. We project that General Fund spending in Medi‑Cal will increase by over $200 million in 2018‑19 as a result of the decline in the federal share of cost for this population.
Assume Lower General Fund Spending on CHIP. Federal authorization of CHIP funding expired on September 30, 2017. California is currently funding its program in part using unspent federal funds. Legislation pending in Congress would reauthorize CHIP funding through 2022, continue the federal cost share of 88 percent through September 30, 2019, and gradually ratchet it down to 65 percent. Our outlook assumes Congress will reauthorize CHIP funding at the proposed funding levels, but the 2017‑18 budget package assumed a lower federal share of 65 percent. As a result, such a reauthorization would save the state approximately $400 million General Fund (with comparable savings in 2018‑19).
State Employee Compensation
We estimate that the state’s General Fund employee compensation costs will increase by about $1 billion from 2017‑18 to 2018‑19. These cost increases are attributed to the following three components of compensation:
- Pay ($540 Million). The state has active agreements with all 21 of its state employee bargaining units. These agreements provide substantial pay increases to state employees throughout the term of the agreements. In 2018‑19, most state employees are scheduled to receive a 4 percent pay increase.
- Pensions ($250 Million). The state’s annual payments towards CalPERS pensions are expected to increase due to the CalPERS board adopting new actuarial assumptions earlier in 2017. Our estimate assumes that the state’s one‑time $6 billion supplemental payment to CalPERS authorized in the 2017‑18 Budget Act reduces the state’s 2018‑19 payment from what it otherwise would be.
- Health Benefits ($250 Million). CalPERS health premiums are expected to increase more than 4 percent in January 2018 and again in January 2019. This increases the state’s costs to provide health benefits to active and retired state employees and their dependents. In addition, the state is expected to increase its contributions—established as a percentage of pay in labor agreements—to prefund retiree health benefits earned by active employees.
General Fund Condition in 2018‑19
Figure 7 displays our estimate of the General Fund condition through 2018‑19. We estimate 2017‑18 will end with $13.7 billion in total reserves, $3.8 billion more than assumed in the 2017‑18 Budget Act. Most of this difference is attributable to higher revenue estimates and lower estimated spending in Medi‑Cal.
Figure 7
Near‑Term Budget Condition
LAO November 2017 General Fund Estimates (In Millions)
|
2016‑17 |
2017‑18 |
2018‑19 |
|
|
Prior‑year fund balance |
$4,750 |
$2,300 |
$4,715 |
|
Revenues and transfers |
118,534 |
126,951 |
135,463 |
|
Expenditures |
120,984 |
124,536 |
131,739 |
|
Ending fund balance |
$2,300 |
$4,715 |
$8,440 |
|
Encumbrances |
980 |
980 |
980 |
|
SFEU balance |
1,320 |
3,735 |
7,460 |
|
Reserves |
|||
|
SFEU balance |
$1,320 |
$3,735 |
$7,460 |
|
BSA balance |
6,713 |
9,935 |
11,832 |
|
Total Reserves |
$8,033 |
$13,670 |
$19,292 |
|
SFEU = Special Fund for Economic Uncertainties (discretionary reserve) and BSA = Budget Stabilization Account (rainy day fund). |
|||
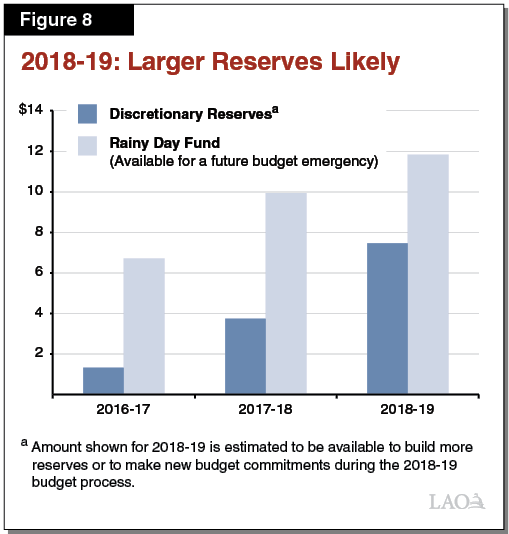
2018‑19: Larger Reserves Likely. Under our current estimates and assuming the Legislature makes no additional budget commitments in either 2017‑18 or 2018‑19, the state would end 2018‑19 with $19.3 billion in total reserves. This includes $11.8 billion in constitutionally required rainy day fund reserves (which would be available for a future budget emergency), as well as $7.5 billion in discretionary reserves (which the Legislature could use to make additional one‑time or ongoing budgetary commitments). As Figure 8 shows, reserve balances grow significantly under our near‑term outlook.
Assumes Budget Limitation Provisions Not Triggered. California has three budgetary rules—a constitutional spending limit passed in 1979 and two sales tax statutes—that require rebates to taxpayers, additional funding for schools and community colleges, or tax rate reductions in certain circumstances. Given our estimates of the General Fund condition in 2018‑19, one or more of these triggers could come into play. The state’s room under its spending limit has decreased significantly in recent years. Further, larger balances in the state’s discretionary reserve could trigger sales tax reductions. Our estimates, however, assume neither rebates nor tax reductions occur—in part because it is difficult in advance to predict how the formulas associated with these budget rules will play out.
Uncertainty in 2018‑19
The budget outlook for 2018‑19 faces significant uncertainty from three sources: (1) revenue changes, (2) decisions by the federal government or the Governor, and (3) other notable costs that are not wholly reflected in our outlook. We discuss each of these sources of uncertainty below.
Effects of Revenue Changes
Our near‑term outlook assumes continued economic growth (characterized by healthy wage growth, positive but slowing job growth, and some stock market weakness) and revenue growth. Given the state’s volatile tax structure, actual revenues can vary significantly from what we have assumed. Below, we describe how different assumptions about revenues would affect required reserve deposits, debt payments, and funding for schools and community colleges. We then highlight the overall impact on the budget’s bottom line.
Higher Revenues Would Mean More Discretionary Resources. If the economy or stock market is stronger than our current assumptions, General Fund revenues likely would be higher than what we have assumed in 2017‑18 and/or 2018‑19. Higher General Fund revenues, particularly higher capital gains revenues, would increase formula‑driven requirements for rainy day fund deposits and debt payments. Required funding for schools and community colleges, however, likely would not increase notably in 2017‑18 and 2018‑19. This is because the minimum funding requirement under our outlook already is growing quickly enough to keep pace with the economy. As a result, any further increase in General Fund revenues would tend to benefit the non‑Proposition 98 side of the budget (although the Legislature could provide more than required to schools and community colleges).
Lower Revenues Would Mean Less Required Funding for K‑14 Education. If, over the next 18 months, the economy or stock market is weaker than we assume, General Fund revenues likely would be lower than our outlook estimates. This would translate into a smaller required reserve deposit and a lower minimum funding requirement for schools and community colleges. Together, these lower requirements would partially, but not wholly, offset declines in General Fund revenues. As a result, the budget’s bottom line would be moderately worse than what we have displayed under our outlook.
Decisions by the Governor or Federal Government
Decisions by the Federal Government Could Change Budget Outlook. The outlook assumes no new changes in federal policy. However, federal policy changes could affect the state economy and revenues or federal funding to the state budget specifically. In particular, federal policies could change in the near‑term and have implications for the 2018‑19 budget include:
- Taxes. The President and congressional leaders have stated their intent to pass a broad package of federal tax changes, aimed at reducing the overall level of income, corporate, and estate taxes paid to the federal government over the next decade. Should agreement be reached in Washington, there likely would be a variety of short‑term and ongoing effects for the state and national economies—potentially both positive and negative. California, for example, may be disproportionately affected by proposed changes to the state and local tax deduction, but the state’s economy also could benefit from other parts of the plan. Changes to the federal tax code also could affect the administration of state tax laws, and this could lead to proposals for legislation to conform California’s tax laws to some of the federal changes.
- CHIP. As noted earlier, the budget package assumed Congress would reauthorize CHIP funding, initially with an 88 percent federal cost share. If Congress fails to do so, the state would likely exhaust its remaining federal funds by the end of the calendar year and potentially be required to continue to cover CHIP‑eligible children with a lower federal share of costs. Relative to the 2017‑18 Budget Act, this scenario would increase General Fund costs by $280 million in 2017‑18 and $576 million in 2018‑19.
- Trade. The President has sought to renegotiate the nation’s trade pact with Mexico and Canada, California’s key international trading partners. If the President withdrew the nation from this trade pact (court or congressional authorization may be required), this could disrupt business supply chains, raise tariffs, and push up prices. Especially in the short term, withdrawal from the trade pact would introduce added risks to the economic outlook.
Decisions by Governor’s Administration Could Change the Outlook. The state executive branch has significant discretion to change spending in two key areas, which would affect the overall budget condition. In particular, there is discretion about how to allocate revenues from:
- Proposition 55. Proposition 55, which extended tax rate increases on high‑income earners, gave the Director of Finance significant discretion to determine the amount of revenues from the measure to dedicate to Medi‑Cal. Our outlook assumes no new spending on Medi‑Cal associated with this measure. If the administration makes different decisions regarding these revenues, Medi‑Cal spending could be higher and discretionary reserves could be lower by up to $2 billion in 2018‑19. We discuss the longer‑term implications of these decisions in greater detail in Chapter 2.
- Proposition 56. Our outlook assumes a $750 million General Fund spending increase for Medi‑Cal related to Proposition 56 revenues in 2018‑19. However, the administration has significant discretion to increase the amount of Proposition 56 revenues that offset year‑over‑year growth in Medi‑Cal, thereby reducing General Fund Medi‑Cal spending below what we have assumed.
Other Notable Uncertainties
In the 2018‑19 budget process, the Legislature might face some additional, but uncertain, costs above the levels included in this outlook. We describe two of these below.
Wildfire Costs. In October 2017, several wildfires ignited in northern California’s “wine country” collectively resulting in one of the most destructive fire events in state history in terms of loss of life and property damage. Together, these fires could result in additional state General Fund costs for various activities such as fire suppression, debris removal, repair to damaged state and local infrastructure, and assistance to individuals whose property was lost or damaged. The total magnitude of these additional costs is unknown at this time, but could be in the hundreds of millions of dollars. We note that some of these costs may ultimately be covered by nonstate sources such as federal reimbursements, resulting in savings in future years.
National Mortgage Settlement Litigation. In 2012, California (along with various other states) finalized settlements with major mortgage loan providers to resolve claims that they engaged in unlawful mortgage and foreclosure practices. These settlements—generally referred to as the national mortgage settlement—included guidelines for how the settlement proceeds were to be used. In 2015, a court ruled that the state had unlawfully diverted $331 million of settlement funds. The state appealed the case and that appeal is now pending. Consistent with our typical practice, our outlook assumes that the state prevails in this lawsuit. However, if the state does not prevail, the budget would likely face additional costs of $331 million in 2018‑19 or later.
Decisions for the Legislature in the 2018‑19 Budget
The Legislature will face several significant policy questions in the 2018‑19 budget process, which we discuss below. Most notably, we discuss possible trade‑offs the Legislature will confront as it decides how to allocate any sizeable amount of discretionary resources.
How Much to Allocate to Reserves or Budget Commitments? Under our estimates, the Legislature would have $7.5 billion in discretionary resources in 2018‑19. In the budget process, the Legislature will face decisions about how to use these resources, including building more budget reserves and making one‑time or ongoing budget commitments. The choices the Legislature makes for these funds may depend, in large part, on its consideration of future budgetary risks. In addition to the uncertainty described in this chapter, the state budget faces considerable uncertainty related to the economy’s performance over the next few years. In the next chapter, we present two possible out‑year budget scenarios. We hope these scenarios help inform the Legislature’s decisions about how to allocate its 2018‑19 discretionary resources as the budget process begins.
How to Allocate Significant New Proposition 98 Funding? After accounting for growth in the minimum guarantee and backing out prior‑year one‑time spending, we estimate the Legislature would have $5.3 billion in uncommitted Proposition 98 funds to allocate in 2018‑19. We estimate that reaching full implementation of the Local Control Funding Formula (LCFF) would cost $2.7 billion. Though the state is not required to reach full implementation in 2018‑19, the state has placed a high priority on providing funding for LCFF. The state also typically provides a cost‑of‑living adjustment (COLA) for community college apportionments, special education, and various smaller K‑14 programs, which together would cost an estimated $228 million in 2018‑19 (assuming a 1.8 percent COLA rate). The state could allocate the remaining $2.4 billion for any one‑time or ongoing Proposition 98 purpose. The higher the share designated for one‑time purposes, the lower the likelihood of having to cut ongoing programs in the event the state budget deteriorates in 2019‑20. The state could encourage districts to use any one‑time funding for addressing retiree pension and health liabilities, addressing deferred maintenance, or purchasing instructional materials and education technology upgrades. In addition to allocating 2018‑19 funding, the Legislature will face decisions about how to allocate one‑time funding arising from an estimated increase in the 2017‑18 guarantee.
Other Decisions Ahead. The Legislature likely will face other important decisions in the coming budget cycle:
- How to Change State Employee Compensation? The state establishes compensation for most of its employees through collective bargaining between the Governor and 21 employee bargaining units. The labor agreements with four bargaining units are scheduled to expire in July 2018. Any successor labor agreement must be ratified by both the Legislature and affected employees before the agreement goes into effect. Future agreements with these bargaining units could increase state General Fund compensation costs for these employees and their managers significantly. For example, each 1 percent increase in pay for these personnel would increase state General Fund costs by more than $40 million annually.
- How Much Assistance to Provide Local Areas That Experienced Recent Fire Damage? In past years, the state has provided financial assistance to areas affected by disasters. In some cases the state has reduced local government match requirements for accessing state disaster funds. In other cases, the state has provided loans or grants to local governments to cover some portion of local tax revenue lost due to fires. The Legislature might be asked to adopt similar policies related to the October 2017 wildfires.
- How to Respond to Proposed Tuition Increases? The state’s two university systems have expressed interest in raising tuition for 2018‑19. At the same time, the Governor has signaled that the January budget could include a 3 percent General Fund base increase for each university system. Were the university boards to raise tuition, the Legislature likely would want to consider whether all or a portion of the additional tuition revenue should augment or supplant proposed increases in state General Fund support.
- How to Manage Projected Prison Population Reduction? Proposition 57 (2016) is expected to reduce the adult inmate population by a few thousand inmates between 2017‑18 and 2018‑19 through a variety of policy changes. Accordingly, the Legislature will need to decide how to adjust prison capacity in response to this reduction. The Legislature could remove all inmates from out‑of‑state contract facilities by early 2018‑19, consistent with the administration’s plan and as assumed in our forecast. Alternatively, the Legislature could close a state prison, which would eventually result in greater savings relative to the administration’s plan.
Chapter 2: Longer‑Term Outlook
In this chapter, we present two estimates of the condition of the state budget through 2021‑22. Our two scenarios are: (1) an economic growth scenario, which assumes the economy continues to grow over the next five years, and (2) a recession scenario.
Scenarios Represent Two of Many Possible Outcomes. The scenarios presented in this chapter are two of many possible economic outcomes that could occur over the next five years. Figure 9 shows revenue performance under our economic growth and recession scenarios. The shaded area in the figure illustrates the uncertainty around these two scenarios. Through 2018‑19, revenues could be a few billion dollars higher or lower than our estimates. After 2018‑19, revenues could be many billions of dollars above or below our illustrative scenarios, with uncertainty growing over each year of the period.
Growth Scenario
Overview of Economic Growth Scenario
Growth in Revenues Outpaces Expenditures. Our economic growth scenario illustrates a California economy that is experiencing steady increases in personal income and a mostly flat stock market over the next five years. Under these assumptions, we assume revenues and transfers grow 5.2 percent over the period. Increases in revenues from the personal income tax drive the majority of this growth over the period. We project spending to grow at roughly the same rate—on average, 4.9 percent per year. (More detail is in the Appendix.)
General Fund Operating Surpluses Assuming Continued Growth. Figure 10 shows our estimates over the outlook period of General Fund operating surpluses (the difference between incoming revenues and estimated spending, under current laws). The top part of the figure shows that the annual surplus is roughly $6 billion over the period. The surplus consists of two components. The constitutionally required rainy day reserve deposits would be just over $1 billion annually over the last three years of the outlook. These reserves would be available for future budget emergencies. The remaining operating surplus of almost $5 billion per year during that same time would be available for new budget commitments—spending increases or tax reductions—or building larger reserves.
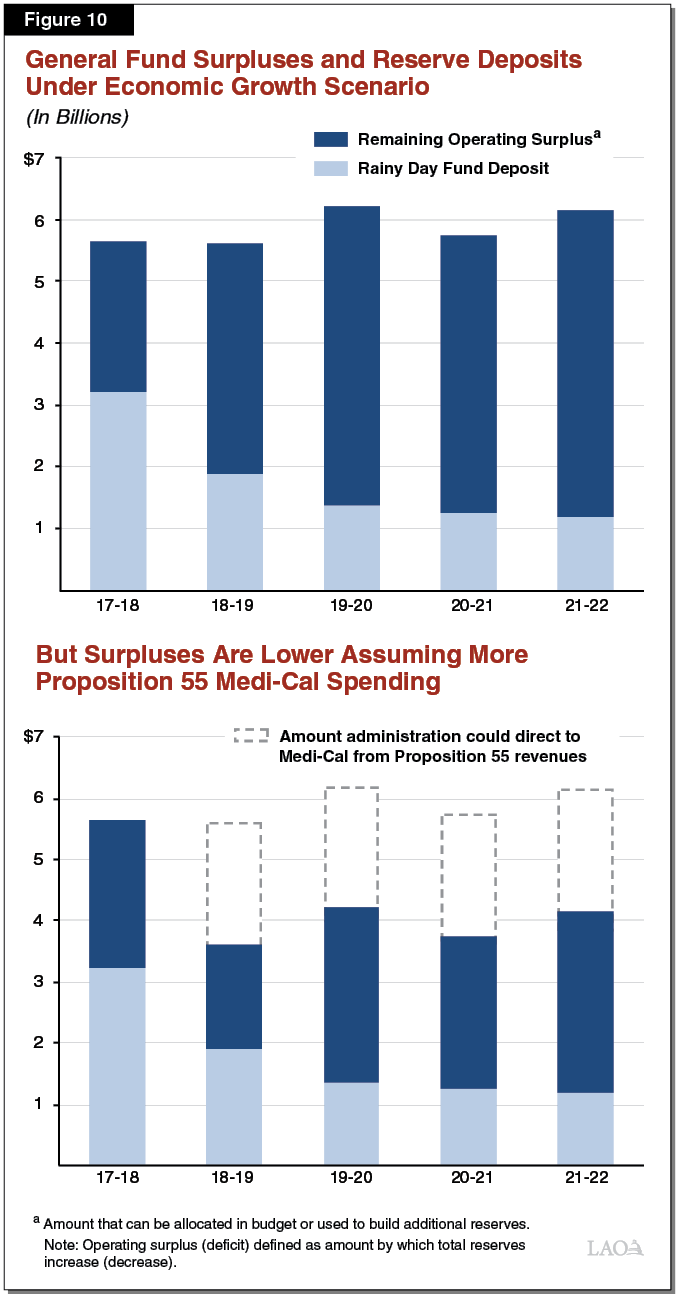
Surpluses Are Lower Assuming Additional Proposition 55 Spending. The top part of Figure 10 assumes the Legislature makes no additional budget commitments. The budget situation, however, would be different under alternative assumptions about spending. In particular, operating surpluses would be lower if spending is higher. For example, expenditures could be higher by up to $2 billion per year under the terms of the Proposition 55 (2016) tax extension. Specifically, Proposition 55 gives the administration significant discretion to allocate up to $2 billion of the measure’s revenues to increase Medi‑Cal spending. The bottom part of Figure 10 shows how General Fund operating surpluses would be lower if the administration’s decisions resulted in an additional $2 billion per year in new Medi‑Cal spending.
Programmatic Trends Assuming Continued Economic Growth
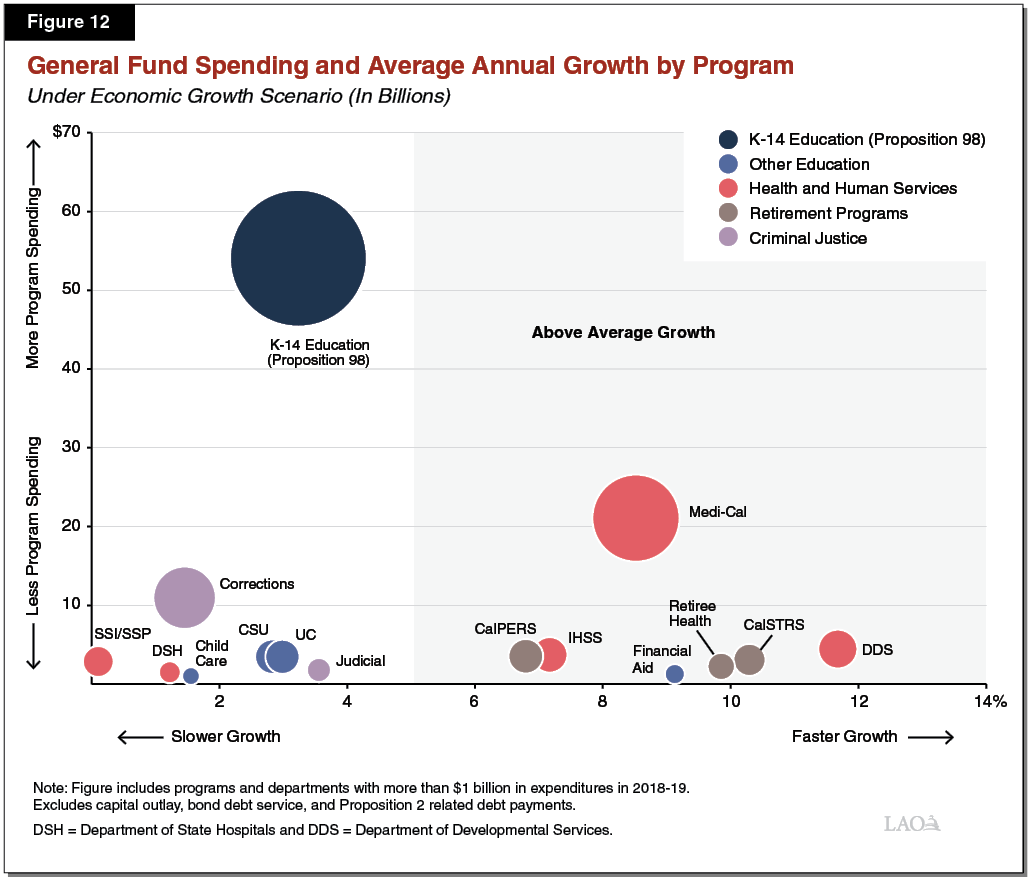
While we project that total state spending will grow 4.9 percent each year, the growth rates for individual programs vary significantly. Figure 11 shows the spending increases in major areas of the budget under our economic growth scenario. Figure 12, shows more programmatic detail for each of these areas. Specifically, Figure 12 compares for major state programs their relative growth rates over the outlook period. Faster growing programs—such as certain health and human services (HHS) and retirement‑related programs—are on the right side of the figure. The figure also shows that the state’s largest program—K‑14 education—is growing slower than the average, but that is offset by much faster growth in the state’s second largest program—Medi‑Cal. We discuss some of these key components in more detail below. (Even more detail on our longer‑term estimates of expenditure growth is available in Appendix Figure 3.)
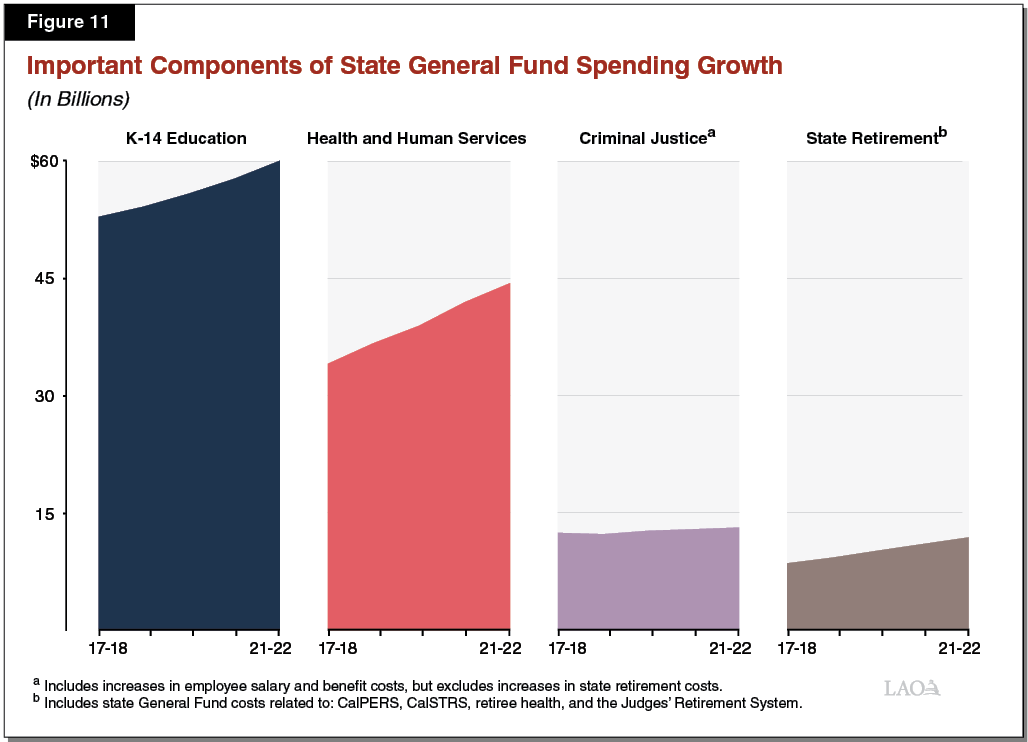
Proposition 98 General Fund Spending Grows Moderately Over the Period. Growth in the minimum guarantee and local property tax revenue are the two factors affecting growth in Proposition 98 General Fund spending. Under our economic growth scenario, the minimum guarantee grows by an average of 3.8 percent per year, driven mainly by steady increases in state revenue and per capita personal income. Regarding property tax revenue, we estimate that assessed property values will increase at a relatively steady rate of about 6 percent per year. This increase primarily reflects strong growth in real estate prices in recent years and the continuation of a modest recovery in new construction. Proposition 98 General Fund spending, in turn, grows somewhat more slowly than the guarantee itself, increasing by an average of 3.2 percent per year over the period.
Significant Growth in HHS Spending Resulting From a Variety of Factors. Between 2017‑18 and 2021‑22, we assume HHS spending grows around 7 percent annually. A few factors account for a significant portion of this growth:
- Higher Per‑Beneficiary Costs. Projected growth in costs per beneficiary is the most significant underlying driver of rising HHS program costs over the outlook period. Changes in costs per beneficiary generally can result from: (1) changes in service utilization and (2) changes in the cost per unit of service. In our outlook, large projected increases in costs per service drive the majority of the growth in costs per beneficiary.
- Increases in Caseload in Most HHS Programs. Continued caseload growth in most HHS programs contributes to rising HHS spending throughout the period. In particular, caseload growth in the Department of Developmental Services and In‑Home Supportive Services (IHSS) is relatively high compared to caseload growth in other HHS programs.
- Anticipated Reductions in Federal Funding. Anticipated reductions in federal funding for the state’s HHS programs over the period are likely to increase General Fund costs for these programs. Major reductions include: (1) our assumption that the state’s managed care organization (MCO) tax expires at the end of 2018‑19 (consistent with current law), which leverages between $1 billion and $2 billion in federal funds annually that offset General Fund Medi‑Cal spending; and (2) scheduled reductions in the federal share of cost for Medi‑Cal’s optional expansion population, which will increase annual state Medi‑Cal costs by $1 billion by 2020‑21 relative to 2017‑18.
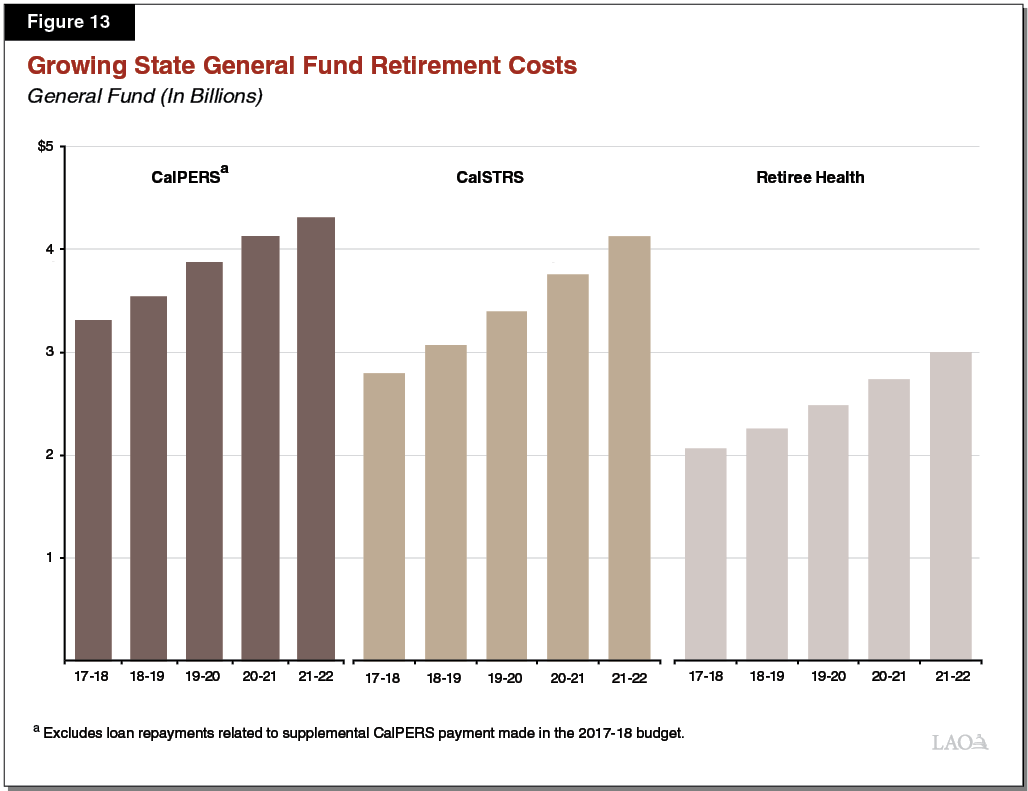
State Retirement, Salary, and Benefit Costs Continue to Rise. State retirement costs include state contributions to CalPERS, the retirement system for state employees; CalSTRS, the teachers’ retirement system; and the Judges’ Retirement System. State retirement costs also include other post‑employment benefits, such as health benefit costs for state retirees. We expect state retirement costs to rise 8.6 percent annually over the forecast period. Furthermore, we assume salary and benefit costs for current state employees will rise 4.5 percent annually. We describe the trends in these rising costs below:
- State Retirement. Figure 13 shows projections of the three largest components of state retirement costs. Increases in costs related to CalPERS and CalSTRS reflect the boards’ recently adopted changes in assumptions regarding investment rate returns and other demographic changes. The state also faces increased retiree health benefit costs as health premiums rise and state retirees live longer in retirement. Together, these result in cost increases to the state of about $1 billion per year.
- Employee Salary and Benefits. We estimate state employee salary and benefit costs will increase pursuant to current labor agreements and adjust salary increases for inflation after those agreements expire. (General Fund costs will be different based on the terms of future agreements.) Together, these assumptions result in General Fund cost increases of several hundred million dollars each year.
Other Notable Programmatic Spending Trends
Minimum Wage Assumed to Reach $15 Per Hour in 2022. A law passed in 2016 (SB 3, Leno) will increase California’s statewide minimum wage over a period of several years, reaching $15 per hour for most workers as soon as January 1, 2022. (While delays are possible under law, we assume that they do not occur.) Overall, we estimate that the upcoming minimum wage increases lead to a net increase in General Fund spending of roughly $2 billion by 2021‑22. (The General Fund increase could be higher or lower by many hundreds of millions of dollars.) This net change includes higher spending in some programs and lower spending in others. For example, wage increases for IHSS providers will increase spending on that program, but the rising minimum wage likely will reduce caseloads—and therefore spending—in the Medi‑Cal program.
Despite Reduction in Inmate Population, Corrections Spending Increasing With Employee Compensation Costs. Our budget outlook reflects the administration’s projection that Proposition 57 will reduce the prison population by several thousand inmates by 2021‑22. (The actual effects could be higher or lower.) We assume this decline allows the California Department of Corrections and Rehabilitation (CDCR) to remove all inmates from out‑of‑state contract facilities by early 2018‑19 and create over $100 million in savings annually by 2021‑22. Despite these savings, General Fund support for CDCR continues to increase. This is primarily due to growth in the cost of employee salaries and health benefits. Specifically, we estimate that annual CDCR employee compensation spending will increase by a few hundred million dollars each year until 2021‑22.
Recession Scenario
Assumes Economy Experiences Recession Beginning in 2019‑20. Our recession scenario assumes a moderate recession begins in the late summer of 2019. The recession is accompanied by declines in the stock market. Under this hypothetical scenario, we assume a roughly $80 billion revenue loss, compared to the growth scenario, over the three fiscal years between 2019‑20 and 2021‑22. This scenario is driven by reductions in revenues from personal and corporate income taxes, which we assume experience 10 percent year‑over‑year declines in 2019‑20 and 2020‑21. (Compared to similar scenarios in our Fiscal Outlook publication in recent years, the recession scenario we display in this report is more severe.)
Formula‑Driven Reductions in Education and Debt Spending. There are two major formula‑driven programs that have constitutionally required minimum funding levels that vary with economic conditions. These are the formulas for determining minimum funding for schools and community colleges (Proposition 98) and reserve deposits and debt payments (Proposition 2). In our recession scenario, we assume the state funds these two programs at their minimum levels, which both decline because of reductions in revenues and, in the case of Proposition 98, personal income. Compared to the growth scenario, required school and community college spending over the period is about $35 billion lower while Proposition 2 debt payment requirements are $1 billion lower. These reductions partially offset revenue losses, mitigating the recession’s impact on the state’s budget bottom line.
Some Caseload‑Driven Programs Grow Faster Under Recession Scenario. Some programs, particularly HHS programs, experience changes in funding levels based on a combination of changes in their number of participants (caseload), the costs per enrollee (price), or the intensity at which participants use services (utilization). Examples of these programs include Medi‑Cal and CalWORKs, which provides cash assistance and services to low‑income individuals. During a recession, these programs experience increases in costs as more people become eligible for their services and caseload increases. To account for these broad trends, we assume caseload‑related expenditures are moderately higher between 2019‑20 and 2021‑22.
General Fund Faces Shortfall in 2021‑22. The top part of Figure 14 shows operating surpluses and deficits under the recession scenario. Assuming the state uses all of its available resources to build more reserves in 2018‑19, it would have accumulated $19.3 billion in reserves at the end of that fiscal year. This reserve balance would be sufficient to cover the state’s operating deficits in 2019‑20 and 2020‑21. By 2021‑22, however, the state would have to use some combination of spending reductions or tax increases to address a remaining $11 billion operating deficit. In short, this remaining operating deficit, the dark red bar in this figure, is the “budget problem” that the Legislature would need to address under this scenario.
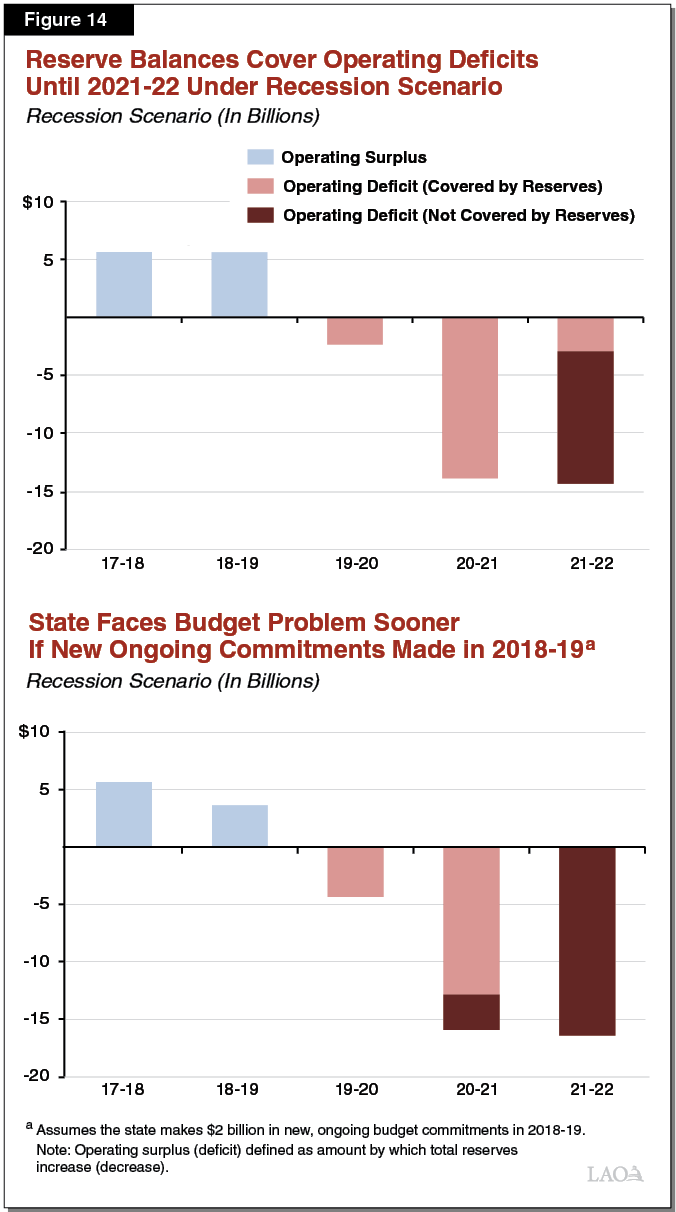
Budget Commitments Would Deplete Reserves Sooner. Our recession scenario assumes the state funds schools and community colleges at the minimum level each year and makes no new budget commitments now or in the future. However, in previous recessions the state has not always reduced Proposition 98 funding to the minimum. Moreover, in light of the positive budget situation, it is unlikely the state would make no new budget commitments in 2018‑19. If spending were higher than we assume in 2018‑19 or later for whatever reason, the state would face more difficult choices—such as reducing spending or increasing taxes—to balance the state budget in a recession scenario. Similarly, keeping Proposition 98 funding higher during a recession would result in somewhat more difficult trade‑offs for the rest of the budget. As a hypothetical example, the bottom part of Figure 14 shows the size of the state’s budget problem if annual spending were higher by $2 billion beginning in 2018‑19. In this case, the state would face a budget problem one year sooner in the recession scenario than under the assumptions displayed earlier.
LAO Comments
State Has Made Significant Progress in Its Ability to Withstand Recession. The budget has enough reserves to cover nearly two‑thirds of a cumulative $30 billion operating deficit in the moderate recession scenario we describe in this report. This represents a notable improvement in the state budget’s resilience and its ability to withstand the next recession.
A Variety of Factors, Other Than Economic Conditions, Can Influence Budget Condition. With our economic growth and recession scenarios, we have endeavored to quantitatively display some of the economic uncertainty faced by the budget. However, in addition to economic uncertainty, the budget faces other uncertainties that could result in a more positive or negative situation. For example, voters could change policies that affect the state’s budget condition through initiatives placed on future ballots. In addition, decisions by a variety of other entities have significant implications for the budget. These include decisions by:
- The Legislature. Although our outlook assumes current laws and policies stay in place, the Legislature will make budgetary and policy decisions that affect the budget’s condition. For example, our forecast assumes the MCO tax will expire at the end of 2018‑19, consistent with current law. Under this assumption, our outlook assumes higher Medi‑Cal expenditures, lower IHSS costs, and higher corporation and insurance tax revenues, relative to what they would be if we assumed the MCO tax package were extended. However, in the future, the Legislature will likely make policy and budgetary decisions in response to the expiration of the tax.
- The State Executive Branch. The provisions of the Proposition 55 tax extension and an agreement regarding the allocation of Proposition 56 revenues give the administration significant discretion in allocating different levels of resources to Medi‑Cal. If a Governor’s administration makes different decisions about those funds, Medi‑Cal spending could be significantly higher than what we assume.
- The Federal Government. Decisions by the federal government can significantly affect the budget’s condition. In particular, our outlook assumes the federal government reauthorizes the Children’s Health Insurance Program—initially at its current federal funding cost share—and assumes no new changes in health care, tax, immigration, trade, or other federal policy. Changes in federal policy, however, could result in benefits or costs to the state budget, economy, and tax revenues.
- Retirement Systems. Future decisions by the state’s retirement systems can influence state costs. For example, the CalPERS board has significant independence to make assumptions about future investment returns and demographic changes. These assumptions have direct and indirect implications for state costs. Our estimates of the state’s annual contributions to CalPERS are based on projected rates published by the system. If the CalPERS board takes action to lower its assumptions about investment returns (or change other assumptions) in the coming months or years, the state could face higher retirement costs than what we currently assume.
Recommend Legislature Use a Portion of Operating Surpluses to Build More Reserves. The extent of the budget’s resilience in a recession scenario critically depends on the Legislature using its operating surpluses to build more reserves. As it crafts the 2018‑19 budget and future budgets, we encourage the Legislature to consider all of the uncertainty faced by the budget in future years and continue its recent practice of building its reserve levels.
Appendix
Appendix Figure 1
Revenue Outlook Through 2021‑22
LAO November 2017 General Fund Estimates (Dollars in Billions)
|
Growth Scenario |
Estimates |
Outlook |
Average Annual Growtha |
|||||
|
2016‑17 |
2017‑18 |
2018‑19 |
2019‑20 |
2020‑21 |
2021‑22 |
|||
|
Personal income tax |
$83.0 |
$90.9 |
$95.8 |
$99.8 |
$104.7 |
$110.5 |
5.0% |
|
|
Sales and use tax |
24.9 |
25.3 |
26.2 |
27.1 |
28.0 |
28.9 |
3.4 |
|
|
Corporation tax |
10.0 |
10.6 |
11.0 |
11.6 |
12.1 |
12.6 |
4.5 |
|
|
Subtotal, Three Largest Revenues |
($117.9) |
($126.8) |
($133.0) |
($138.5) |
($144.8) |
($152.0) |
(4.6%) |
|
|
Insurance tax |
$2.4 |
$2.3 |
$2.4 |
$2.6 |
$2.7 |
$2.8 |
4.3% |
|
|
Other revenues |
1.7 |
1.5 |
1.6 |
1.7 |
1.7 |
1.7 |
2.2 |
|
|
Transfer from/(to) rainy day fund |
‑3.0 |
‑3.2 |
‑1.9 |
‑1.4 |
‑1.2 |
‑1.2 |
‑22.2 |
|
|
Net other transfers, in/(out) |
‑0.5 |
‑0.5 |
0.4 |
0.3 |
0.3 |
0.4 |
N/A |
|
|
Total, Revenues & Transfers |
$118.5 |
$127.0 |
$135.5 |
$141.7 |
$148.2 |
$155.7 |
5.2% |
|
|
Percent Change |
7.1% |
6.7% |
4.6% |
4.6% |
5.0% |
|||
|
Recession Scenario |
Estimates |
Outlook |
Average Annual Growtha |
|||||
|
2016‑17 |
2017‑18 |
2018‑19 |
2019‑20 |
2020‑21 |
2021‑22 |
|||
|
Personal income tax |
$83.0 |
$90.9 |
$95.8 |
$86.2 |
$77.6 |
$82.6 |
‑2.4% |
|
|
Sales and use tax |
24.9 |
25.3 |
26.2 |
26.0 |
25.8 |
26.3 |
1.0 |
|
|
Corporation tax |
10.0 |
10.6 |
11.0 |
9.9 |
8.9 |
10.2 |
‑1.0% |
|
|
Subtotal, Three Largest Revenues |
($117.9) |
($126.8) |
($133.0) |
($122.1) |
($112.3) |
($119.1) |
(‑1.6%) |
|
|
Insurance tax |
$2.4 |
$2.3 |
$2.4 |
$2.6 |
$2.7 |
$2.8 |
4.3% |
|
|
Other revenues |
1.7 |
1.5 |
1.6 |
1.7 |
1.7 |
1.7 |
2.2 |
|
|
Transfer from/(to) rainy day fund |
‑3.0 |
‑3.2 |
‑1.9 |
— |
— |
— |
— |
|
|
Net other transfers, in/(out) |
‑0.5 |
‑0.5 |
0.4 |
0.3 |
0.3 |
0.4 |
N/A |
|
|
Total, Revenues & Transfers |
$118.5 |
$127.0 |
$135.5 |
$126.6 |
$116.9 |
$123.9 |
‑0.6% |
|
|
Percent Change |
7.1% |
6.7% |
‑6.5% |
‑7.7% |
6.0% |
|||
|
aFrom 2017‑18 to 2021‑22. |
||||||||
Appendix Figure 2
Spending Through 2018‑19
LAO November 2017 General Fund Estimates (In Millions)
|
Estimates |
Outlook |
||||
|
2016‑17 |
2017‑18 |
2018‑19 |
Change From 2017‑18 |
||
|
Major Education Programs |
|||||
|
Schools and community collegesa |
$50,084 |
$52,766 |
$54,079 |
2.5% |
|
|
University of California |
3,370 |
3,375 |
3,470 |
2.8 |
|
|
California State University |
3,316 |
3,412 |
3,490 |
2.3 |
|
|
Financial aid |
1,122 |
1,167 |
1,277 |
9.4 |
|
|
Child care |
941 |
982 |
1,022 |
4.0 |
|
|
Major Health and Human Services Programs |
|||||
|
Medi‑Cal |
$18,940 |
$18,889 |
$21,075 |
11.6% |
|
|
Department of Developmental Services |
4,015 |
4,193 |
4,450 |
6.1 |
|
|
In‑Home Supportive Services |
3,506 |
3,480 |
3,715 |
6.8 |
|
|
SSI/SSP |
2,795 |
2,891 |
2,860 |
‑1.1 |
|
|
Department of State Hospitals |
1,717 |
1,435 |
1,501 |
4.6 |
|
|
CalWORKs |
729 |
313 |
318 |
1.6 |
|
|
Major Criminal Justice Programs |
|||||
|
Corrections and Rehabilitation |
$10,292 |
$10,867 |
$10,964 |
0.9% |
|
|
Judiciary |
1,767 |
1,670 |
1,784 |
6.8 |
|
|
Debt service on state bondsb |
$5,313 |
$5,438 |
$5,578 |
2.6% |
|
|
Other programsc |
$13,077 |
$13,659 |
$16,156 |
— |
|
|
Totals |
$120,984 |
$124,536 |
$131,739 |
5.8% |
|
|
aReflects the General Fund component of the Proposition 98 minimum guarantee. bDebt service on general obligation and lease revenue bonds. Does not include: (1) lease revenue debt service for community colleges, which is included under Proposition 98, or (2) UC’s and CSU’s debt service, which is included in their respective line items. cProposition 2 debt payments, which are included in “other programs,” are reflected differently in 2017‑18 compared to 2018‑19. As a result, annual totals are not directly comparable between these years. |
|||||
Appendix Figure 3
Spending by Major Area Through 2021‑22
LAO November 2017 General Fund Estimates (Dollars in Billions)
|
Growth Scenario |
Estimates |
Outlook |
Average Annual Growtha |
|||||
|
2016‑17 |
2017‑18 |
2018‑19 |
2019‑20 |
2020‑21 |
2021‑22 |
|||
|
Education Programs |
||||||||
|
Proposition 98b |
$50.1 |
$52.8 |
$54.1 |
$55.7 |
$57.6 |
$59.9 |
3.2% |
|
|
Non‑Proposition 98 |
8.7 |
8.9 |
9.3 |
9.6 |
9.9 |
10.3 |
3.6 |
|
|
Health and Human Services |
31.7 |
31.2 |
33.9 |
36.3 |
39.4 |
41.9 |
7.7 |
|
|
Criminal Justice |
12.1 |
12.5 |
12.7 |
13.0 |
13.2 |
13.4 |
1.7 |
|
|
Debt service on state bondsc |
5.3 |
5.4 |
5.6 |
5.7 |
6.2 |
7.0 |
6.3 |
|
|
Other programs |
13.1 |
13.7 |
16.2 |
16.5 |
17.3 |
18.2 |
—d |
|
|
Totals |
$121.0 |
$124.5 |
$131.7 |
$136.8 |
$143.7 |
$150.7 |
4.9% |
|
|
Percent Change |
— |
2.9% |
5.8% |
3.9% |
5.0% |
4.9% |
||
|
Recession Scenario |
Estimates |
Outlook |
Average Annual Growtha |
|||||
|
2016‑17 |
2017‑18 |
2018‑19 |
2019‑20 |
2020‑21 |
2021‑22 |
|||
|
Education Programs |
||||||||
|
Proposition 98b |
$50.1 |
$52.8 |
$54.1 |
$47.8 |
$44.2 |
$46.8 |
‑2.9% |
|
|
Non‑Proposition 98 |
8.7 |
8.9 |
9.3 |
9.6 |
9.9 |
10.3 |
3.6 |
|
|
Health and Human Services |
31.7 |
31.2 |
33.9 |
36.8 |
40.4 |
42.9 |
8.3 |
|
|
Criminal Justice |
12.1 |
12.5 |
12.7 |
13.0 |
13.2 |
13.4 |
1.7 |
|
|
Debt service on state bondsc |
5.3 |
5.4 |
5.6 |
5.7 |
6.2 |
7.0 |
6.3 |
|
|
Other programs |
13.1 |
13.7 |
16.2 |
16.1 |
16.9 |
17.9 |
—d |
|
|
Totals |
$121.0 |
$124.5 |
$131.7 |
$129.0 |
$130.9 |
$138.4 |
2.7% |
|
|
Percent Change |
— |
2.9% |
5.8% |
‑2.1% |
1.4% |
5.7% |
||
|
aFrom 2017‑18 to 2021‑22. bReflects the General Fund component of the Proposition 98 minimum guarantee. cDebt service on general obligation and lease revenue bonds generally used for infrastructure. Does not include: (1) lease revenue debt service for community colleges, which is included under Proposition 98, or (2) UC’s and CSU’s debt service, which is included in non‑Proposition 98 education spending. dProposition 2 debt payments, which are included in “other programs,” are reflected differently in 2017‑18 compared to 2018‑19. As a result, annual totals are not directly comparable between these years. Note: Program groups are defined to include departments listed in Appendix Figure 1. Each program area excludes smaller departments and, as a result, Health and Human Services differs from total displayed in Figure 11. |
||||||||