At key times during the state’s budget cycle, we post tables containing important information about the education parts of the budget. This January posting reflects the 2016-17 Governor’s Budget proposals. The tables cover Proposition 98, K-12 education, child care and preschool, higher education, and student financial aid.

January 14, 2016
EdBudget Tables
Proposition 98 Overview- Tracking Changes in the Proposition 98 Minimum Guarantee
- Tracking Changes in Proposition 98 Maintenance Factor Obligation
- Proposition 98 Funding by Segment and Source
- 2015-16 Proposition 98 Changes
- 2016-17 Proposition 98 Changes
- Governor's Budget Plan Pays Down $1.4 Billion of K-14 Mandate Backlog
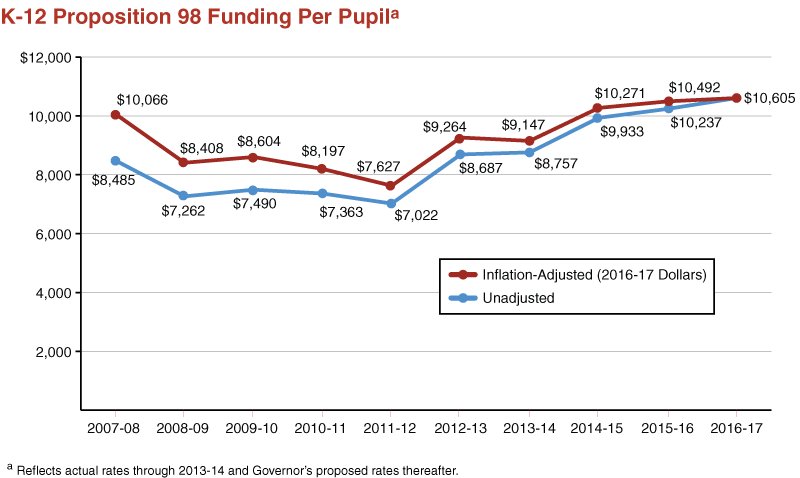
- K-12 Proposition 98 Funding Per Pupil
- K-12 Proposition 98 Funding by Program
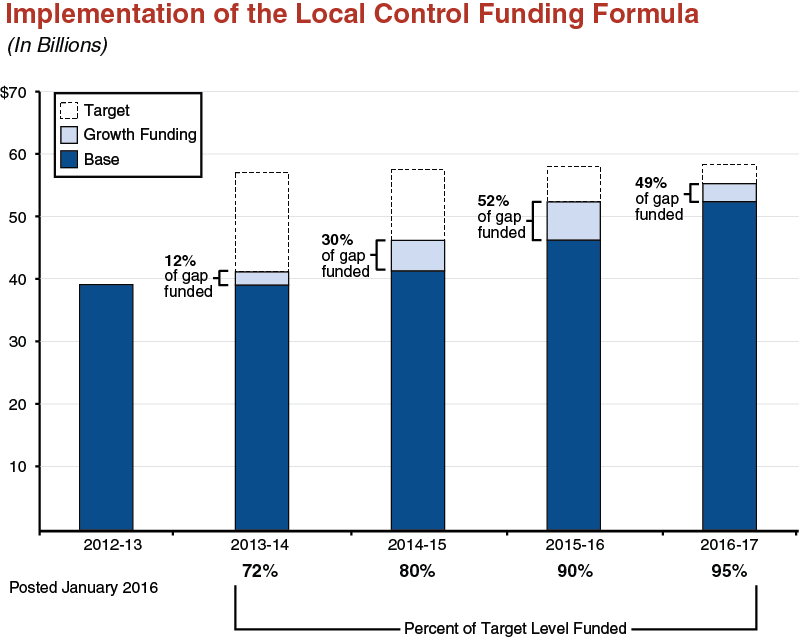
- Tracking Implementation of the Local Control Funding Formula
- Breakdown of LCFF Funding for School Districts and Charter Schools
- Local Control Funding Formula Per-Student Rates
- Additional Workload and Funding for the California Department of Education (CDE)
- Child Care and Preschool Budget
- 2016-17 Child Care and Preschool Changes
- Child Care and Preschool Subsidized Slots
- Higher Education Funding
- Higher Education General Fund Support
- University of California Budget
- California State University Budget
- Hastings College of the Law Budget
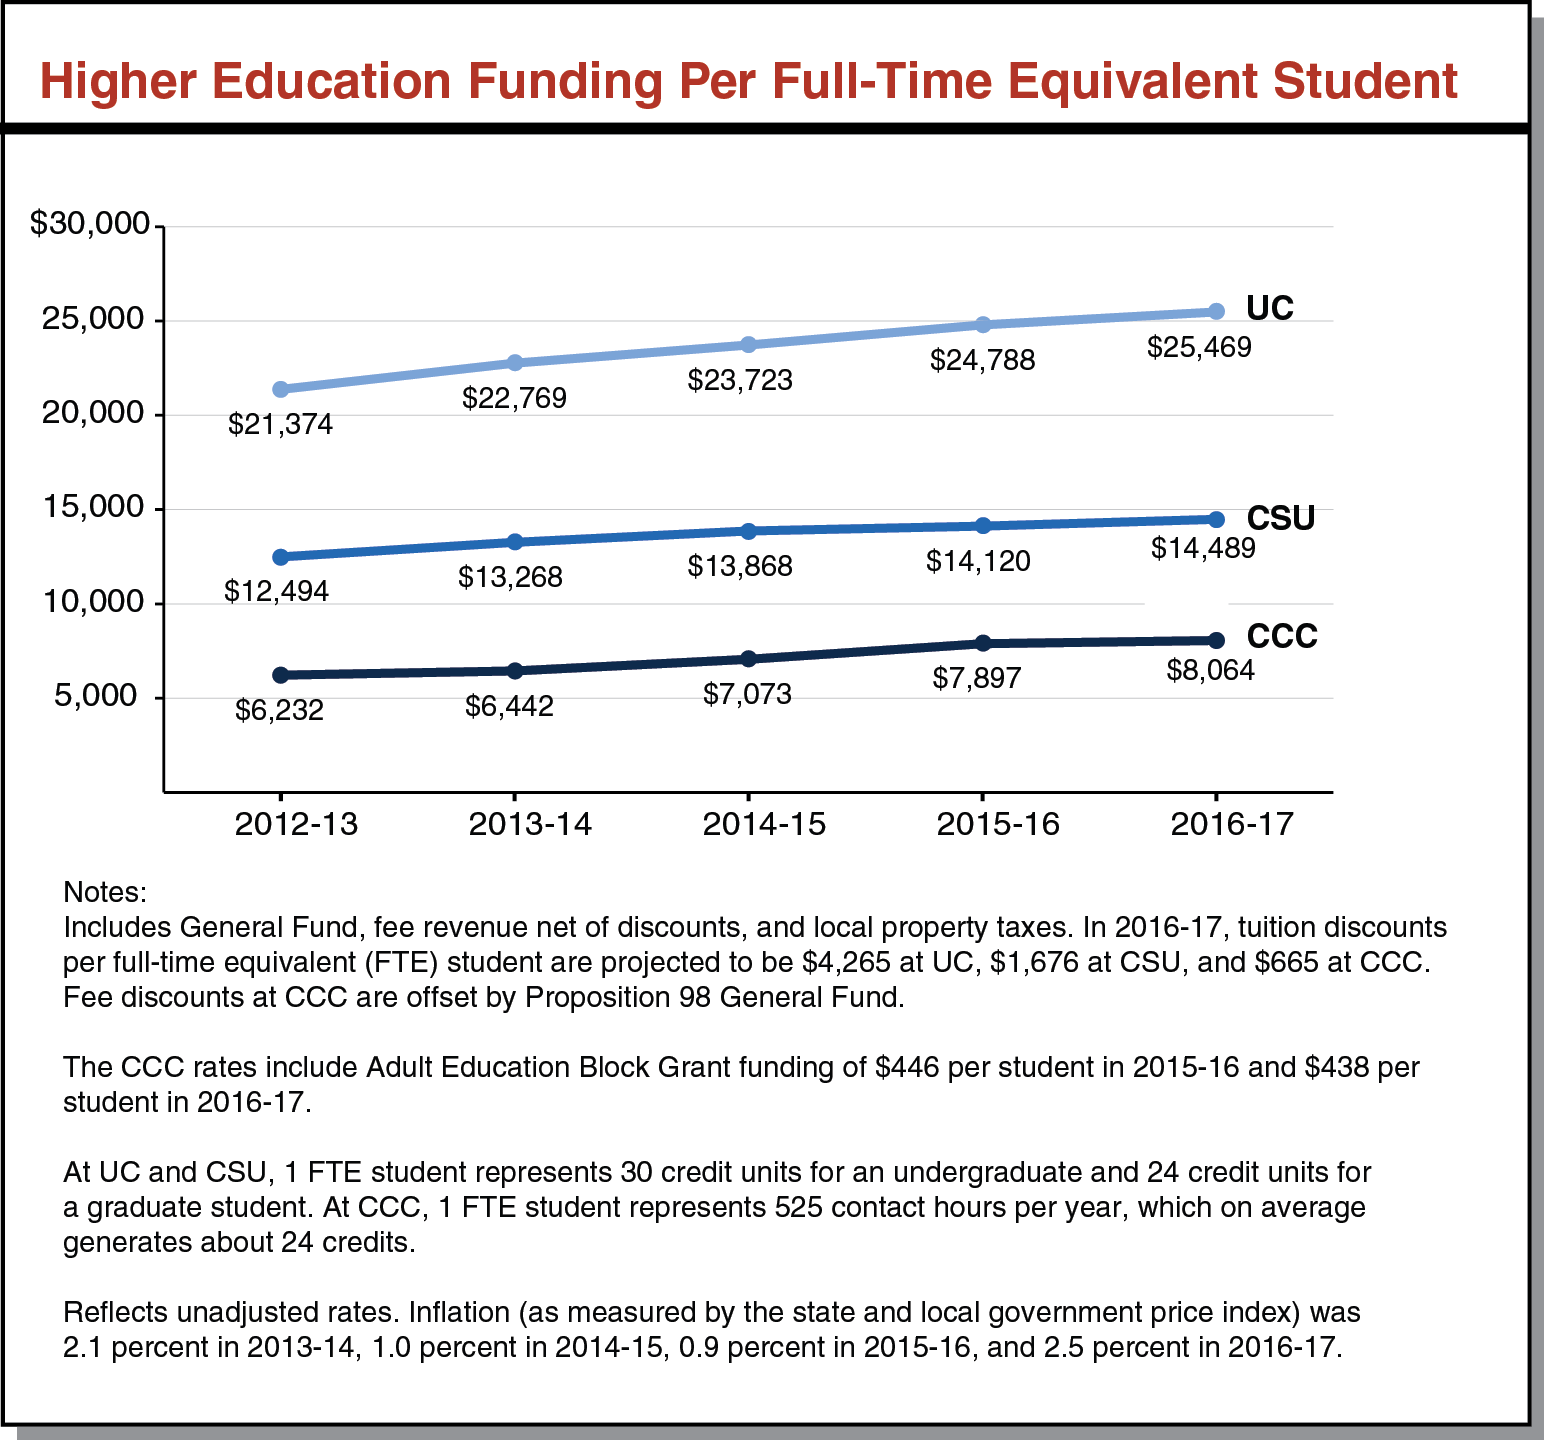
- Higher Education Funding Per Full-Time Equivalent Student
- California Community College Proposition 98 Funding by Program
- Proposed Funding for Major Workforce Education and Training Programs in California
- Higher Education Annual Tuition and Fees
- Higher Education Enrollment
- California Student Aid Commission Budget
- Cal Grant Spending
- Cal Grant Recipients
- Middle Class Scholarship Programs
Proposition 98 Overview
Tracking Changes in the Proposition 98 Minimum Guarantee
(In Millions)
|
2014-15 |
2015-16 |
||||||
|
June 2015 Estimate |
January 2016 Estimate |
Change |
June 2015 Estimate |
January 2016 Estimate |
Change |
||
|
Minimum Guarantee |
|||||||
|
General Fund |
$49,608 |
$49,554 |
-$54 |
$49,416 |
$49,992 |
$575 |
|
|
Local property tax |
16,695 |
17,136 |
441 |
18,993 |
19,183 |
191 |
|
|
Totals |
$66,303 |
$66,690 |
$387 |
$68,409 |
$69,175 |
$766 |
|
|
Posted January 2016. |
|||||||

Tracking Changes in Proposition 98 Maintenance Factor Obligationa
(In Millions)
|
Year |
Amount Created/Paid (+/-) |
Amount Outstandingb |
|
2011-12 |
— |
$10,606 |
|
2012-13 |
-$5,170 |
5,827 |
|
2013-14 |
— |
6,199 |
|
2014-15 |
-5,392 |
781 |
|
2015-16 |
-810 |
— |
|
2016-17 |
548 |
548 |
|
a Reflects final data for 2011-12 through 2013-14 and January 2016 estimates for 2014-15 through 2016-17. b Outstanding maintenance factor grows each year with changes in per capita personal income and K-12 average daily attendance. Posted January 2016. |
||
Proposition 98 Funding by Segment and Source
(Dollars in Millions)
|
2014-15 Revised |
2015-16 Revised |
2016-17 Proposed |
Change From 2015-16 |
||
|
Amount |
Percent |
||||
|
K-12 Educationa |
|||||
|
General Fund |
$44,496 |
$44,536 |
$45,442 |
$906 |
2.0% |
|
Local property tax |
14,834 |
16,560 |
17,802 |
1,242 |
7.5 |
|
Subtotals |
($59,330) |
($61,096) |
($63,244) |
($2,148) |
(3.5%) |
|
California Community Collegesb |
|||||
|
General Fund |
$4,979 |
$5,373 |
$5,447 |
$74 |
1.4% |
|
Local property tax |
2,302 |
2,624 |
2,812 |
188 |
7.2 |
|
Subtotals |
($7,281) |
($7,997) |
($8,259) |
($262) |
(3.3%) |
|
Other Agenciesc |
$80 |
$82 |
$83 |
— |
0.3% |
|
Totals |
$66,690 |
$69,175 |
$71,585 |
$2,410 |
3.5% |
|
General Fund |
$49,554 |
$49,992 |
$50,972 |
$980 |
2.0% |
|
Local property tax |
17,136 |
19,183 |
20,613 |
1,430 |
7.5% |
|
aIncludes State Preschool in 2014-15 and 2015-16 and proposed early education block grant in 2016-17. bIncludes $500 million for adult education regional consortia in 2015-16 and 2016-17. cConsists entirely of General Fund. Posted January 2016. |
|||||
2015-16 Proposition 98 Changes
(In Millions)
|
2015-16 Budget Act Proposition 98 Spending |
$68,409 |
|
Technical adjustments |
|
|
Make LCFF adjustments |
-$91 |
|
Other |
43 |
|
Subtotal |
(-$48) |
|
Policy Changes |
|
|
Pay down K-12 mandate backlog |
$681 |
|
Pay down CCC mandate backlog |
73 |
|
Fund CTE Incentive Grant for Secondary Schools (year two of three) |
60a |
|
Subtotal |
($814) |
|
Total Changes |
$766 |
|
Revised 2015-16 Proposition 98 Spending |
$69,175 |
|
aBudget includes additional $240 million from other Proposition 98 funds. LCFF = Local Control Funding Formula and CTE = Career Technical Education. Posted January 2016. |
|
2016-17 Proposition 98 Changes
(In Millions)
|
Revised 2015-16 Proposition 98 Spending |
$69,175 |
|
Technical Adjustments |
|
|
Remove prior-year one-time payments |
-$1,446 |
|
Make other adjustments |
-115 |
|
Adjust categorical programs for changes in attendance |
-16 |
|
Make LCFF adjustments |
101 |
|
Revise estimate of energy efficiency funds |
58 |
|
Annualize funding for previously approved preschool slot increases |
31 |
|
Subtotal |
(-$1,386) |
|
K-12 Education |
|
|
Increase LCFF Funding |
$2,825 |
|
Fund CTE Incentive Grant for Secondary Schools (year two of three) |
240a |
|
Provide 0.47 percent COLA for select categorical programs |
23 |
|
Fund truancy and dropout prevention program |
7 |
|
Fund High Speed Network |
5b |
|
Support Exploratorium |
4 |
|
Fund improvement of web-based tools for state accountability system |
1 |
|
Shift funding for transitional kindergarten and preschool into new block grant |
0 |
|
Remove prior-year augmentation for infants and toddlers with disabilities |
-30 |
|
Subtotal |
($3,073) |
|
California Community Colleges |
|
|
Fund deferred maintenance and instructional equipment (one time) |
$255 |
|
Implement workforce recommendations of BOG task force |
200 |
|
Fund 2 percent enrollment growth |
115 |
|
Make CTE Pathways Initiative ongoing |
48 |
|
Augment Basic Skills Initiative |
30 |
|
Provide 0.47 percent COLA for apportionments |
29 |
|
Fund Innovation Awards at community colleges (one time) |
25 |
|
Increase funding for Institutional Effectiveness Initiative |
10 |
|
Fund development of “zero-textbook-cost” degree programs |
5 |
|
Improve systemwide data security |
3 |
|
Increase apprenticeship reimbursement rate |
2 |
|
Provide 0.47 percent COLA for selected student support programs |
1 |
|
Subtotal |
($723) |
|
Total Changes |
$2,410 |
|
2016-17 Proposition 98 Spending |
$71,585 |
|
aBudget includes additional $60 million from other Proposition 98 funds. bBudget includes additional $3.5 million from other Proposition 98 funds. LCFF = Local Control Funding Formula, COLA = cost-of-living adjustment, CTE = Career Technical Education, and BOG = Board of Governors. Posted January 2016. |
|
Governor’s Budget Plan Pays Down $1.4 Billion of K-14 Mandate Backlog
(In Millions)
|
K-12 Education |
California Community Colleges |
Totals |
|
|
Pay down scored to: |
|||
|
2014-15 |
$339 |
$3 |
$342 |
|
2015-16 |
681 |
73 |
754 |
|
Settle-up payment |
229 |
— |
229 |
|
Prior-year reappropriation |
32 |
— |
32 |
|
Totals |
$1,281 |
$76 |
$1,357 |
|
Posted January 2016. |
|||
K-12 Education
K-12 Education Programs Funded by Proposition 98
(Dollars In Millions)
|
2014-15 Actual |
2015-16 Revised |
2016-17 Proposed |
Change From 2015-16 |
|||
|
Amount |
Percent |
|||||
|
LCFF–Districtsa |
$47,410 |
$52,032 |
$54,916 |
$2,884 |
6% |
|
|
LCFF–County Offices of Education |
$1,017 |
$1,019 |
$1,021 |
$2 |
—b |
|
|
Preschool Programs |
||||||
|
Targeted Play and Learning Block Grant |
— |
— |
$1,654 |
$1,654 |
N/A |
|
|
State Preschoolc |
$654 |
$835 |
— |
-835 |
-100% |
|
|
Transitional Kindergarten |
604 |
686 |
— |
-686 |
-100 |
|
|
Preschool QRIS Grant |
50 |
50 |
— |
-50 |
-100 |
|
|
Subtotals |
($1,308) |
($1,571) |
($1,654) |
($83) |
(5%) |
|
|
Other Categorical Programs |
||||||
|
Special Education |
$3,816 |
$3,850 |
$3,808 |
-$42 |
-1% |
|
|
After School Education and Safety |
547 |
547 |
547 |
— |
— |
|
|
Energy Efficiency Grants |
279 |
313 |
365 |
52 |
17 |
|
|
Mandate Block Grant |
218 |
219 |
219 |
-1 |
— |
|
|
Child Nutrition |
159 |
164 |
163 |
-1 |
— |
|
|
Charter School Facility Grants |
92 |
112 |
112 |
— |
— |
|
|
Student Assessments |
127 |
126 |
110 |
-16 |
-13 |
|
|
Foster Youth Services Coordinating Program |
15 |
25 |
25 |
— |
— |
|
|
Partnership Academiesd |
21 |
21 |
21 |
— |
— |
|
|
Adults in Correctional Facilities |
—e |
—e |
15 |
N/A |
N/A |
|
|
Safe Neighborhood and Schools Program |
— |
— |
7 |
N/A |
N/A |
|
|
County Offices of Education Fiscal Oversight |
5 |
5 |
5 |
— |
— |
|
|
Specialized Secondary Programs |
5 |
5 |
5 |
— |
— |
|
|
Agricultural Vocational Education |
4 |
4 |
4 |
— |
— |
|
|
Otherf |
4,406 |
1,131 |
246 |
-885 |
-78 |
|
|
Subtotals |
($9,695) |
($6,525) |
($5,654) |
(-$871) |
(-13%) |
|
|
Totals |
$59,380 |
$61,146 |
$63,244 |
$2,097 |
3% |
|
|
aExcludes $726 million in LCFF funding for Transitional Kindergarten (TK). TK numbers below reflect LAO estimates. bLess than 0.5 percent. cDoes not include wrap care provided by non-local education agencies. dIn each of the past three years, Partnership Academies also have received between $8 million and $9 million from the California Community College’s CTE Pathways Program. eIn each of these years, the state provided program with $15 million in unspent prior-year funds. fIncludes one-time allocations for mandate backlog payments, CTE Incentive Grants for Secondary Schools, grants to expand broadband Internet access, various other one-time expenditures, and programs with less than $4 million in ongoing funding. CTE = Career Technical Education; LCFF = Local Control Funding Formula; and QRIS = Quality Rating and Improvement System. Posted January 2016. |
||||||
Breakdown of LCFF Funding for School Districts and Charter Schools
LAO Estimates (Dollars In Millions)
|
2014-15 Actual |
2015-16 Revised |
2016-17 Proposed |
Change From 2015-16 |
|||
|
Amount |
Percent |
|||||
|
Main Components |
||||||
|
Base fundinga |
$37,567 |
$42,740 |
$45,155 |
$2,415 |
6% |
|
|
Supplemental funding |
4,725 |
5,378 |
5,693 |
315 |
6 |
|
|
Concentration funding |
2,756 |
3,136 |
3,320 |
183 |
6 |
|
|
Subtotals |
($45,048) |
($51,254) |
($54,167) |
($2,913) |
(6%) |
|
|
Add-Ons |
||||||
|
HTS and TIIG |
$1,304 |
$1,304 |
$1,304 |
— |
— |
|
|
Minimum state aid |
113 |
113 |
113 |
— |
— |
|
|
Economic recovery target |
15 |
23 |
31 |
$8 |
33% |
|
|
Otherb |
1,534 |
24 |
27 |
3 |
15 |
|
|
Subtotals |
($2,966) |
($1,463) |
($1,475) |
($11) |
(1%) |
|
|
Totals |
$48,014 |
$52,718 |
$55,642 |
$2,924 |
6% |
|
|
aIncludes funding for Transitional Kindergarten and Necessary Small Schools. bIncludes Basic Aid Choice, Court-Ordered Voluntary Pupil Transfer, Basic Aid Supplemental Charter School Adjustment, categorical payments to joint powers authorities and the State Special Schools, $1.5 billion to undo payment deferrals in 2014-15, and $3.5 million to support the Exploratorium in San Francisco in 2016-17. LCFF = Local Control Funding Formula; HTS = Home to School Transportation; and TIIG = Targeted Instructional Improvement Grant. Posted January 2016. |
||||||
Local Control Funding Formula Per-Student Rates
Actual 2016-17 School District and Charter School Rates Under Governor’s Budget
|
Grade Span |
Base |
Supplementala |
Concentrationb |
|
K-3 |
$7,454 |
$1,491 |
$3,727 |
|
4-6 |
6,852 |
1,370 |
3,426 |
|
7-8 |
7,056 |
1,411 |
3,528 |
|
9-12 |
8,388 |
1,678 |
4,194 |
|
aEquals 20 percent of the base rate. Generated for each district student who is a foster youth, English learner, or low income (EL/LI). bEquals 50 percent of the base rate. When EL/LI students comprise more than 55 percent of total district enrollment, generated for each EL/LI student above that threshold. Posted January 2016. |
|||
Additional Workload and Funding for the California Department of Education (CDE)
2016-17 Governor’s Budget (In Thousands)
|
New Workload |
Funding |
LAO Recommendation and Rationale |
|
Upgrade Standardized Account Code System (includes contract costs). $3.6 million one-time state General Fund and $3.6 million one-time federal funds. |
$7,200 |
Recommend Oversight Hearing. Project has been fraught with more than five years of delays. State agencies have been inconsistent in explaining causes of delays. In early April, CDE submitted new project proposal. |
|
Ensure schools understand the importance of providing appropriate services to all English learners, pursuant to DJ v. California settlement. Ongoing state General Fund. |
318 |
Recommend Approval. This appropriation helps CDE comply with a 2015 court settlement. Recommend re-evaluating funding in future years, as further developments to the state’s accountability system may render these efforts redundant. |
|
Establish an advisory committee to help CDE select language development assessments for deaf and hard of hearing children aged birth to five. Provide ongoing technical assistance to local education agencies (LEAs) in implementing these assessments. Pursuant to Chapter 652 of 2015 (SB 210, Galgiani). State General Fund, $194,000 one time and $60,000 ongoing. |
254 |
Recommend Approval. This appropriation helps CDE to implement recent legislation. |
|
Develop program guidelines to assist teachers and parents in supporting students with dyslexia. Provide ongoing technical assistance to LEAs in implementing these guidelines. Pursuant to Chapter 647 of 2015 (AB 1369, Frazier). State General Fund, $140,000 ongoing and $67,000 one time. |
207 |
Recommend Approval. This appropriation helps CDE to implement recent legislation. |
|
Undertake additional technical assistance and monitoring, as more agencies are participating in the at-risk afterschool meals component of Child and Adult Care Food Program. Ongoing federal funding. |
194 |
Recommend Approval. Department indicates that participation in program is 23 percent higher in 2015-16 compared to 2014-15. It anticipates further growth of 20 percent between 2015-16 and 2016-17. |
|
Provide training and assistance to agencies that are operating Child and Adult Care Food Programs and still implementing changes required by the federal Healthy and Hunger Free Kids Act (2010). Provides limited-term federal funding of $100,000 in 2016-17 and $100,000 in 2017-18. |
100 |
Recommend Approval. Some agencies still are undertaking required program changes and likely would benefit from additional CDE support during transition. |
|
Collect Educator Effectiveness Block Grant expenditure data from LEAs by July 1, 2018 and submit a report to the Legislature by January 1, 2019. Pursuant to Chapter 13 of 2015 (AB 104, Weber). Provide limited-term state General Fund of $54,000 in 2016-17 and $81,000 in 2017-18. |
54 |
Recommend Approval. This appropriation helps CDE to implement recent legislation. |
|
Establish best practices for preventing child abuse and post related resources online. Pursuant to Chapter 748 of 2015 (AB 1058, Baker). One-time state General Fund. |
30 |
Recommend Approval. This appropriation helps CDE to implement recent legislation. |
|
Administer fee waiver program for homeless youth who take high school equivalency exams. Pursuant to Chapter 384 of 2015 (SB 252, Leno). State General Fund, $21,000 ongoing and $4,000 one time. |
25 |
Recommend Approval. This appropriation helps CDE to implement recent legislation. |
|
Total |
$8,382 |
Child Care and Preschool
Child Care and Preschool Budget
(Dollars in Millions)
|
2014-15 Revised |
2015-16 Reviseda |
2016-17 Proposed |
Change From 2015-16 |
||
|
Amount |
Percent |
||||
|
Expenditures |
|||||
|
CalWORKs Child Care |
|||||
|
Stage 1 |
$330 |
$410 |
$394 |
-$17 |
-4% |
|
Stage 2b |
364 |
414 |
422 |
8 |
2 |
|
Stage 3 |
223 |
278 |
316 |
38 |
14 |
|
Subtotals |
($917) |
($1,103) |
($1,132) |
($29) |
(3%) |
|
Non-CalWORKs Child Care |
|||||
|
General Child Carec |
$531 |
$450 |
$450 |
—d |
—d |
|
Alternative Payment |
182 |
251 |
255 |
$4 |
2% |
|
Migrant child care |
28 |
29 |
29 |
—d |
—d |
|
Care for Children With Severe Disabilities |
2 |
2 |
2 |
—d |
—d |
|
Infant and Toddler QRIS Grant (one-time) |
— |
24 |
— |
-24 |
-100 |
|
Subtotals |
($742) |
($756) |
($736) |
(-$20) |
(-3%) |
|
Preschool Programse |
|||||
|
State Preschool |
$604 |
$835 |
— |
-$835 |
-100% |
|
Transitional Kindergarten |
604f |
686f |
— |
-686 |
-100 |
|
Preschool QRIS Grant |
50 |
50 |
— |
-50 |
-100 |
|
Targeted Play and Learning Block Grant |
— |
— |
$1,654g |
1,654 |
— |
|
Subtotals |
($1,258) |
($1,571) |
($1,654) |
($83) |
(5%) |
|
Support Programs |
$73 |
$76 |
$79 |
$3 |
3% |
|
Totals |
$2,991 |
$3,506 |
$3,600 |
$95 |
3% |
|
Funding |
|||||
|
Non-Proposition 98 General Fund |
$809 |
$977 |
$998 |
$21 |
2% |
|
Proposition 98 General Fund |
1,258 |
1,571 |
1,654 |
83 |
5 |
|
Federal CCDF |
570 |
573 |
583 |
10 |
2 |
|
Federal TANF |
353 |
385 |
365 |
-20 |
-5 |
|
aReflects Department of Social Services’ revised Stage 1 estimates for cost of care and caseload. Reflects budget act appropriation for all other programs. bDoes not include $9.2 million provided to community colleges for certain child care services. cIn 2014-15, includes funding for all State Preschool wrap slots. Beginning in 2015-16, includes funding for State Preschool wrap slots provided only by non-LEAs. dLess than $500,000 or 0.5 percent. eSome CalWORKs and non-CalWORKs child care providers use their funding to offer preschool. fLAO estimate based on average daily attendance in Transitional Kindergarten, as reported by CDE. gConsists of $878 million shifted from State Preschool, $726 million shifted from Transitional Kindergarten, and $50 million shifted from the Preschool QRIS Grant. QRIS = Quality Rating and Improvement System; CCDF = Child Care and Development Fund; TANF=Temporary Assistance for Needy Families; CDE = California Department of Education; and LEA = local education agency. Posted January 2016. |
|||||
2016-17 Child Care and Preschool Changes
(In Millions)
|
Change |
Proposition 98 General Fund |
Non-Proposition 98 General Fund |
Federal Funds |
Total |
|
Preschool Programs |
||||
|
Creates new early education block grant |
$1,654 |
— |
— |
$1,654 |
|
Moves part-day State Preschool and full-day wrap run by LEAs into proposed early education block grant |
-878 |
— |
— |
-878 |
|
Moves Transitional Kindergarten into proposed early education block grant |
-726 |
— |
— |
-726 |
|
Moves Preschool QRIS Grant into early education block grant |
-50 |
— |
— |
-50 |
|
Before moving programs into block grant, (1) adjusts State Preschool for annualization of slots initiated in 2015-16 and statutory growth and COLA,a and (2) adjusts Transitional Kindergarten for increases in LCFF |
76 |
$3b |
— |
80 |
|
Subtotals |
($76) |
($3) |
(—) |
($80) |
|
Child Care Programs |
||||
|
Makes CalWORKs caseload and average cost of care adjustments |
— |
$38 |
-$20 |
$18 |
|
Annualizes funding for Regional Market Rate ceiling increase initiated in 2015-16 |
— |
10 |
-1 |
9 |
|
Adjusts non-CalWORKs child care programs for statutory growth and COLAa |
— |
4 |
— |
4 |
|
Annualizes funding for 5 percent license-exempt rate increase initiated in 2015-16 |
— |
4 |
1 |
5 |
|
Removes one-time Infant and Toddler QRIS Grant funds |
— |
-24 |
— |
-24 |
|
Subtotals |
(—) |
($32) |
(-$19) |
($12) |
|
Other Technical Adjustments |
$7 |
-$14 |
$10 |
$3 |
|
Totals |
$83 |
$21 |
-$9 |
$95 |
|
aReflects 0.13 percent growth in the birth-through-four population and 0.47 percent COLA. bAnnualizes the cost of the 1,200 non-LEA, full-day State Preschool wrap slots initiated January 1, 2015. COLA = cost-of-living adjustment and LEA = local education agency. Posted January 2016. |
||||
Child Care and Preschool Subsidized Slots
Average Monthly Full-Day Slots, Except for State Preschool–Part Day
|
2014-15 Reviseda |
2015-16 Revisedb |
2016-17 Proposed |
Change From 2015-16 |
|||
|
Amount |
Percent |
|||||
|
CalWORKs Child Care |
||||||
|
Stage 1 |
37,442 |
44,154 |
42,995 |
-1,159 |
-3% |
|
|
Stage 2c |
51,098 |
50,971 |
49,777 |
-1,194 |
-2 |
|
|
Stage 3 |
33,427 |
35,845 |
36,335 |
490 |
1 |
|
|
Subtotals |
(121,967) |
(130,970) |
(129,107) |
(-1,863) |
(-1%) |
|
|
Non-CalWORKs Child Care |
||||||
|
General Child Cared |
27,359 |
28,738 |
42,134 |
13,396 |
47% |
|
|
Alternative Payment |
25,967 |
32,852 |
29,344 |
-3,508 |
-11 |
|
|
Migrant child care |
3,049 |
3,060 |
3,064 |
4 |
—e |
|
|
Care for Children With Severe Disabilities |
169 |
105 |
105 |
— |
— |
|
|
Subtotals |
(56,544) |
(64,755) |
(74,647) |
(9,892) |
(15%) |
|
|
Preschool Programs |
||||||
|
State Preschool–part day |
96,087 |
98,956 |
— |
-98,956 |
-100% |
|
|
State Preschool–full day |
50,989 |
58,504 |
— |
-58,504 |
-100 |
|
|
Transitional Kindergarten |
83,000 |
83,000f |
— |
-83,000 |
-100 |
|
|
Targeted Play and Learning Block Grant |
— |
— |
251,409g |
251,409 |
N/A |
|
|
Subtotals |
(230,076) |
(240,460) |
(251,409) |
(10,949) |
(5%) |
|
|
Totals |
408,587 |
436,185 |
455,163 |
18,978 |
4% |
|
|
aReflects actuals for all stages of CalWORKs, DOF estimates for Migrant child care and Care for Children With Severe Disabilities, CDE estimates for Transitional Kindergarten, and LAO estimates for all other programs. bReflects DSS estimates for CalWORKs Stage 1; DOF estimates for CalWORKs Stage 2 and 3, Migrant child care, and Care for Children With Severe Disabilities; CDE estimates for Transitional Kindergarten, and LAO estimates for all other programs. cDoes not include certain community college child care slots (1,300 to 1,800 slots annually). dState Preschool wrap slots for non-LEAs (funded by General Child Care) are included in State Preschool–full day line in 2014-15 and 2015-16. eLess than 0.5 percent. fAssumes that participation in Transitional Kindergarten remains flat in 2015-16. gReflects DOF estimate of number of slots that otherwise would have been funded in State Preschool (165,909) and Transitional Kindergarten (85,500). CDE = California Department of Education; DSS = Department of Social Services; DOF = Department of Finance; LAO = Legislative Analyst’s Office; and LEA = local education agency. Posted January 2016. |
||||||
Higher Education
Higher Education Fundinga
(Dollars in Millions)
|
2014-15 Actual |
2015-16 Estimated |
2016-17 Proposed |
Change From 2015-16 |
||
|
Amount |
Percent |
||||
|
UC |
|||||
|
General Fund |
$2,991 |
$3,257 |
$3,467 |
$209 |
6% |
|
Tuitionb |
2,932 |
3,028 |
3,186 |
158 |
5 |
|
Other |
20,868 |
21,508 |
22,044 |
536 |
2 |
|
Subtotals |
($26,791) |
($27,793) |
($28,696) |
($903) |
(3%) |
|
CSU |
|||||
|
General Fund |
$3,018 |
$3,297 |
$3,484 |
$187 |
6% |
|
Tuitionb |
2,259 |
2,273 |
2,288 |
16 |
1 |
|
Other |
3,383 |
3,178 |
3,213 |
35 |
1 |
|
Subtotals |
($8,659) |
($8,748) |
($8,985) |
($238) |
(3%) |
|
CCC |
|||||
|
General Fund |
$5,343 |
$5,813 |
$5,946 |
$133 |
2% |
|
Local property tax |
2,302 |
2,624 |
2,812 |
188 |
7 |
|
Enrollment fees |
410 |
420 |
426 |
6 |
1 |
|
Other |
275 |
298 |
297 |
—c |
—c |
|
Subtotals |
($8,330) |
($9,154) |
($9,481) |
($327) |
(4%) |
|
CSAC |
|||||
|
General Fund |
$1,539 |
$1,564 |
$1,428 |
-$136 |
-9% |
|
TANF funds |
377 |
521 |
826 |
305 |
58 |
|
Other |
35 |
17 |
17 |
— |
— |
|
Subtotals |
($1,952) |
($2,102) |
($2,271) |
($169) |
(8%) |
|
California Institute for Regenerative Medicine |
|||||
|
General Fund |
$275 |
$369 |
$274 |
-$95 |
-26% |
|
Hastings |
|||||
|
Tuitionb |
$32 |
$27 |
$22 |
-$5 |
-17% |
|
General Fund |
11 |
12 |
15 |
3 |
27 |
|
Other |
51 |
22 |
24 |
2 |
9 |
|
Subtotals |
($93) |
($61) |
($62) |
($1) |
(1%) |
|
Awards for Innovation in Higher Education |
|||||
|
General Fund |
$50 |
— |
$25 |
$25 |
N/A |
|
Totalsd |
$44,815 |
$46,751 |
$48,178 |
$1,427 |
3% |
|
General Fund |
$13,226 |
$14,312 |
$14,639 |
$327 |
2% |
|
Tuition and fees |
4,297 |
4,273 |
4,307 |
34 |
1 |
|
Local property tax |
2,302 |
2,624 |
2,812 |
188 |
7 |
|
Other |
24,989 |
25,543 |
26,420 |
878 |
3 |
|
aGeneral Fund amounts include support for retirement, debt service, and deferred maintenance paid from outside higher education agencies’ budgets. Excludes state cost changes in 2016-17 for agencies participating in the California Public Employees’ Retirement System, as these costs have not yet been distributed across agencies’ budgets. bReflects tuition after discounts and other tuition aid from all sources. In 2016-17, UC, CSU, and Hastings plan to provide $1.1 billion, $668 million, and $16 million, respectively, in such aid. cChange is less than $500,000 and 0.5 percent. dAgency totals do not add because Cal Grant and Middle Class Scholarship tuition payments appear in UC and CSU tuition as well as CSAC General Fund. These payments total $1.3 billion in 2014-15, $1.5 billion in 2015-16, and $1.6 billion in 2016-17. Fund source totals add because these payments are excluded from tuition and appear only in General Fund. Posted January 2016. |
|||||
Higher Education General Fund Supporta
(Dollars in Millions)
|
2014-15 Actual |
2015-16 Estimated |
2016-17 Proposed |
Change From 2015-16 |
||
|
Amount |
Percent |
||||
|
California Community Colleges |
$5,343 |
$5,813 |
$5,946 |
$133 |
2% |
|
California State University |
3,018 |
3,297 |
3,484 |
187 |
6 |
|
University of California |
2,991 |
3,257 |
3,467 |
209 |
6 |
|
California Student Aid Commissionb |
1,922 |
2,085 |
2,254 |
169 |
8 |
|
California Institute for Regenerative Medicine |
275 |
369 |
274 |
-95 |
-26 |
|
Awards for Innovation in Higher Education |
50 |
— |
25 |
25 |
N/A |
|
Hastings College of the Law |
11 |
12 |
15 |
3 |
27 |
|
Totals |
$13,609 |
$14,833 |
$15,463 |
$630 |
4% |
|
aIncludes General Fund support for retirement, debt service, and deferred maintenance paid from outside higher education agencies’ budgets. Excludes state cost changes in 2016-17 for agencies participating in the California Public Employees’ Retirement System, as these costs have not yet been distributed across agencies’ budgets. bIncludes Temporary Assistance for Needy Families and Student Loan Authority Fund support that directly offsets General Fund costs. Posted January 2016. |
|||||
University of California Budget
(In Millions)
|
Revenuea |
|
|
2015-16 Revised |
|
|
General Fund |
$3,257 |
|
Tuition and fees |
3,028 |
|
Total |
$6,285 |
|
2016-17 Changes |
|
|
General Fund |
$209 |
|
Tuition and feesb |
158 |
|
Subtotal |
($367) |
|
Otherc |
145 |
|
Total |
$512 |
|
2016-17 Proposed |
|
|
General Fund |
$3,467 |
|
Tuition and fees |
3,186 |
|
Total |
$6,652 |
|
Changes in Spending |
|
|
UC’s Plan for Unrestricted Funds |
|
|
General salary increases (3 percent) |
$152 |
|
Resident undergraduate enrollment growth (3.4 percent)d |
50 |
|
“Academic quality”e |
50 |
|
Faculty merit salary increases |
32 |
|
Operating expenses and equipment cost increases |
30 |
|
Health benefit cost increases (5 percent) |
27 |
|
Deferred maintenance |
25 |
|
Pension benefit cost increases |
24 |
|
Debt service for capital improvements |
15 |
|
Nonresident enrollment growth (3.2 percent)f |
14 |
|
Dream Loan Program |
5 |
|
Retiree health benefit cost increases |
4 |
|
Subtotal |
($428) |
|
Restricted General Fund |
|
|
Proposition 2 payments for UC Retirement Plan (one time) |
$171 |
|
Deferred maintenance (one time) |
35 |
|
Remove one-time funding provided in 2015-16 |
-122 |
|
Subtotal |
($84) |
|
Total |
$512 |
|
aIncludes all state General Fund. Reflects tuition after discounts. (In 2016-17, UC is projected to provide $1.1 billion in discounts.) bReflects increases in nonresident supplemental tuition (8 percent), the Student Services Fee (5 percent), and increased enrollment, offset by increases in discounts. cReflects: (1) General Fund for enrollment growth UC intends to carry over into 2016-17, (2) savings from administrative efficiencies, (3) increased revenue from investments, and (4) philanthropy. dUC has not yet indicated its final plan for resident graduate enrollment growth. eFor purposes such as increasing instructional support, reducing student-to-faculty ratios, recruiting faculty, increasing faculty salaries, and providing stipends to graduate students. UC indicates it will allow campuses to determine how to spend the funds. fFunded from nonresident tuition. Posted March 2016. |
|
California State University Budget
(In Millions)
|
Revenuesa |
Amount |
|
2015-16 Revised |
|
|
General Fund |
$3,297 |
|
Tuition |
2,273 |
|
Total |
$5,570 |
|
2016-17 Changes |
|
|
General Fund |
$187 |
|
Tuitionb |
16 |
|
Total |
$203 |
|
2016-17 Proposed |
|
|
General Fund |
$3,484 |
|
Tuition |
2,288 |
|
Total |
$5,772 |
|
Changes in Spending |
|
|
CSU’s Plan for Unrestricted Funds |
|
|
Employee compensation increase (2 percent) |
$70 |
|
Resident enrollment growth (1 percent) |
37 |
|
Employee health benefits |
35 |
|
Lease-revenue debt service |
8 |
|
Pension benefitsc |
7 |
|
Maintenance of newly constructed facilities |
1 |
|
Otherd |
7 |
|
Subtotal |
($164) |
|
Restricted General Fund |
|
|
Deferred maintenance (one time) |
$35 |
|
Retiree health benefits |
27 |
|
College Textbook Affordability Act (ongoing) |
2 |
|
Remove one-time funding in 2015-16 |
-25 |
|
Subtotal |
($39) |
|
Total |
$203 |
|
aReflects General Fund, including appropriations outside of CSU’s main appropriation. Reflects tuition after discounts. In 2016-17, CSU is projected to provide $668 million in discounts. bGenerated from 1 percent enrollment growth. cBeginning in 2014-15, the state provides pension benefit adjustments based on CSU’s 2013-14 payroll and requires CSU to fund the remaining adjustment from its unrestricted funds. dCSU has not yet specified how it would allocate this funding. It has identified capital improvements and student success initiatives as possible priorities. This amount slightly differs from CSU’s Academic Sustainability Plan due to different tuition revenue assumptions made by the Governor and CSU. Posted January 2016. |
|
Hastings College of the Law Budget
(In Millions)
|
Revenuea |
Amount |
|
2015-16 Revised |
|
|
Tuition and fees |
$27.0 |
|
General Fund |
12.1 |
|
Total |
$39.1 |
|
2016-17 Changes |
|
|
Tuition and fees |
-$4.6b |
|
General Fund |
3.3 |
|
Subtotal |
(-$1.3) |
|
Draw down reservesc |
$3.8 |
|
Total |
$2.5 |
|
2016-17 Proposed |
|
|
Tuition and fees |
$22.5 |
|
General Fund |
15.4 |
|
Total |
$37.8 |
|
Changes in Spending |
|
|
Restricted General Fund |
|
|
Deferred maintenance (one time) |
$2.0 |
|
General obligation bond debt service |
0.3 |
|
Subtotal |
($2.3) |
|
Hastings’ Plan for Unrestricted Funds |
|
|
Benefit cost increases |
$0.2 |
|
Salary increases (2.5 percent)d |
0.1 |
|
Subtotal |
($0.3) |
|
Total |
$2.5 |
|
aReflects tuition after discounts. (In 2016-17, Hastings is projecting to provide $16.3 million in discounts.) Includes all state General Fund. bReflects a 3.7 percent decrease in enrollment (-$1.3 million) and a 25 percent increase in tuition discounts (-$3.3 million). cReserves come from tuition, fees, and other fund sources but not General Fund. dIncreases only apply to certain employees comprising about one-quarter of the Hastings workforce. Posted March 2016. |
|
Community College Programs Funded by Proposition 98
(Dollars in Millions)
|
2014-15 Revised |
2015-16 Revised |
2016-17 Proposed |
Change From 2015-16 |
||
|
Amount |
Percent |
||||
|
Apportionments |
|||||
|
General Fund |
$3,114 |
$3,417 |
$3,209 |
-$208 |
-6% |
|
Local property tax |
2,302 |
2,624 |
2,812 |
188 |
7 |
|
Subtotals |
($5,416) |
($6,041) |
($6,020) |
(-$21a) |
(—b) |
|
Categorical Programs and Other Appropriations |
|||||
|
Adult Education Block Grant |
—c |
$500 |
$500 |
— |
— |
|
Student Success and Support Program |
$199 |
299 |
299 |
— |
— |
|
Physical plant and instructional support (one time) |
196 |
100 |
255d |
$155 |
155% |
|
Economic and Workforce Development |
73 |
23 |
223 |
200 |
872 |
|
Student equity plan implementation |
70 |
155 |
155 |
— |
— |
|
Extended Opportunity Programs and Services |
89 |
123 |
124 |
1 |
—b |
|
Disabled Students Program |
114 |
115 |
116 |
1 |
—b |
|
Financial aid administration |
69 |
74 |
68 |
-5 |
-7 |
|
Student Success for Basic Skills Students |
20 |
20 |
50 |
30 |
150 |
|
CTE Pathways Initiative |
48e |
— |
48 |
48 |
N/A |
|
Lease revenue bond payments |
65 |
56 |
47 |
-8 |
-15 |
|
Proposition 39 (grant and loan programs) |
38 |
39 |
45 |
6 |
17 |
|
Cal Grant B supplemental grants |
— |
39 |
39 |
— |
— |
|
CalWORKs student services |
35 |
35 |
35 |
—b |
—b |
|
Mandate block grantf |
32 |
32 |
33 |
1 |
2 |
|
Apprenticeship (community colleges) |
7 |
31 |
32 |
1 |
2 |
|
Institutional effectiveness initiative |
3 |
18 |
28 |
10 |
57 |
|
Innovation awards (one time) |
23 |
— |
25 |
25 |
N/A |
|
Part-time faculty compensation |
25 |
25 |
25 |
— |
— |
|
Telecommunications and technology services |
22 |
20 |
23 |
3 |
15 |
|
Apprenticeship (school districts) |
16 |
20 |
22 |
1 |
5 |
|
Online course initiative |
10 |
10 |
15 |
5 |
50 |
|
Nursing grants |
13 |
13 |
13 |
— |
— |
|
Foster Parent Education Program |
5 |
5 |
5 |
— |
— |
|
Fund for Student Success |
4 |
4 |
4 |
— |
— |
|
Part-time faculty office hours |
4 |
4 |
4 |
— |
— |
|
Campus child care support |
3 |
3 |
3 |
—b |
—b |
|
Otherg |
3 |
3 |
3 |
— |
— |
|
Mandate backlog payment (one time) |
446 |
190 |
— |
-190 |
-100 |
|
Deferral pay down |
158 |
— |
— |
— |
— |
|
Basic skills transformation grants (one time) |
60h |
— |
— |
— |
— |
|
Basic skills partnership pilot (one time) |
10h |
— |
— |
— |
— |
|
Baccalaureate degree pilot start-up |
6 |
— |
— |
— |
— |
|
Subtotals |
($1,865) |
($1,956) |
($2,238) |
($282) |
(14%) |
|
Totals |
$7,281 |
$7,997 |
$8,259 |
$262 |
3% |
|
aEnrollment growth and cost-of-living adjustments are offset by various technical adjustments. bLess than $500,000 or 0.5 percent. c$25 million provided in 2013-14 for planning grants was available for expenditure over 2013-14 and 2014-15 fiscal years. dBudget provides an additional $28 million in Proposition 98 settle-up and $6 million in unspent Proposition 98 prior-year funds for this purpose. e2014-15 amount is for 2015-16 program costs. State also provided $48 million non-Proposition 98 General Fund in 2014-15 for expenditure in 2014-15. fIncludes $17,000 in 2014-15 and 2015-16 and $13,000 in 2016-17 for mandate reimbursements. gIncludes Equal Employment Opportunity, transfer education and articulation, district financial crisis oversight, part-time faculty health insurance, and Academic Senate. hDistricts have through 2017-18 to spend funds. CTE = Career Technical Education. Posted January 2016. |
|||||
Proposed Funding for Major Workforce Education and Training Programs in California
2016-17 (In Millions)
|
Program |
Agency |
State General Fund |
Other Fund Sourcesa |
Total Funding |
|
Apportionments for workforce education and training |
CCC |
$2,149b |
— |
$2,149 |
|
Adult Education Block Grant |
CDE/CCC |
500 |
— |
500 |
|
Career Technical Education Incentive Grants |
CDE |
300 |
— |
300 |
|
CalWORKs employment and training services |
DSS |
234 |
$1,142 |
1,376 |
|
Strong Workforce Program |
CCC |
200 |
— |
200 |
|
Office of Correctional Education programs |
CDCR |
197 |
— |
197 |
|
Office of Offender Services workforce programs |
CDCR |
111c |
43 |
155 |
|
Vocational Rehabilitation |
CDR |
59 |
364 |
423 |
|
Apprenticeships |
CDE/CCC |
54 |
— |
54 |
|
Career Technical Education Pathways Program |
CDE/CCC |
48 |
— |
48 |
|
Project Workability for students in special education |
CDE |
40 |
— |
40 |
|
CCC student services for CalWORKs recipients |
CCC |
35 |
— |
35 |
|
Core Training Program |
Corps |
24 |
62 |
86 |
|
Economic and Workforce Development Program |
CCC |
23 |
— |
23 |
|
California Partnership Academies |
CDE |
21 |
— |
21 |
|
Adults in Correctional Facilities (Jail Ed) |
CDE |
15 |
— |
15 |
|
Nursing program support |
CCC |
13 |
— |
13 |
|
Specialized Secondary Programs |
CDE |
5 |
— |
5 |
|
Agriculture Incentive Grants |
CDE |
4 |
— |
4 |
|
Adult, Youth, and Dislocated Worker Services (WIOA Title I) |
EDD |
— |
398 |
398 |
|
Wagner-Peyser Employment Services (WIOA Title III) |
EDD |
— |
127 |
127 |
|
Carl D. Perkins Career and Technical Education Act Program |
CDE/CCC |
— |
112 |
112 |
|
Adult Education and Family Literacy Program (WIOA Title II) |
CDE/CCC |
— |
85 |
85 |
|
Employment Training Panel |
EDD |
— |
73 |
73 |
|
CalFresh Employment and Training Program |
DSS |
— |
63 |
63 |
|
Jobs for Veterans State Grant |
EDD |
— |
20 |
20 |
|
CDE student services for CalWORKs recipients |
CDE |
— |
13 |
13 |
|
Energy Corps |
Corps |
— |
5 |
5 |
|
Proposition 39 pre-apprenticeships |
EDD |
— |
3 |
3 |
|
Offender development programs |
CalPIA |
2d |
2e |
4 |
|
Totals |
$4,037 |
$2,511 |
$6,548 |
|
|
aLargely federal funds with some special funds. bExtrapolated from best available data. Assumes community colleges spend 30 percent of apportionment funding on core adult education areas. cReflects funding for wraparound services, which include workforce education and training. dCDCR reimbursement. eFunded through sale of CalPIA goods. Assumes program will sell the same value of goods as in 2015-16. CCC = California Community Colleges; CDE = California Department of Education; DSS = California Department of Social Services; CDCR = California Department of Corrections and Rehabilitation; CDR = California Department of Rehabilitation; Corps = California Conservation Corps; WIOA = Workforce Innovation and Opportunity Act; EDD = California Employment Development Department; and CalPIA = California Prison Industry Authority. Posted January 2016. |
||||
Higher Education Annual Tuition and Fees
Mandatory Charges for Full-Time Resident Students
|
2014-15 Actual |
2015-16 Actual |
2016-17 Adopteda |
Change From 2015-16 |
||
|
Amount |
Percent |
||||
|
Hastings College of the Lawb |
$44,186 |
$44,201 |
$44,201 |
— |
— |
|
University of California |
|||||
|
Systemwide Tuition and Feesc |
|||||
|
Graduate—Professionald |
$16,192 to $50,740 |
$16,440 to $52,716 |
$16,494 to $52,770 |
$54 |
—e |
|
Graduate—Academic |
12,192 |
12,240 |
12,294 |
54 |
—e |
|
Undergraduate |
12,192 |
12,240 |
12,294 |
54 |
—e |
|
Average Campus Feef |
1,125 |
1,211 |
1,272 |
61 |
5% |
|
California State University |
|||||
|
Systemwide Tuition and Fees |
|||||
|
Graduate—Doctoralg |
$11,118 to $16,148 |
$11,118 to $16,148 |
$11,118 to $16,148 |
— |
— |
|
Graduate—Mastersh |
6,738 |
6,738 |
6,738 |
— |
— |
|
Teacher credential |
6,348 |
6,348 |
6,348 |
— |
— |
|
Undergraduate |
5,472 |
5,472 |
5,472 |
— |
— |
|
Average Campus Feef |
1,287 |
1,343 |
1,343 |
— |
— |
|
California Community Colleges |
$1,380 |
$1,380 |
$1,380 |
— |
— |
|
aReflects rates adopted by the governing boards of Hastings, UC, and CSU. Reflects rate in state law for CCC. bReflects tuition for juris doctor (JD) program only. Non-JD programs do not use residency classifications. cReflects a 5 percent increase in UC’s Student Services Fee charged to all students from 2014-15 to 2015-16 and from 2015-16 to 2016-17. dReflects range for students in business, law, medicine, nursing and other professional programs. The UC President has not yet submitted a proposal for professional degree tuition to the UC Regents for 2016-17. eLess than 0.5 percent. fReflects average for UC undergraduates. Campus fees for UC graduate students are lower. At CSU, the average campus fee is the same for undergraduate and graduate students. Campuses in both systems have not yet reported final fees for 2016-17. For planning purposes, the UC system assumes a 5 percent average increase from 2015-16. gIncludes professional doctorates in education, nursing, and physical therapy. hIncludes postbaccalaureate programs other than teacher credential programs. Posted January 2016. |
|||||
Higher Education Enrollment
Resident Full-Time Equivalent (FTE) Studentsa
|
2014-15 Actual |
2015-16 Estimated |
2016-17 Projected |
Change From 2015-16 |
||
|
Amount |
Percent |
||||
|
California Community Collegesb |
1,136,227 |
1,162,742 |
1,179,389 |
16,647 |
1.4%c |
|
California State University |
|||||
|
Undergraduate |
324,019 |
334,271 |
337,614 |
3,343 |
1.0% |
|
Graduate/other postbaccalaureate |
29,817 |
30,885 |
31,194 |
309 |
1.0 |
|
Teacher credential |
5,843 |
6,061 |
6,122 |
61 |
1.0 |
|
Subtotals |
359,679 |
371,217 |
374,930 |
3,713 |
1.0% |
|
University of California |
|||||
|
Undergraduate |
175,024 |
173,406 |
179,234 |
5,828 |
3.4% |
|
Graduate |
36,978 |
37,263 |
37,686 |
423 |
1.1 |
|
Subtotals |
(212,002) |
(210,669) |
(216,920) |
(6,251) |
(3.0%) |
|
Hastings College of the Lawd |
841 |
778 |
749 |
-29 |
-3.7% |
|
Totals |
1,708,749 |
1,745,406 |
1,771,988 |
26,582 |
1.5% |
|
aAt UC and CSU, 1 FTE student represents 30 credit units for an undergraduate and 24 credit units for a graduate student. At CCC, 1 FTE student represents 525 contact hours per year, which on average generates about 24 credits. bReflects funded enrollment levels. cReflects 2 percent systemwide growth plus 0.7 percent enrollment restoration (certain districts earning back slots they had lost within the last three years), offset by a projected 1.3 percent reduction in districts with declining enrollment. dIncludes juris doctor (JD) program only. Non-JD programs do not use residency classifications. Posted January 2016. |
|||||
California Student Aid Commission Budget
(Dollars in Millions)
|
2014-15 Actual |
2015-16 Estimated |
2016-17 Proposed |
Change From 2015-16 |
||
|
Amount |
Percent |
||||
|
Expenditures |
|||||
|
Local Assistance |
|||||
|
Cal Grants |
$1,835 |
$1,966 |
$2,103 |
$137 |
7% |
|
Middle Class Scholarships |
62 |
82 |
116 |
34 |
41 |
|
Assumption Program of Loans for Education |
19 |
17 |
14 |
-3 |
-15 |
|
Chafee Foster Youth Program |
12 |
12 |
12 |
— |
— |
|
Student Opportunity and Access Program |
7 |
8 |
8 |
— |
— |
|
National Guard Education Assistance Awards |
2 |
2 |
2 |
— |
— |
|
Other programsa |
1 |
1 |
1 |
—b |
21 |
|
Subtotals |
($1,939) |
($2,088) |
($2,256) |
($169) |
(8%) |
|
State Operations |
$13 |
$14 |
$14 |
—b |
—b |
|
Totals |
$1,952 |
$2,102 |
$2,271 |
$169 |
8% |
|
Funding |
|||||
|
General Fund |
$1,539 |
$1,564 |
$1,428 |
-$136 |
-9% |
|
Federal Temporary Assistance for Needy Families |
377 |
521 |
826 |
305 |
58 |
|
Otherc |
35 |
17 |
17 |
— |
— |
|
aIncludes Cash for College, Child Development Teacher/Supervisor Grants, Graduate Assumption Program of Loans for Education, John R. Justice Program, Law Enforcement Personnel Dependents Scholarships, and State Nursing Assumption Program of Loans for Education for Nursing Faculty. bLess than $500,000 or 0.5 percent. cIncludes College Access Tax Credit Fund, Student Loan Authority Fund, and other federal funds. Posted January 2016. |
|||||
Cal Grant Spending
(Dollars in Millions)
|
2014-15 Actual |
2015-16 Estimated |
2016-17 Projected |
Change From 2015-16 |
||
|
Amount |
Percent |
||||
|
Total Spending |
$1,809 |
$1,966 |
$2,103 |
$137 |
7% |
|
By Segment: |
|||||
|
University of California |
$824 |
$887 |
$943 |
$56 |
6% |
|
California State University |
594 |
669 |
734 |
65 |
10 |
|
Private nonprofit institutions |
241 |
253 |
261 |
9 |
3 |
|
California Community Colleges |
122 |
137 |
146 |
9 |
7 |
|
Private for-profit institutions |
27 |
21 |
19 |
-2 |
-11 |
|
By Program: |
|||||
|
High School Entitlement |
$1,457 |
$1,595 |
$1,711 |
$116 |
7% |
|
CCC Transfer Entitlement |
221 |
209 |
204 |
-5 |
-2 |
|
Competitive |
123 |
157 |
184 |
27 |
17 |
|
Cal Grant C |
8 |
5 |
4 |
-1 |
-18 |
|
By Award Type: |
|||||
|
Cal Grant A |
$1,037 |
$1,115 |
$1,178 |
$63 |
6% |
|
Cal Grant B |
764 |
846 |
921 |
75 |
9 |
|
Cal Grant C |
8 |
5 |
4 |
-1 |
-18 |
|
By Renewal or New: |
|||||
|
Renewal |
$1,247 |
$1,365 |
$1,480 |
$115 |
8% |
|
New |
562 |
601 |
624 |
22 |
4 |
|
By Funding Source: |
|||||
|
General Fund |
$1,425 |
$1,443 |
$1,276 |
-$167 |
-12% |
|
Federal TANF |
377 |
521 |
826 |
305 |
58 |
|
Student Loan Authority Fund |
6 |
— |
— |
— |
— |
|
College Access Tax Credit Fund |
— |
2 |
2 |
— |
— |
|
TANF = Temporary Assistance for Needy Families. Posted January 2016. |
|||||
Cal Grant Recipients
|
2014-15 Actual |
2015-16 Estimated |
2016-17 Projected |
Change From 2015-16 |
||
|
Amount |
Percent |
||||
|
Total Recipients |
318,834 |
340,539 |
361,608 |
21,069 |
6% |
|
By Segment: |
|||||
|
California State University |
115,066 |
125,595 |
136,110 |
10,515 |
8% |
|
California Community Colleges |
100,285 |
108,074 |
114,011 |
5,937 |
5 |
|
University of California |
69,258 |
73,398 |
77,639 |
4,241 |
6 |
|
Private nonprofit institutions |
27,973 |
29,057 |
30,093 |
1,036 |
4 |
|
Private for-profit institutions |
6,252 |
4,415 |
3,755 |
-660 |
-15 |
|
By Program: |
|||||
|
High School Entitlement |
237,526 |
255,904 |
273,062 |
17,158 |
7% |
|
Competitive |
42,991 |
50,627 |
56,170 |
5,543 |
11 |
|
CCC Transfer Entitlement |
28,910 |
26,562 |
25,712 |
-850 |
-3 |
|
Cal Grant C |
9,407 |
7,446 |
6,664 |
-782 |
-11 |
|
By Award Type: |
|||||
|
Cal Grant B |
199,537 |
216,439 |
232,184 |
15,745 |
7% |
|
Cal Grant A |
109,890 |
116,654 |
122,760 |
6,106 |
5 |
|
Cal Grant C |
9,407 |
7,446 |
6,664 |
-782 |
-11 |
|
By Renewal or New: |
|||||
|
Renewal |
191,861 |
205,959 |
222,500 |
16,541 |
8% |
|
New |
126,978 |
134,583 |
139,109 |
4,526 |
3 |
|
Totals do not match across all categories due to modeling issues. Posted January 2016. |
|||||
Middle Class Scholarship Programa
(Dollars in Millions)
|
2014-15 Actual |
2015-16 Estimated |
2016-17 Proposed |
Change From 2015-16 |
||
|
Amount |
Percent |
||||
|
Recipients |
83,250 |
59,900 |
63,886 |
3,986 |
7% |
|
Spending |
$62 |
$82 |
$116 |
$34 |
41% |
|
aTo date, the administration has been unable to provide a breakdown of recipients and spending for the University of California and California State University. Posted January 2016. |
|||||