
In this post and the video linked above, we describe trends in industry wages in California between 1990 and 2016.
Industry Wages. Industry sectors consist of groups of businesses that are largely producing the same products or services. For example, the construction sector includes businesses that are engaged in constructing buildings and other projects, such as highways. As such, average wages within an industry sector combine many different job types. For example, the construction sector employs carpenters and electricians, but also office clerks, engineers, and managers. Average wages within the construction sector would therefore reflect the salaries of all of employees in these job types and many others.
About the Data. In this post, we describe changes in average weekly wages by industry using data from the Bureau of Labor Statistics’ Quarterly Census of Employment and Wages (QCEW). QCEW wage data include most forms of employment compensation, including bonuses, stock options, and tips. However, the data exclude individuals and pay that are not covered by unemployment insurance. For example, income from self-employment is excluded.
Private and Public-Sector Employment. In the series we have separated public sector employees into three industries: “federal government,” “state government,” and “local government.” This means all other industries display only private sector employees. For example, “educational services” includes only private sector teachers and administrators, such as those teaching at private institutions of higher education. Teachers at the state’s K-12 public institutions are included in the local government category.
Higher-Wage Industries Employ Fewer Californians
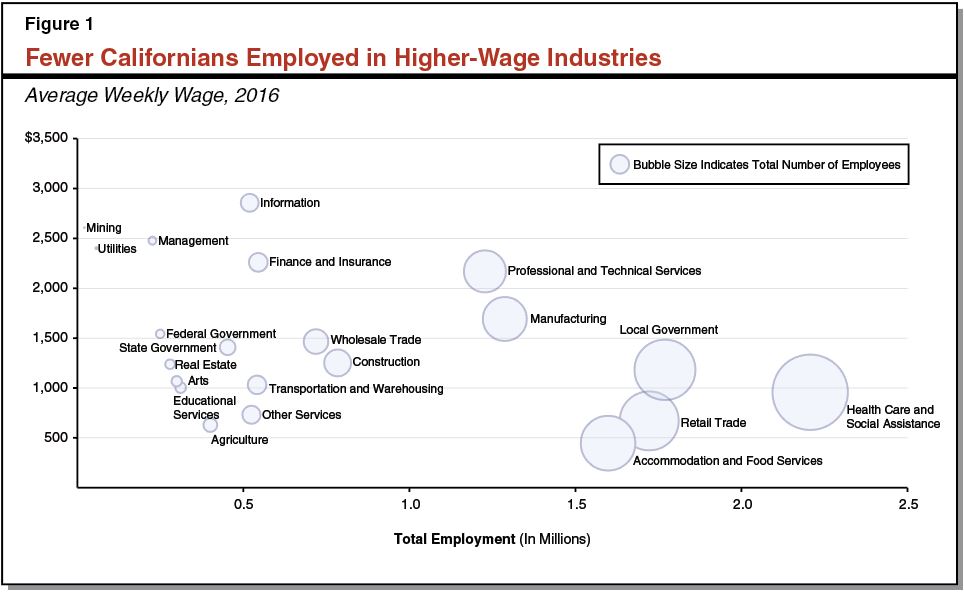
Figure 1 compares the average weekly wage of various industries to the total number of employees in California. As shown in the graphic, industries that employ more Californians tend to have lower wages. For example, the accommodation and food services sector—which includes hotels and restaurants—employed about 1.6 million Californians in 2016 and had average weekly wages of $446. By comparison, the finance and insurance sector —which includes banks, credit unions, and insurance companies—has much higher average wages but has many fewer employees. Elsewhere in this blog post, we refer to the group of six industries with average weekly wages above $2,000 per week as “higher-wage industries.” This group includes: information, management, finance and insurance, mining, professional and technical services, and utilities.
Wage Growth in California Has Been Concentrated in Higher-Wage Industries
Average Wages Vary by Industry. Figure 2 displays inflation-adjusted weekly wages, by industry, between 1990 and 2016. In the graphic, each industry is a single line. The group of six higher-wage industries shown in blue, which had the highest weekly wages in 2016, also had the highest wages in 1990. In 1990, average weekly wages in this group ranged from $1,190 in the finance and insurance industry to $1,602 in the utilities sector (in 2016 dollars). By 2016, this group of industries all had wages over $2,000 per week. Meanwhile, the group of 11 industries shown in red had lower average wages in 1990 — ranging from $368 in accommodations and food services to $1,054 in construction.
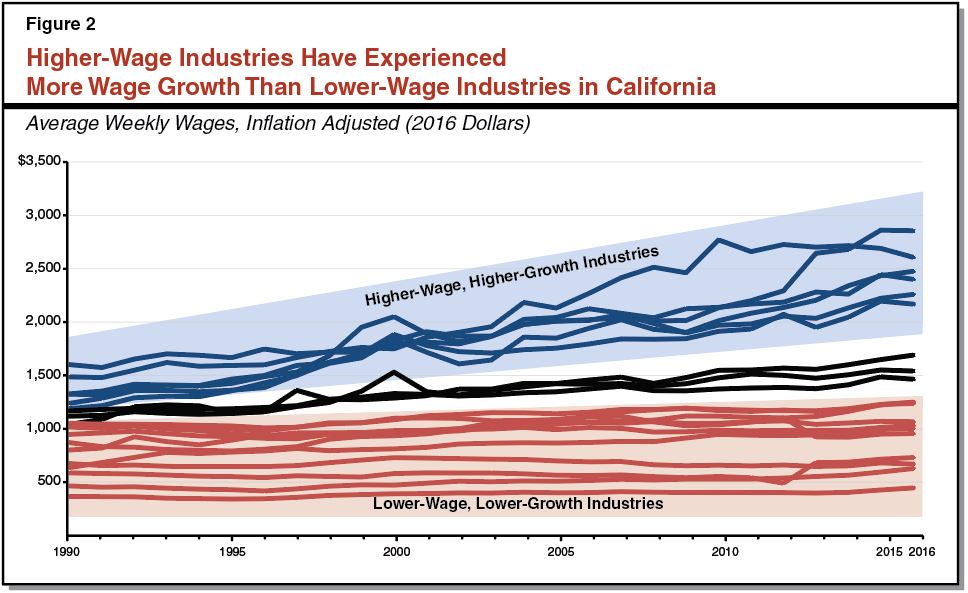
Higher-Wage Industries Have Generally Experienced More Wage Growth. The six higher-wage industries have also experienced the most inflation-adjusted growth in wages. Over the period, the information sector—which includes, for example, the production and distribution of software and motion pictures—has seen the most average annual wage growth at 3%. Five of the six industries shown in blue had average annual growth above 2%. Meanwhile, the lower-wage industries shown in red in Figure 2 have experienced less wage growth. All 11 of these industries had wage growth of less than 2%. Six of the 11 industries have had wage growth below 1%. The retail trade sector—which includes establishments like grocery and department stores, gasoline stations, and car dealerships—had virtually no growth in real wages over the period.
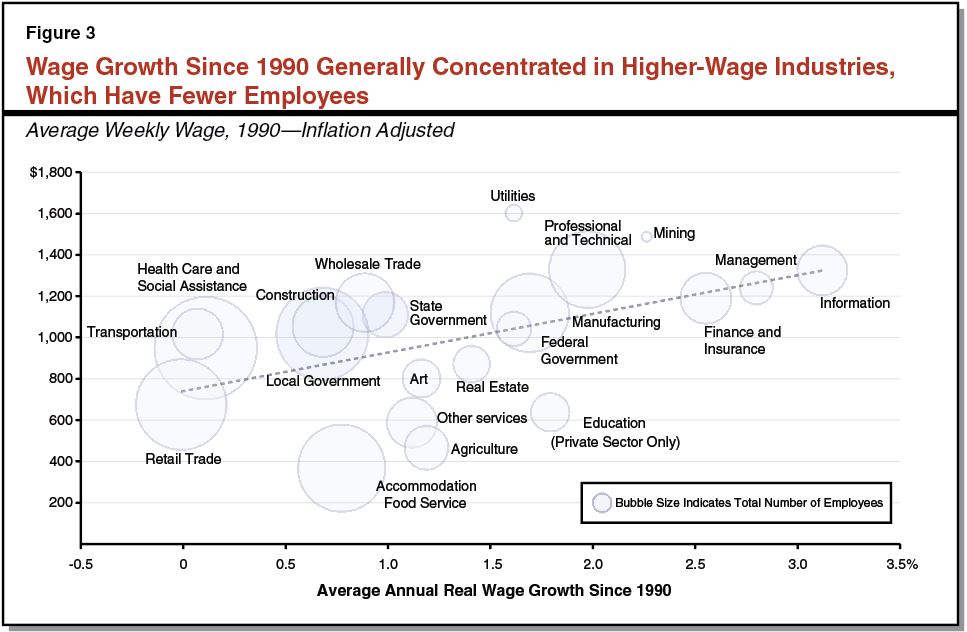
Industries With Higher Wages and More Growth Employ Fewer Californians. Figure 3 compares average weekly wages in 1990 to average annual growth in wages, by industry. The size of the bubble represents the total employment in the industry: larger bubbles have more employees. Generally, Figure 3 shows that industries with higher wages and more wage growth have fewer employees. In particular, the six higher-wage industries each have an average of about 433,000 employees, while the remaining industries have an average of 876,000 employees. For example, the accommodation and food service, health care and social assistance, and the retail trade sectors each employ over 1.5 million Californians. But these industries also have lower wages and have seen less wage growth since 1990. Meanwhile, the information, management, and finance and insurance sectors have seen the most wage growth, have some of the highest average weekly wages, but employ far fewer Californians.
Higher-Wage Industries Have Seen Faster Wage Growth in California Compared to Rest of the Nation
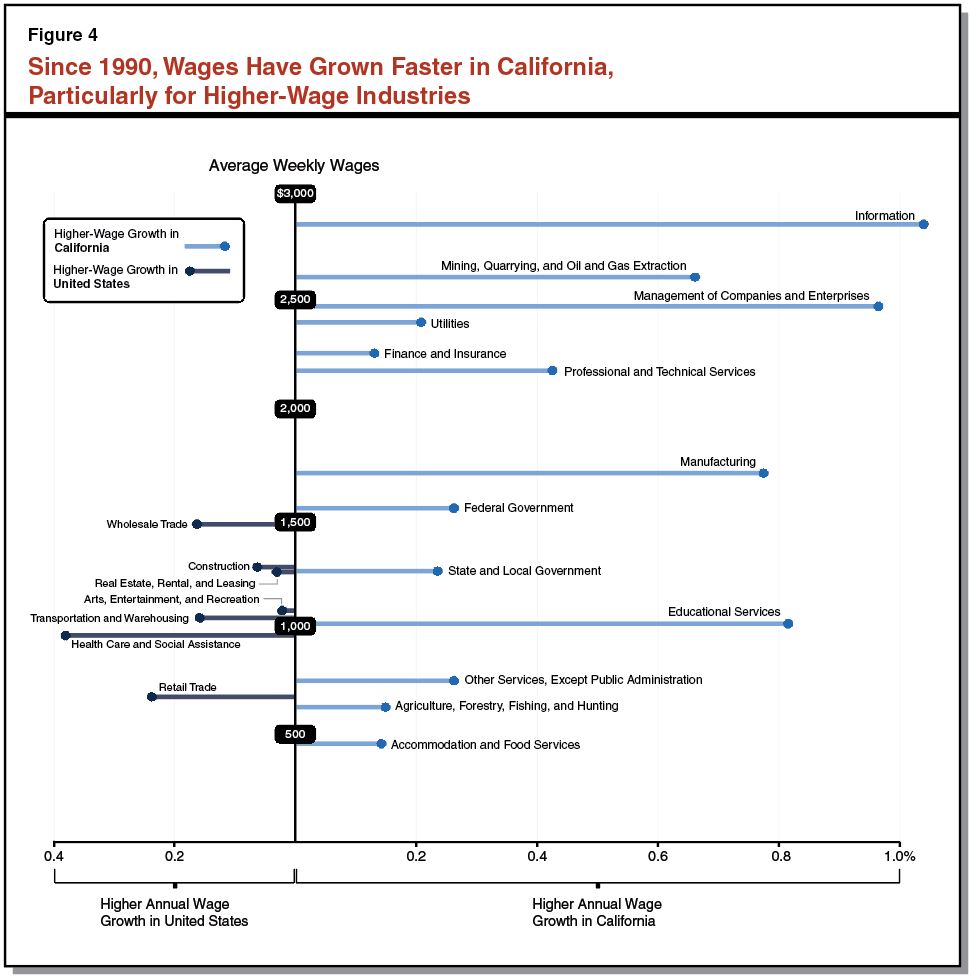
Higher-wage industries have experienced more wage growth both in California and in the United States overall. However, this pattern is more pronounced in California. Figure 4 shows which industries have experienced more average annual wage growth in California (shown on the right in light blue) versus the United States (shown on the left in dark blue). Higher-wage industries, those at the top of the graphic, have all experienced more wage growth in California. For example, the highest paid industry in California, the information sector, has had about 1% more growth every year since 1990 in the state compared to the nation. Many, but not all, lower-wage industries, shown at the bottom of the graphic, have experienced more wage growth nationally than in California. For instance, retail trade, wholesale trade, and health care and social assistance, have had more annual growth in wages in the United States as a whole.
Employment in Higher-Wage Industries Is Greater in the Bay Area and Orange County
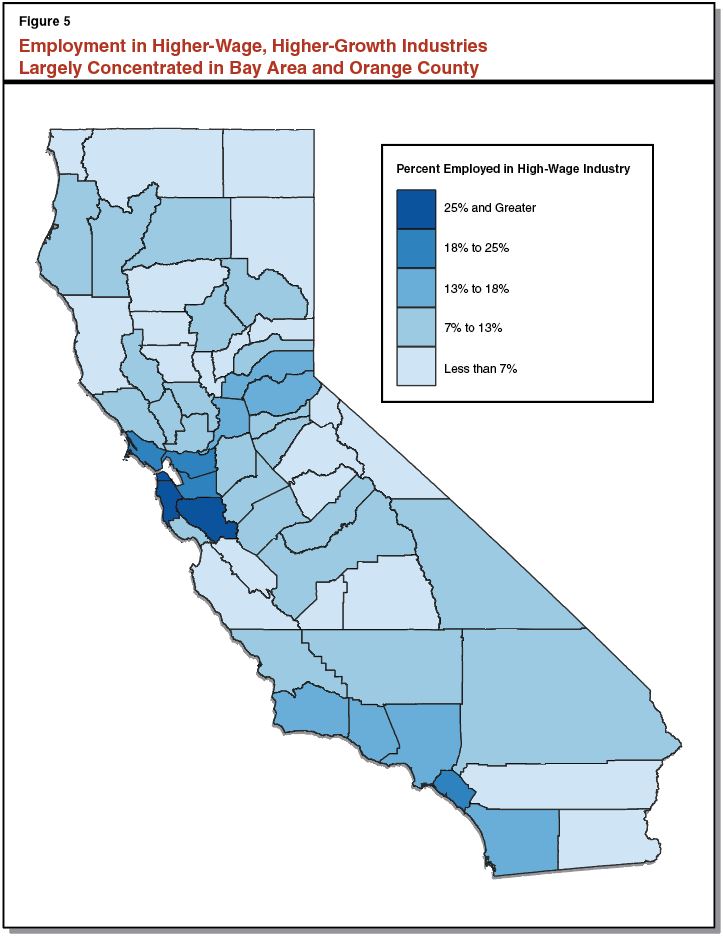
Figure 5 shows the percent of employees who have jobs in one of the six higher-wage industries. In general, employment in these higher-wage industries is more concentrated in the Bay Area and in Orange County, as well as some other parts of Southern California. In San Francisco, 39 percent of workers are employed in one of these higher-wage industries. For many counties, the largest higher-wage industry is professional and technical services—which includes, for example, engineering, computer programming, computer systems design services, and consulting. Los Angeles County and many Bay Area counties also have larger shares of employees in the information sector, which includes the motion picture industry, and technology firms that provide services like software publishing and data processing.
Follow @LAOEconTax on Twitter for regular California economy and tax updates.