
|
California's Fiscal Outlook
|
Our revenue forecast assumes slower growth in General Fund receipts in 1998-99 and 1999-00 than has been experienced in the past several years, when strong economic growth resulted in well-above-average revenue performance.
Our General Fund revenue outlook reflects three key factors: (1) the impact of recently enacted state tax reductions; (2) our projected slowing in California's economic growth; and (3) the recent turbulence in the stock market. Although the latter will have certain positive effects on revenues, it also is likely to have significant negative impacts on income tax receipts related to stock options, bonuses, and investment earnings over the next 12 to 18 months.
During the current and budget years, we expect General Fund revenue growth to be slightly slower than statewide personal income growth. Thereafter, however, we expect General Fund revenues to increase at about the same pace as personal income.
Our revenue projections are summarized in Figure 1. It indicates the following:
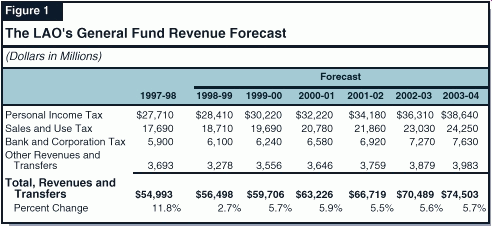
Over the period 1998-99 through 2003-04, we are projecting that revenues will increase at an average annual rate of 5.2 percent. Excluding the effects of the recently enacted tax reductions, the gain would be a slightly higher 5.5 percent. Our projected revenue growth over the entire period is similar to that for statewide personal income. What this means is that revenues are essentially growing "in sync" with economic growth generally.
General Fund revenue growth in both the current and budget years, as well as beyond, will be significantly affected by tax reductions passed in 1997 and 1998. Figure 2 shows the fiscal effects of the 1997 tax relief package and the non-VLF tax provisions of the 1998 tax relief package. (The VLF provisions are discussed in Chapters 1 and 4). The figure indicates that the combined revenue reductions from these two packages amounts to $1.4 billion in 1998-99, rising to $1.7 billion by 2003-04. It also shows that the largest effect in the packages involves increases in the PIT dependent credit.
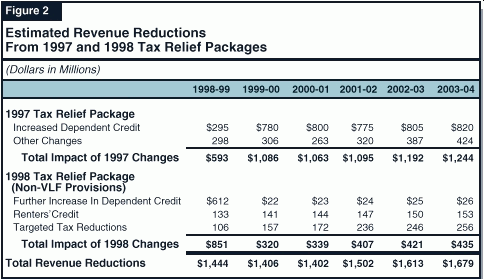
Dependent Credit Increases. The 1997 law change raised the dependent credit from $68 in 1997 to $120 in 1998, and further to $222 in 1999. As shown in Figure 2, the fiscal effect of these 1997 changes in the dependent credit was a $295 million revenue reduction in 1998-99, increasing to $780 million in 1999-00, with the revenue losses slowly expanding in subsequent years.
The 1998 tax relief package included a further increase in the dependent creditfrom $120 to $253 in 1998 and from $222 to $227 in 1999. As seen in Figure 2, the substantial credit increase adopted in 1998 will reduce 1998-99 revenues by $612 million compared to what revenues would have been had the 1998 change not occurred. Thereafter, the 1998 law change will reduce revenues by somewhat over $20 million annually compared to the 1997 law base.
Other Provisions. The 1997 and 1998 tax packages also included a variety of other tax reductions. These included the restoration of an income-limited renters' tax credit, various federal income tax conformity provisions, reduced horse racing fees, and targeted tax relief for businesses. More complete discussions regarding the details of these tax packages are included in our post-budget State Spending Plan reports for the last two years.
As shown in Figure 1, the majority of General Fund revenues are from the PIT, sales and use tax, and BCT. Together, these three sources will account for about 94 percent of total revenues in 1998-99. In this section, we discuss the key factors affecting the revenue outlook for these taxes.
The PIT is the state's single largest revenue source, accounting for slightly over one-half of total General Fund receipts in 1998-99. Taxpayers are subject to marginal tax rates ranging from 1 percent to 9.3 percent, depending on their levels of taxable income.
Liabilities Surged in 1996 and 1997. The PIT liabilities increased by around 15 percent in both the 1996 and 1997 income yearsmore than double the rate of statewide personal income growth for that period. A significant portion of these above-average increases can be directly or indirectly attributed to the dramatic gains in the stock market during those two years. These stock market gains boosted capital gains on investments, as well as earnings from stock options, bonuses, and initial public offerings. Federal tax law changes passed last year, which lowered the maximum federal income tax rate on capital gains realizations, also are likely to have boosted capital gains realizations in 1997. As indicated in Figure 3 (see page 16), net capital gains realizations reported on state income tax returns rose by over 55 percent in 1996, and we estimate they increased by an additional 50 percent last year.
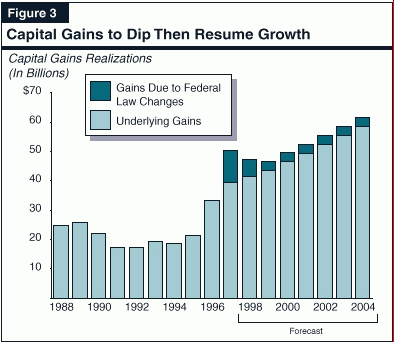
Capital Gains to Taper Somewhat. We believe that capital gains will fall modestly in 1998 and 1999 from their 1997 peak, reflecting both a more mixed performance in the stock market and a diminished amount of gains related to realizations prompted by the recent federal tax-rate reductions (see Figure 3). The weaker stock market performance will also likely affect income from bonuses and stock options during 1998 and 1999.
Near-Term Revenue Forecast. The above factors will result in more moderate growth in PIT liabilities in the near term as compared to the past two years. After adjusting for the effects of tax law changes, we project that underlying PIT liabilities will increase by about 8 percent in 1998 and 6 percent in 1999, compared to over 15 percent in 1997.
As a consequence of both slowing underlying liability growth and the tax law changes, we forecast that PIT collections will total $28.4 billion in 1998-99 (a 2.5 percent increase from 1997-98), and $30.2 billion in 1999-00 (a 6.4 percent gain).
Longer-Term Revenue Forecast. Over the longer term, we forecast that PIT liabilities will rebound in 2000, and grow somewhat faster than statewide personal income during the remainder of the forecast period. This will occur due to modest growth in average real income levels.
Thus, we project that PIT collections will increase to $32.2 billion in 2000-01, and rise further to $38.6 billion by the end of the forecast period (2003-04). Over the entire forecast period, we project that PIT receipts will increase at an average annual rate of 5.7 percent. Excluding the impact of recent tax-reduction legislation, the average annual increase is slightly over 6 percent.
The sales and use tax is the second largest General Fund revenue source behind PIT, accounting for about one-third of total estimated revenues in 1998-99. The state sales and use tax rate is a combined 6 percent, which includes a 5 percent General Fund rate and a 1 percent rate allocated to special funds. Additional local rates ranging from 1.25 percent to 2.5 percent are imposed by cities, counties, and transportation districts, bringing the current combined state-local tax rate to between 7.25 percent and 8.5 percent.
Moderate Growth in Taxable Sales. The main factor determining the level of sales and use tax receipts is the strength in taxable salesthat is, sales of tangible goods such as clothing, furniture, automobiles, computers, and building materials. We project that taxable sales will increase slightly less than personal income over the next several years, expanding at an average annual rate of 5.4 percent from 1998 through 2004, compared to average annual personal income growth of 5.6 percent for the same period. The outlook reflects a continuation of a long-term trend in which consumption has shifted away from commodities (which are taxable) and toward services (which generally are not). Partly offsetting this trend are the effects of our forecast for continued growth in home construction, which will boost sales of building materials, home furnishings, and related items.
Near-Term Revenue Forecast. Based on our projections for taxable sales, Figure 1 shows that we estimate that General Fund sales tax receipts will rise to $18.7 billion in 1998-99 (a 5.8 percent increase from the prior year), and to $19.7 billion in 1999-00 (a 5.2 percent increase from the current year).
Longer-Term Revenue Forecast. We project that sales tax receipts will continue to expand, to $20.8 billion in 2000-01, and further to $24.3 billion by 2003-04. Over the entire forecast period, sales tax receipts are projected to increase at an average annual rate of 5.4 percent.
The BCT receipts are the General Fund's third largest revenue source, accounting for about 11 percent of total receipts in the current year. The general BCT tax rate is 8.84 percent, which is applied to corporate earnings. Banks and other financial institutions are subject to an add-on tax rate of 2 percent, which is in lieu of certain local taxes.
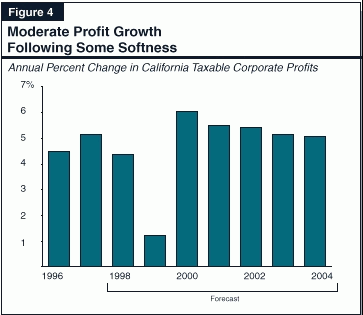
The key determinant of BCT receipts is California taxable profits. These profits grew strongly during the early stages of the current economic expansion in 1994 and 1995. However, profit growth expanded at a more modest pace, partly due to the effects of corporate restructurings in the state's banking and telecommunications industries. As indicated in Figure 4, we expect that California taxable profits will slow further in 1998, and particularly in 1999, as softening activity in the state's high-tech sectors takes its toll on the earnings of businesses in these industries. We project that profits will rebound in 2000, growing at a moderate pace thereafter.
Near-Term Revenue Forecast. We forecast that BCT receipts will increase from $5.9 billion in 1997-98, to $6.1 billion in 1998-99 and $6.2 billion in 1999-00 (increases of 3.4 percent and 2.3 percent, respectively). The fact that these gains are only modest is largely due to the subdued growth in projected earnings during this period.
Longer-Term Revenue Forecast. We project that BCT receipts will increase to $6.6 billion in 2000-01 and continue to grow thereafter, reaching $7.6 billion by 2003-04. Revenue growth over this longer-term horizon is affected by the targeted business-related tax reductions enacted in 1997 and 1998. These BCT reductions total $227 million in 2003-04.
We estimate that revenues and transfers from all other General Fund sources (including insurance premium taxes, estate taxes, tobacco and alcohol-related taxes, interest earnings, and a variety of fees) will decline from $3.7 billion in 1997-98 to $3.3 billion in the current year, before climbing to $3.6 billion in 1999-00. The drop in these revenues between the prior and current years reflects a reallocation of trial court revenues from the General Fund to a special trust fund, and a transfer of $120 million from the General Fund to various special funds in response to a recent court decision.
Over the longer term, we project that this "other revenue" category will grow from $3.6 billion in 2000-01 to $4 billion by 2003-04. Of the nonmajor taxes that are included in this revenue category, the fastest growing sources will be insurance and estate taxes.
Continue to Chapter 4: Expenditure Projections