
|
California's Fiscal Outlook
|
In this chapter, we discuss our General Fund expenditure projections for 1998-99 through 2003-04, both in the aggregate and by individual program areas.
Our projections are based on the following methodology and underlying assumptions:
Figure 1 presents our General Fund spending projections by major program area. Total General Fund spending grows from $53.4 billion in 1997-98 to $58.3 billion in 1998-99 and $61.1 billion in 1999-00. Between 1997-98 and 2003-04, state expenditures under current law would increase by an average of about 5.5 percent per year. Our estimates do not include any offsets which may occur during the forecast period as a result of pending litigation brought by the Attorney General related to tobacco. The timing and amount of any payments are not known at this time.
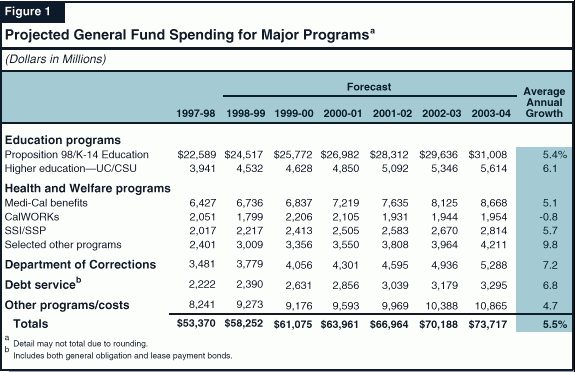
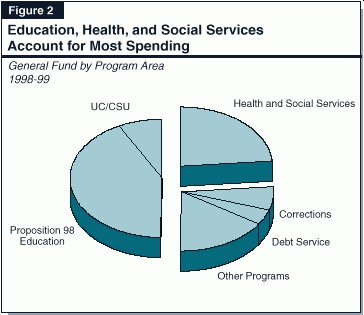
Figure 2 shows the current distribution of General Fund spending by major program area. It indicates that nearly 85 percent of total 1998-99 General Fund spending is devoted to education, health, social services, corrections, and debt servicewith the education, health, and social services categories alone accounting for nearly three-fourths of the total. Given this, spending trends in these major program areas have significant implications for overall General Fund spending levels.
The overall 5.5 percent average annual expenditure growth reflects divergent spending trends in the state's major programs. As indicated in Figure 1:
In response to federal welfare reform legislation, the Legislature created the California Work Opportunity and Responsibility to Kids (CalWORKs) program in 1997. This program, which replaced the Aid to Families with Dependent Children (AFDC) program, provides cash grants and welfare-to-work services to families with children whose incomes are not adequate to meet their basic needs.
The Spending Forecast. General Fund spending in 1998-99 for the CalWORKs program is estimated to be $1.8 billion, a reduction of 12 percent from the prior year. We project that General Fund spending will increase by 23 percent in 1999-00 to a total of $2.2 billion. In comparison, General Fund expenditures for CalWORKs (AFDC) declined by 28 percent in 1997-98 and decreased by 12 percent in 1996-97.
Looking at the five-year horizon, we project that General Fund spending will decrease to $2.1 billion in 2000-01 and will then decrease to $1.9 billion in 2001-02 and remain at about that level in the following two years.
Key Forecast Factors. In recent years, a combination of caseload reductions, grant reductions, and the shift from a matching requirement to a block grant in federal Temporary Assistance for Needy Families (TANF) funds has led to substantially reduced General Fund spending for CalWORKs, despite increasing costs for welfare-to-work services and support services such as child care.
The primary reason that state spending is projected to increase in 1999-00 (despite a projected caseload decline of 8 percent) is a substantial reduction in available federal TANF funds, due to the effect of carry-over balances. During 1998-99, California is funding the CalWORKs program with $617 million in unexpended TANF funds carried over from the prior year, in addition to the annual $3.7 billion TANF block grant. For 1999-00, the balance of unexpended TANF funds is projected to be only $160 million, a reduction of $457 million, which must be backfilled from the General Fund. In addition to making up for the reduction in available federal funds, we project increased costs for: (1) welfare-to-work and support services ($281 million) due primarily to the full-year implementation of CalWORKs, (2) the full-year impact of grant increases that became effective in November 1998 ($106 million), and (3) a 2.2 percent statutory cost-of-living adjustment (COLA) in 1999-00 ($80 million). These costs will be partially offset by savings from: (1) caseload reductions (-$448 million), (2) the termination in the budget year of one-time costs in 1998-99 for a court case settlement (-$42 million), and (3) other policy changes (-$89 million).
After 1999-00, we project that continued
caseload reductions and the suspension of COLAs will result in
lower General Fund spending. Budget trailer bill legislation for
1998-99 provides that CalWORKs COLAs will be suspended if
revenues are insufficient to "trigger" an additional
vehicle license fee (VLF) reduction, beginning in
2000-01. As discussed previously in this report, we believe that
revenues will be insufficient to trigger such VLF reductions;
thus, we project that COLAs for the CalWORKs program will be
suspended each year after 1999-00. By 2001-02, we project that
General Fund spending will be at the federal
maintenance-of-effort (MOE) floor of approximately
$1.9 billion and will remain at about that level through
2003-04.
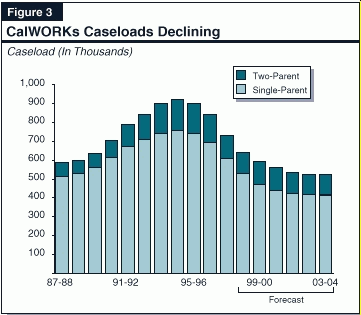
Caseload Trends and Projections. Following a period of rapid increase in the early 1990s, the caseload peaked at 921,000 in 1994-95 and has since declined by 2 percent in 1995-96, 6.7 percent in 1996-97, and 12 percent in 1998-99. Our analysis indicates that about two-thirds of the recent decline in welfare caseloads can be explained by demographic trends, reductions in grant levels, and the current economic expansion. Other factors that may explain the balance of the caseload decline include (1) an "announcement effect" of federal and state welfare reform that affects behavior prior to policy implementation, and (2) a labor market effect whereby welfare recipients benefit more as the economy approaches full employment (where the supply of labor is more scarce) compared to the early stages of economic recovery.
Figure 3 shows our caseload projections for 1998-99 through 2003-04. The figure shows that the caseload will decline by 12 percent in 1998-99, 8 percent in 1999-00, about 5 percent in both 2000-01 and 2001-02, and about 1 percent in 2002-03 and 2003-04. The projections are based on (1) a trend analysis of caseloads, birth rates, grant levels, and unemployment rates; (2) an assumption that other factors contributing to the recent caseload decline (as described above) will continue; and (3) an estimate of the caseload impact of state welfare reform interventionsprimarily additional welfare-to-work services and the implementation of a community service work requirement after two years on aid.
The AFDC-Foster Care program provides cash grants for children living with a foster care provider under a court order or a voluntary agreement between the child's parent and a county welfare or probation department.
The Spending Forecast. We estimate that General Fund expenditures in the Foster Care program will increase from $433 million in 1998-99 to $464 million in 1999-00, an increase of 7 percent.
We estimate that General Fund
expenditures will continue to grow at an annual rate of about
7 percent through 2003-04, with the level of expenditures
increasing from $498 million in
2000-01 to $535 million in 2001-02, $572 million in
2002-03, and $619 million in 2003-04.
Key Forecast Factors. The projected increases are due to caseload growth (about 5 percent annually) and statutory COLAs for group homes and foster family homes (about 2 percent annually). The caseload growth projection is based on the recent historical trend.
Federal law requires states to provide child support enforcement services to families receiving TANF (CalWORKs in California), and other families who request these services. Child support payments that are collected on behalf of CalWORKs families are used to offset the public costs of CalWORKs grants, except the first $50 of monthly payments which are distributed directly to the family.
Federal Automation Penalties. Federal law requires that states operate statewide automated child support data processing and information retrieval systems by October 1, 1997. Because California failed to implement a statewide computer system for child support by the federal deadline, it is subject to federal penalties in the form of reduced federal reimbursements for program administrative expenditures.
We estimate that California will be subject to federal automation penalties of $9 million in 1998-99, $22 million in 1999-00, $55 million in 2000-01, $85 million in 2001-02, and $11 million in 2002-03. This estimate assumes that (1) the new California Child Support Automation project will be completed according to the schedule of the Health and Welfare Agency Data Center and will meet federal automation requirements, and (2) the state will provide funding to compensate for federal automation penalties, with the exception that the counties will be responsible for 10 percent of penalties incurred after September 30, 2001. The latter assumption is consistent with the provisions of the budget trailer bill for social services, Chapter 329, Statutes of 1998 (AB 2779, Aroner).
Reduced Federal Incentive Payments. The federal government makes incentive payments to states which help offset the administrative costs of the Child Support Enforcement program. A new federal incentive payment formula will be phased-in over two years beginning in federal fiscal year 2000. The new formula will reduce California's incentive payments. In our projections, we assume that the reduction will be completely offset by additional General Fund expenditures. We estimate that the new federal incentive payment formula will result in General Fund costs of $14 million in 1999-00, $37 million in 2000-01, $64 million in 2001-02, $78 million in 2002-03, and $90 million in 2003-04.
The Supplemental Security Income/State Supplementary Program (SSI/SSP) provides cash assistance to eligible aged, blind, and disabled persons. The SSI component is federally funded and the SSP component is state funded.
The Spending Forecast. General Fund spending for SSP is projected to be $2.2 billion in 1998-99, an increase of 10 percent over the prior year. We project that General Fund spending in 1999-00 will increase 8.9 percent to a total of $2.4 billion. In comparison, spending increased by a modest 1.7 percent in 1997-98 and decreased by 1.7 percent in 1996-97. Looking at the five-year horizon, we project that spending for SSP will increase by between 3.1 percent and 5.4 percent each year, eventually reaching a total of $2.8 billion in 2003-04.
Key Forecast Factors. The spending increase in 1998-99 is due primarily to caseload growth and grant increases (the statutory COLA plus an additional 1 percent). We estimate that spending will exceed the budget act appropriation by $35 million. This increase is due to (1) a lower-than-expected increase in the Consumer Price Index (CPI) which, for technical reasons, increases the state cost of providing the grant COLA in January 1999, and (2) higher-than-anticipated caseload growth. These costs are partially offset by savings from federal legislation that continued eligibility for certain noncitizens who would otherwise have been transferred to the "state-only" program for SSI/SSP.
We project that spending will increase by about $200 million in 1999-00 because of (1) the full-year effect of current-year grant increases, which will become effective in January 1999, (2) caseload growth, (3) the application of the statutory COLA in January 2000, and (4) a modest increase in the administrative fee collected by the federal government. For 2000-01, we project spending will increase by about $100 million. This increase is due to caseload growth and a grant COLA, partially offset by savings from the scheduled termination in July 2000 of the state-only SSI/SSP for immigrants.
In 2001-02 and 2002-03, we project that spending will increase by 3.1 percent and 3.4 percent, respectively. In these years, the additional costs associated with grant COLAs and caseload growth are partially offset by savings from implementation of the regional 4.9 percent grant reduction in low-cost counties that is required by Chapter 307, Statutes of 1995 (AB 908, Brulte). This reduction has not been implemented because it would have brought the SSP grant below the federal MOE level. We estimate, however, that by January 2002 the SSP grant will be high enough to trigger the regional 4.9 percent reduction. Finally, we project that spending will increase by 5.4 percent in 2003-04.
Caseload Trends and Projections. From 1987-88 through 1995-96, the caseload increased by about 290,000 cases, with about 80 percent of this growth being in the disabled category (see Figure 4). This represented a relatively high rate of growth in the number of disabled cases, which can be attributed to factors such as AIDS-related disabilities, federal expansion of eligibility, and outreach programs. More recently, the caseload has leveled off and in fact declined by 1.2 percent in 1997-98. The recent experience of essentially no growth in caseload is partially attributable to federal policy changes that (1) eliminated drug and alcohol addiction as qualifying disabilities, (2) made aged noncitizens in the U.S. prior to August 1996 (but not yet on SSI/SSP) ineligible for assistance, and (3) restricted eligibility for certain relatively less disabled children.
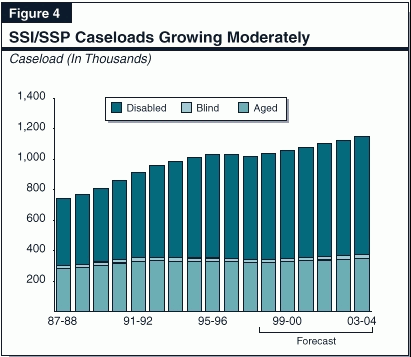
Since March 1998, the caseload has been growing. In the long run, we expect growth in the aged component of the caseload to mirror the growth of the overall population over age 65. For the disabled, we anticipate caseload growth will be similar to the average rate for the past year. In total, we project that the caseload will grow by just over 2 percent for each of the next five fiscal years.
The Food Assistance Program for Immigrants provides state-only funded food stamp benefits to almost all of the noncitizens who became ineligible for federally funded food stamp benefits because of federal welfare reform legislation.
Because current state law terminates this program in July 2000, our spending forecast reflects annual savings of approximately $115 million beginning in 2000-01.
The Child Welfare Services program provides immediate social worker response to allegations of child abuse and neglect, ongoing services to children who have been identified as victims or potential victims of abuse or neglect, and services to children in foster care who have been removed from their families because of abuse or neglect.
The Spending Forecast. We estimate that General Fund expenditures in the Child Welfare Services program will increase from $540 million in 1998-99 to $572 million in 1999-00, an increase of 6 percent.
We estimate that General Fund expenditures will continue to grow at an annual rate of about 6 percent through 2003-04, with the level of expenditures increasing from $607 million in 2000-01 to $644 million in 2001-02, $684 million in 2002-03, and $726 million in 2003-04.
Key Forecast Factors. The projected increases reflect recent trends in caseload growth (about 4 percent annually) and growth in the average cost of county social work staff (about 2 percent annually).
The In-Home Supportive Services (IHSS) program provides various services to eligible aged, blind, and disabled persons who are unable to remain safely in their homes without such assistance.
The Spending Forecast. We estimate that General Fund expenditures in the IHSS program will increase from $486 million in 1998-99 to $527 million in 1999-00. This represents an increase of about 8 percent.
We estimate that General Fund expenditures will grow at an annual rate of about 5 percent from 1999-00 through 2003-04, with the level of expenditures increasing from $556 million in 2000-01 to $586 million in 2001-02, $618 million in 2002-03, and $651 million in 2003-04.
Key Forecast Factors. California's allocation of federal Title XX funds in federal fiscal year 1999 (beginning October 1998) was reduced by $56 million. As a result, available Title XX funds in 1998-99 will be $42 million (nine-month effect) less than the amount assumed in the 1998-99 Budget Act. Our forecast assumes that (1) California's Title XX funding in 1999-00 and subsequent years will be $56 million less than the amount assumed in the 1998-99 Budget Act, and (2) the reduction in Title XX funds will be offset by additional General Fund expenditures.
In addition, the forecast assumes that the program caseload will grow by 4 percent per year, and the average hours per case will grow by 1 percent per year. These assumptions are based on recent trends.
The Department of Developmental Services (DDS) contracts with 21 nonprofit regional centers (RCs) to coordinate educational, vocational, and residential services for approximately 140,000 developmentally disabled clients each year. In addition to providing some services directly, such as diagnosis and case management, RCs purchase a variety of services from providers in the community.
The Spending Forecast. We estimate that General Fund expenditures in the Community Services Program will increase from $649 million in 1998-99 to $740 million in 1999-00, an increase of 14 percent. (These projections do not include the state's share of Medicaid reimbursements, which are reflected in the Medi-Cal budget.)
Beyond the budget year, we estimate General Fund expenditures of about $800 million in 2000-01, $875 million in 2001-02, $950 million in 2002-03, and $1 billion in 2003-04. This reflects an average annual growth rate of 8.6 percent.
Key Forecast Factors. The projected increases are primarily due to (1) estimated basic caseload growth of 5 percent annually (based on a continuation of recent trends) and (2) inflation in service costs. The rate of growth in spending is higher in 1999-00 due to the full-year impact of two initiatives begun in the current year to improve client health and safety.
In addition, we estimate that current-year General Fund expenditures will exceed the 1998-99 Budget Act appropriation by about $35 million due to a federally imposed freeze of the state's Home and Community-Based Services waiver program, under which California receives federal funds for clients served in the community. In December 1997, the federal Health Care Financing Administration (HCFA) froze admissions to the waiver program after reporting numerous health and safety concerns for clients receiving services in the community. Since then, the number of clients covered by the waiver has dropped from 35,000 to approximately 31,000 as of October. Although HCFA has approved a new waiver program effective October 1, 1998, the admissions freeze will continue until DDS and the Department of Health Services demonstrate increased state-level oversight and monitoring of waiver services. As a result, DDS indicates that it will collect less federal funding than projected in the 1998-99 budget.
The Medi-Cal Program (the federal Medicaid Program in California) provides health care services to recipients of CalWORKs and SSI/SSP grants, and to other low-income persons who meet the program's eligibility criteria (primarily families with children and the elderly, blind, or disabled). The state and the federal governments share most of the costs of the program on a roughly equal basis.
The Spending Forecast. We estimate that General Fund spending for Medi-Cal benefits (excluding administrative costs) will be $6.74 billion in 1998-99, which is $309 million more than the amount appropriated in the budget act. The following four adjustments account for the bulk of the difference from the budget act appropriation:
General Fund spending for Medi-Cal benefits increases by only 1.5 percent in 1999-00 in our forecast due to the partial offset of cost increases by continued declines in caseload and the assumed elimination of prenatal care costs for undocumented immigrants. By the end of the forecast period in 2003-04, we project that General Fund spending for Medi-Cal benefits will reach $8.7 billion, an average annual increase of 6.1 percent.
Key Forecast Factors. As shown in Figure 5, the total Medi-Cal caseload peaked in 1995-96 at almost 5.5 million, and has declined by about 10 percent since thento 4.9 millionprimarily due to the reduction in the CalWORKs caseload. As noted in our CalWORKs discussion, the decline in the CalWORKs caseload slows in our forecast, from 8 percent in 1999-00 to 0.3 percent in 2003-04. Meanwhile, over this period, other Medi-Cal caseloads grow modestly. The elderly and disabled caseload and the caseload of families and children who are in Medi-Cal, but not in CalWORKs, grow at annual rates of 2 percent and 1.3 percent, respectively, during the forecast period. These rates reflect our demographic projections that show the elderly population growing faster than the population of women in their primary childbearing years and of younger children over this period. The combination of the slowing decline in the CalWORKs caseload and ongoing modest growth for other Medi-Cal eligibility groups results in the total Medi-Cal caseload declining to about 4.6 million in 2001-02, and then growing slightly (about 1 percent annually) through 2003-04.
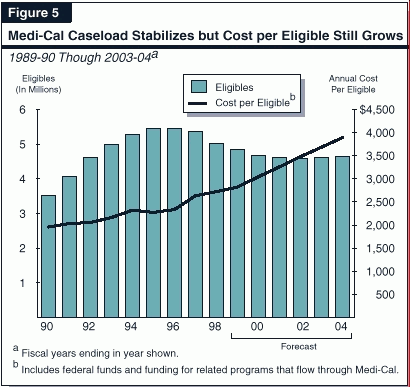
Although the caseload declines, spending increases over the forecast period, due to a general increase in the cost of health care (assumed to be 5 percent annually for most of the forecast period) and a more expensive "case mix." As the CalWORKs caseload declines, a larger proportion of the Medi-Cal caseload consists of the elderly or disabled, whose average medical costs are higher than those of children and families. The effect of this changing case mix adds about 3 percent to the increase in the cost-per-eligible in 1999-00 (when the decline in the CalWORKs caseload is large), but less than 1 percent in 2003-04 (as the CalWORKs caseload flattens).
Uncertainties and Risks. Below we discuss several uncertainties and risks associated with our forecast, each of which could result in a higher level of spending.
We note that the 1997-98 and the 1998-99 budgets provided DHS with significant additional funds for enrollment outreach targeted at children and families. To the extent that these expanded outreach activities are successful in the future, enrollment and costs would increase. If the participation rate remains at its current level rather than declines, General Fund spending could increasepotentially by a cumulative total of several hundred million dollars over the forecast period.
The Healthy Families program provides medical, dental, and vision coverage for children in families with incomes below 200 percent of the federal poverty level, but above Medi-Cal limits. The program resulted from federal and state legislation enacted in 1997, and coverage of children began in July 1998. The Managed Risk Medical Insurance Board (MRMIB) administers the program with the cooperation of the DHS, which oversees some of the administrative and outreach functions as well as some modest Medi-Cal expansions that are part of the overall program. (The DHS costs for the program are included in our Medi-Cal estimate.) The federal government provides funding for the Healthy Families program on approximately a two-to-one matching basis.
The Spending Forecast. We estimate that General Fund spending for the Healthy Families program will be $22.9 million in 1998-99, or $15.3 million less than the budget act appropriation of $38.2 million. This reduction is due to enrollment in the Healthy Families program that is substantially behind budget estimates. As of October 31, 1998, enrollment totaled 33,000less than half of the budget estimate for that date.
At current monthly enrollment rates, total enrollment on July 1, 1999 will be only about 60 percent of the budget estimate. Based on these trends, we estimate that General Fund spending will reach $144 million in 2003-04.
Key Forecast Factors. The shortfall in enrollment is partly due to an apparent overestimate of the potentially eligible population. Based on revised data released in October 1998 by the University of California Los Angeles Center for Health Policy Research, MRMIB has reduced its estimate of the total number of potentially eligible uninsured children by 27 percentfrom 551,000 to 400,000.
The complexity of the Healthy Families application and concerns of immigrant families about using the program appear to have contributed to the lower-than-anticipated rate of enrollment. Some increase in the rate of enrollment could result from a current effort by MRMIB and DHS to simplify and shorten the existing 28-page enrollment application, and to seek clarification from the federal government regarding the effect of enrollment in Healthy Families on the immigration status of immigrant children or parents.
We note that the General Fund share of administrative and outreach costs of the Healthy Families program could increase by up to several million dollars annually if enrollment remains low. This is because a large portion of those costs are fixed, but federal funding of such costs is limited to one-ninth of benefit costs.
This section reviews our estimates of state Proposition 98 costs for K-14 education (K-12 schools and community colleges).
Proposition 98 sets the minimum
amount that the state must provide for California's public
K-12 education system and the California Community Colleges.
About 85 percent of total funding for these school programs
is from the state General Fund and local property taxes. Public
K-12 education in California is provided to about
5.6 million studentsranging from infants to adultsthrough
about 1,060 locally governed school districts and county offices
of education. The California Community Colleges provide
instruction to about 1.4 million adults at 107 colleges
operated by 71 locally governed districts.
The Spending Forecast. We estimate that annual growth in total Proposition 98 spending (General Fund and local property taxes) for K-14 education will be about 5 percent for the forecast period (1999-00 through 2003-04). This is lower than the 9.2 percent increase in 1997-98 and the projected increase of 7.2 percent for the current year. Proposition 98 spending in these two years reflects appropriations above the minimum guarantee. For 1998-99, the appropriation above the guarantee (at the time the budget was enacted) was almost $600 million, which raises the Proposition 98 base for all future years. (Based on our current revenue estimates, this appropriation above the minimum has grown to an estimated $1.1 billion.) Our forecast also reflects (1) the reduction in taxes approved by the Legislature during the 1998 session, (2) our moderate revenue forecast, and (3) future spending at the minimum Proposition 98 guarantee level.
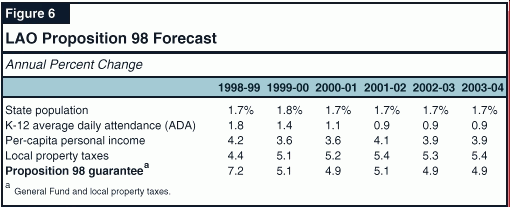
Key Forecast Factors. General Fund expenditures for Proposition 98 depend on the following factors: state population, K-12 average daily attendance (ADA), per-capita personal income, per-capita General Fund revenues, and local property taxes. Figure 6 summarizes our assumptions for these factors and the guarantee which results. Our economic forecast assumes state tax revenues will grow by about 5.5 percent annually over the forecast period. We also assume that growth in local property tax revenues will continue to recover from the relatively low rates of the past few years. As indicated in the figure, these inputs increase the total guarantee (General Fund and local property tax) by around 5 percent for the forecast period.
K-12 Funding Projections.
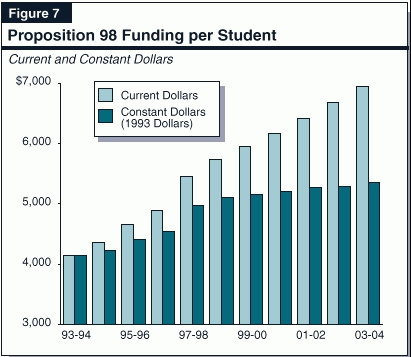
Figure 7 displays our projected K-12 per-pupil spending from
1993-94 through 2003-04 (in both "current" and
inflation-adjusted dollars). These estimates, which are derived
from our Proposition 98 forecast, reflect real (that is,
inflation adjusted) per-pupil increases of about 1 percent
each year between 1999-00 and 2003-04. These additional
resourcesamounting to over $300 million each yearwould
permit modest expansion of existing programs and/or funding for
some new programs.
Community College Funding Projections. Based on our Proposition 98 projections, we estimate total community college funding will increase by about 5 percent a year over the forecast period. (This assumes no change in the proportion of Proposition 98 funds going to community colleges.) After adjusting for inflation, this would provide about a 2 percent increase annually for additional enrollment and/or program improvements.
In addition to community colleges, the state's public higher education system includes the University of California (UC) and the California State University (CSU). The UC consists of eight general campuses, one health science campus, and numerous special research facilities. The UC awards bachelor's, master's, and doctoral degrees, as well as various professional degrees. The UC has primary jurisdiction over research. The CSU consists of 22 campuses and several off-campus centers. The CSU grants bachelor's and master's degrees and may award doctoral degrees jointly with UC or a private university.
The Spending Forecast. We estimate that spending for UC and CSU (excluding funding for debt service) will increase from $4.5 billion in 1998-99 to $4.6 billion in 1999-00, or by 2.1 percent. After adjusting for one-time appropriations in the 1998-99 budget for UC and CSU ($147 million), however, the increase for 1999-00 would be 5.5 percent. For 2000-01, we estimate that spending for UC and CSU (excluding funding for debt service) will increase to $4.8 billion, or by 4.8 percent compared to 1999-00.
Key Cost Factors. For 1999-00 and subsequent fiscal years, we assume that UC and CSU will receive "base" budget increases equivalent to the growth in inflation and enrollments. Over the forecast period, inflation is projected to average about 3 percent annually and enrollment for the two segments combined is forecast to grow an average of about 2 percent a year.
General Fund Replacement of
Foregone Fee Revenues. Chapter 853, Statutes
of 1997
(AB 1318, Ducheny), reduced UC and CSU systemwide fees for
resident undergraduates by 5 percent for 1998-99 and
"freezes" those fees at the reduced level for 1999-00.
Chapter 734, Statutes of 1998 (SB 1896, Peace), reduced
resident graduate student fees to the undergraduate level. Our
projection for 1999-00 includes an additional $33 million to
"buy out" a 4.5 percent fee increase that UC and
CSU would have recommended absent these legislative restrictions
on fee increases. This assumption is consistent with similar
actions taken by the Legislature and Governor in the last three
annual budget acts.
The major state judiciary and criminal justice programs include support for four agencies in the executive branchthe Departments of Corrections, the Youth Authority, Justice, and the Office of Criminal Justice Planningas well as expenditures for local trial courts and state appellate courts. The largest expenditure programsthe Department of Corrections and the Trial Court Funding Programare discussed in more detail below.
The California Department of Corrections (CDC) is responsible for the incarceration, training, education, and care of adult felons and nonfelon narcotics addicts at 33 state prisons. The CDC also supervises and provides services to parolees released to the community.
The Spending Forecast. The department's General Fund support budget is forecast to grow between 1997-98 and 1999-00 by almost $575 million, exceeding $4 billion at the end of that period. We further project that annual CDC support expenditures will reach almost $5.3 billion by the 2003-04 fiscal year. (This includes adjustments for employee compensation increases but does not include General Fund support for capital outlay or lease-payment bonds, which are accounted for elsewhere in our projections.)
The department's General Fund costs will be partially offset by reimbursements from the federal government for the state's costs of housing undocumented immigrants convicted of felonies in California. We expect federal support to drop from $195 million in 1997-98 to $161 million by 2003-04. Although our estimate assumes that Congress will continue to provide the same total level of funding to reimburse states as it has in the past two years ($585 million nationwide), we assume that California's share of the total will decline somewhat as other states and local governments become more sophisticated at tracking their costs for incarcerating undocumented felons and making claims to the federal government.
The projected growth in adult correctional expenditures continues a trend of steadily larger CDC budgets that has existed since the early 1980s.
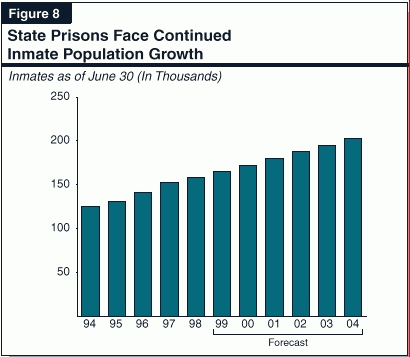
Key Forecast Factors. The significant increases projected in General Fund support for the CDC reflect continued major growth in the prison inmate population expected during the forecast period. Our estimates through 2003-04 are based primarily on the CDC's projections of the inmate population. We believe the CDC projections are reasonable, but have adjusted the figures to take into account budget and other statutory correctional program changes that were enacted after the projections were completed. We anticipate that the CDC prison population will exceed 200,000 by June 2004, representing an increase of as many as 44,000 inmates or about 28 percent over the six-year projection period. (Our projections are shown graphically in Figure 8.)
The increase in prison population is largely the result of tougher sentencing measures approved by the Legislature, Governor, and the voters, including the "Three Strikes and You're Out" law enacted in 1994. Also, demographic shifts, in particular the growth in the state's 18-to-24 age group, can increase the prison population. On the other hand, the state of the economy and the availability of jobs to persons who might otherwise commit crimes can work to reduce the growth in the inmate population. Local law enforcement practices and the deterrent effects of tougher sentencing policies also could have an effect on the numbers of persons arrested and convicted of crimes.
This continued inmate growth represents a major operational and fiscal challenge to the state. Should it persist, the CDC support budget would grow at an average annual rate of 7.9 percent in the short term (through 1999-00) and 7.2 percent in the long term (through 2003-04).
Moreover, if these trends hold, the state prison system will exhaust all available space for housing inmatesincluding 7,200 beds the department considers to be "high security risk" (such as triple bunks in prison gymnasiums and dormitories) and not viable long-term housingby late 2001. By June 30, 2004, the state would have to accommodate 27,000 inmates for whom space is not now available. That is the equivalent of five to six state-run prisons carrying a one-time construction cost of $1.6 billion. However, the cost of CDC operations and capital outlay could be lower if the Legislature and Governor or the courts took further actions which either slowed inmate population growth or provided alternative forms of punishment for some offenders.
Meanwhile, the number of parolees under the supervision of CDC parole agents is also expected to increase, reflecting the overall growth in the state's population of criminal offenders. Once again, we have adjusted CDC parole population projections to take into account 1998 correctional program changes that are likely to keep more parolees out of prison and under continued supervision by parole agents. Accordingly, we project that the parolee population will grow by more than 30,000, or almost 30 percent, over the six-year period ending June 30, 2004.
Under the Trial Court Funding Program, the state pays for the bulk of costs of operating the trial courts throughout the state. Legislation enacted in 1997 (Chapter 850, Statutes of 1997 [AB 233, Escutia and Pringle]) restructured the program and significantly increased the state's fiscal obligation for support of the courts, beginning in 1998-99. Specifically, the measure reduced and capped each county's financial obligation, and increased the state's obligation by providing that the state will be responsible for supporting all future cost increases for the trial courts. Two other recent measures--Chapter 406, Statutes of 1998 (AB 1590, Thomson) and Chapter 1017 (AB 2788, Thomson)--further increased the state's financial responsibility for support of the trial courts and reduced the counties' responsibility.
The Spending Forecast. Total General Fund expenditures for support of the courts will increase from $399 million in 1997-98 to almost $1.3 billion in 2003-04more than a three-fold increase.
Key Forecast Features. The increases in the first two years of the projection period1998-99 and 1999-00will be the most significant because of the implementation of the various pieces of legislation outlined above. Costs will increase $260 million in 1998-99 (a 65 percent increase) and $218 million in 1999-00 (a 33 percent increase) as the state's financial responsibility increases and the counties' financial responsibility decreases. We assume that the costs will increase throughout the projection period consistent with historical increases in trial court costs and projected increases in court-related workload. Our estimates assume that the largest periods of growth will occur during the early years of the projection period and taper off somewhat in the later years as the state gains greater control over the operations and costs of the trial courts. We would note that any major new state trial court programs enacted in the future would have to be paid for entirely by the state.
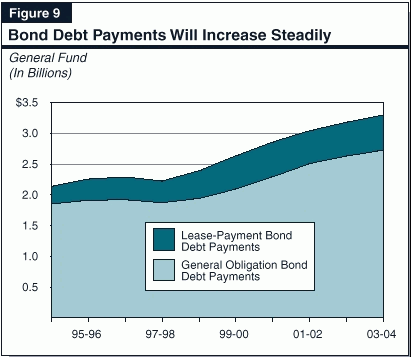
Debt Payments. As shown in Figure 9, we estimate that General Fund debt costs (for general obligation and lease-payment bonds) will increase from $2.4 billion in the current year to about $3.3 billion in 2003-04. This is an average annual increase of 6.7 percent. Our forecast assumes that almost $16 billion in currently authorized bonds will be sold over the forecast period, including almost all of the $9.2 billion in education bonds approved by the voters at this month's election. We also assume that additional bonds will be approved in 2000 and 2002 of which $2 billion would be sold by 2003-04. As a percent of total debt, lease-payment bond debt peaks at 20 percent in 1999-00 and declines to 17 percent in 2003-04 based on currently authorized bonds.
Debt Ratio. The state's debt ratio (debt payments as a percent of General Fund revenues) increased from 2.5 percent in 1990-91 to a high of 5.1 percent in 1994-95. In recent years, General Fund revenues have increased at a faster rate than the increase in debt payments. Thus, the debt ratio declined to 4.2 percent in 1997-98. We estimate that with sales of currently authorized bonds, the debt ratio will increase to 4.7 percent in 2001-02 and decline thereafter. Voter approval of additional general obligation bonds or legislative authorization of new lease-payment bonds would, of course, increase the debt ratio.
As part of the 1998 tax reduction package, the vehicle license fee (VLF) was reduced by 25 percent. Cities and counties will continue to receive the same amount of revenues as under prior law, with reduced VLF amounts replaced by General Fund spending. This tax reduction takes effect January 1, 1999. As a result, the General Fund backfill in 1998-99 will only be for half of the fiscal year, at an estimated cost of $533 million. The first full-year backfill will occur in 1999-00 at an estimated cost of about $1 billion.
Beginning in 2000-01, additional reductions in the VLF would be triggered if certain revenue levels are reached. As we describe in Chapter 1, our projected revenues are well below the trigger levels. In the event of an additional VLF reduction, however, the General Fund backfill would increase to cover local governments' further losses.