Legislative Analyst's Office
The 2003-04 Budget Bill:
|
Most areas of the U.S. and California economies are struggling in early 2003. Although there have been some positive developments—namely, strength in interest-sensitive home and automobile sales—overall economic growth has subsided in recent months, and is currently at risk of stalling out altogether. At present, consumer and business spending are being held in check by lagging confidence and uncertainties surrounding a potential war with Iraq. Looking ahead, we anticipate sluggish economic performance to continue through the first half of 2003, before giving way to more moderate growth in the second half of the year. A key to improved economic performance is business capital spending and hiring, which have been extremely soft during the past two years.
The performance of the U.S. economy was generally disappointing in 2002. Although the year began on an upbeat note and real gross domestic product (GDP) did expand by 2.8 percent over the 12-month period, growth was unbalanced between major economic sectors, and the gains that did occur were insufficient to produce an improvement in employment and wages during the year.
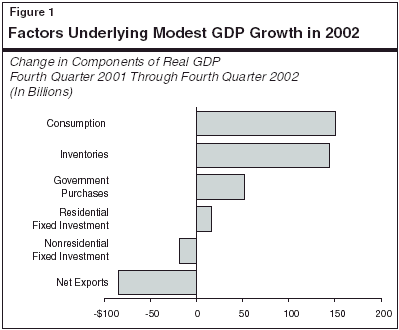
Figure 1 shows that virtually all of the economic growth that did materialize came from consumer spending, inventory restocking, and government purchases. Nonresidential fixed investment—which includes business spending on equipment, software, and facilities—and net exports fell during the year. The declines in these two latter sectors were of particular importance to California, whose manufacturing and business services industries are dependent on business investment and foreign demand.
The growth in output that occurred in 2002 was largely accomplished through increased worker productivity and extended hours, as opposed to increases in the number of jobs. In fact, the nation lost about 180,000 jobs between December 2001 and December 2002, as businesses cut back payrolls in an effort to eliminate excess capacity, curtail costs, and boost profits. These economizing measures have had a positive effect on businesses' "bottom lines." For example, earnings reports for the fourth quarter show significant profit gains from the prior year. However, especially in a state with California's continuously expanding population, the key to healthy economic growth involves increases in productive capacity, out put, and jobs. Absent an improvement in the job market, it is unclear how much longer consumer spending on homes, cars, and other durable goods will be buoyed by low interest rates. The lack of consumer demand could, in turn, further delay any meaningful pick up in business investment. Given this, our expectation that there will be an improvement in business hiring and capital spending during 2003 and 2004 is an important element of our forecast.
Like the nation's, California's economy struggled in 2002. Wage and salary employment grew a marginal 0.3 percent between December 2001 and December 2002, with widely divergent performances among both industries and geographical regions within the state. The main bright spot has been housing construction, which strengthened during the year.
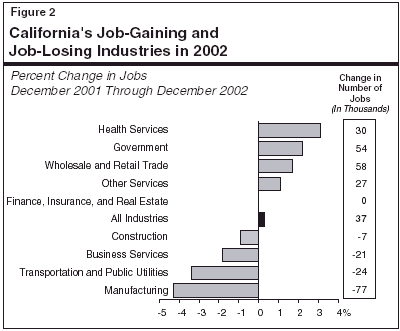
As indicated in Figure 2 (see next page), job gains occurred in industrial sectors that particularly benefited from population growth and low interest rates. These included nonbusiness services, retail trade, government, and finance-related industries. Losses occurred in construction—mostly related to declines in the nonresidential markets—as well as in business services, transportation (reflecting continued layoffs in airline-related industries), and manufacturing. The latter was battered by weak U.S. investment spending and declines in foreign demand for California-produced goods.
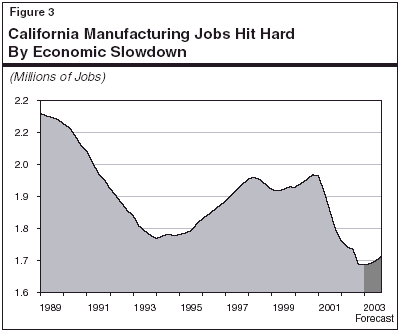
Manufacturing Job Losses Were Severe. As shown in Figure 3 (see next page), California's manufacturing sector lost over 250,000 jobs between early 2000 and the end of 2002. About one-half of these jobs were in high-paying computer-related industries, which were adversely affected by the downturn in U.S. capital spending and ongoing softness in exports. Computer-related services also experienced a major downturn, losing more than 60,000 jobs over the past two years. The job declines in these industries are of special significance, given that their wage levels tend to be well above those of other sectors of the economy (see Figure 4, see next page). On a slightly more positive note, however, both manufacturing and computer-related services job losses have subsided in recent months, and industry reports show an uptick in orders for computer chips. These reports provide tentative evidence that the worst of the manufacturing slump is over.
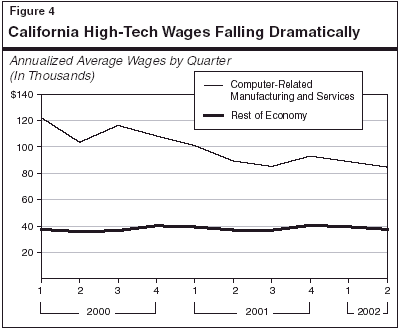
Pay In High-Tech Jobs Also Down. Along with job losses, Figure 4 shows that average wages within the high-tech manufacturing and services industries have also experienced major declines over the past two years. These losses are partly related to a nearly 80 percent slide in stock option-related income and bonuses (which are included in the wage totals). Figure 4 shows that average wages within the computer-related manufacturing and services industries fell from a peak of $120,000 (annual rate) in the first quarter of 2000 to about $80,000 as of mid-2000. While the average wages in these industries remain over double the statewide average, the nearly one-third average wage decline in these sectors has sharply depressed overall California income growth during the year. Given the continued poor performance of the stock market, it is unlikely that average wages in these industries will recover any time soon.
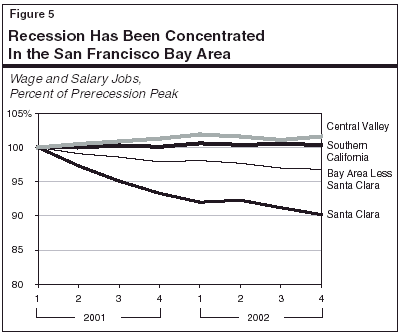
In sharp contrast to the early 1990s, when the recession was centered in southern California, the current economic slowdown is focused in the San Francisco Bay area. This is illustrated in Figure 5 (see next page), which expresses jobs in each geographic region as a percentage of their first quarter 2001 totals (which is when the national recession began). It shows that:
As of early 2003, most evidence suggests that California, like the nation, is in a period of very sluggish growth that is likely to persist for several months. While residential real estate markets remain strong, employment, income, and spending remain soft, as do most other areas of the economy.
The Governor's budget assumes that both the U.S. and California economies will expand at a sluggish pace throughout most of 2003, before accelerating in 2004. At the national level, real GDP is projected to increase by 2.5 percent in 2003—about the same pace as last year—and by 3.5 percent in 2004 (see Figure 6). Key assumptions in the forecast are that (1) U.S. consumer spending growth will subside to 2 percent in 2003, before partially rebounding to about 3 percent in 2004, and (2) business capital spending will remain dormant throughout most of this year, before reviving to a moderate pace in 2004. The forecast assumes that interest rates and inflation will rise some from current levels, but will remain low by historical standards.
The administration's forecast assumes that California's economic performance will parallel that of the nation as a whole—with sluggish employment and income growth this year, and moderate growth next year. State personal income is projected to increase by an estimated 3.3 percent in 2003 before mildly accelerating to a 5.3 percent pace in 2004.
Our forecast assumes that the current period of sluggish economic growth will persist until mid-year, before improving in the second half of 2003 and in 2004. While our updated outlook is more conservative than our November 2002 projection, it nevertheless remains a bit more positive than the administration's January budget forecast—reflecting an earlier and stronger acceleration in economic activity.
As shown in Figure 7, we project that real GDP will expand by 2.6 percent in the current year and by 3.8 percent in 2004. This forecast is predicated on the assumptions that (1) consumer spending will remain on an upward track, and (2) business investment and hiring will gain momentum in the second half of 2003 and accelerate further in 2004.
Despite a disappointing holiday shopping season, consumer spending held up reasonably well in 2002. This is especially the case given the loss of jobs and the weak income growth that persisted through the year. The primary force behind spending growth was low interest rates, which boosted sales of automobiles, houses, and related big-ticket items such as large appliances. While these factors will help keep spending on an upward track during 2003, it is unlikely that consumption will regain significant momentum until late in the year when more fundamental improvements in employment and income take hold.
A key to achieving improved economy-wide income and job growth—and thus the hoped-for improvement in consumer spending—is stepped-up hiring and capital spending by businesses. Normally, investment spending turns up sharply in an economic recovery, as businesses seek to expand capacity to meet new demand. However, businesses remained reluctant to step up spending in 2002. Factors cited by business executives for such limited investment spending include significant over-capacity in many industries and, more recently, uncertainties concerning the timing and consequences of a Middle Eastern conflict.
Several key factors favor an eventual upturn in capital spending. For example, investment spending relative to GDP is currently at historically low levels, and many businesses have not upgraded their major information technology (IT) systems since late 1999 (in preparation for Y-2K). However, these positive forces will not take hold until some of the near-term uncertainty clears up, and business executives regain a greater degree of confidence in the economy.
Our forecast assumes that business spending on equipment will start to improve in the second half of this year, as uncertainties about war and the durability of the expansion subside. Regarding investment in facilities, we are projecting that this will turn upward in 2004, as the rate of capacity utilization recovers. As discussed below, the timing and strength of the capital spending recovery is the single largest "wild card" in the current economic outlook.
We forecast that California's economy will continue to struggle in the first half of 2003, as ongoing softness in national investment spending and exports depress the state's manufacturing industries. Then, we expect that economic growth will turn upward in the second half of the year and further accelerate in 2004. Our forecast assumes that the manufacturing slump will bottom out in the first half of this year, and that the interest-sensitive housing and finance-related sectors will continue to push the economy upward.
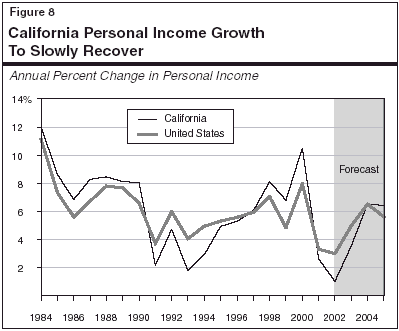
Historically, California's employment and income growth has outpaced the nation, reflecting the state's relatively faster population growth and its large share of fast-growing, high-tech industries. However, during the past two years, its personal income growth fell well below the nation's, due to the sharp cyclical downturn in computer and software employment, and the major drop in stock-option income. As shown in Figure 8, our forecast assumes that California personal income growth will once again lag the nation in 2003, but will overtake it in the subsequent two years, as improvement in business capital spending results in added jobs and income in California's high-tech industries.
California's residential construction activity was up considerably in 2002. New building permits were issued at an annual rate of about 180,000 units in the final quarter of the year—the highest level since the first quarter of 1990. Single-family housing permits were up in almost all geographic regions of the state, with particularly large gains experienced in the Sacramento and Riverside/San Bernardino regions. Multi-family permits were also up in most regions other than the San Francisco Bay area, with Los Angeles experiencing particularly large gains.
We are forecasting residential permit activity to drop back some from its fourth quarter levels (in part because we understand that some of the fourth quarter activity may have been an acceleration to avoid scheduled permit-related fee increases in some geographic areas of the state). However, we still expect this sector to remain relatively strong though 2003 and 2004, reflecting low interest rates and continued population growth in California.
In contrast to residential construction, nonresidential construction fell in both 2001 and 2002. As shown in Figure 9 (see next page), the total value of nonresidential permits has fallen by about 30 percent, or roughly $7 billion, from its 2000 peak of nearly $21 billion. This substantial overall decline reflects a major drop in office construction throughout the state, which in turn is due to rising office vacancy rates. It also reflects a major drop in industrial building in Silicon Valley, where new construction is only a small fraction of prior-year levels due to the battering the high-tech sector and its supplier industries have taken there.
We forecast that nonresidential construction will continue to lag in 2003, reflecting soft business conditions, before partially rebounding in 2004. Regarding the components of nonresidential construction, we expect commercial building to rebound beginning in late 2003, and industrial and office construction to start improving in 2004, as vacancy rates start falling and business once again starts adding to its available capacity.
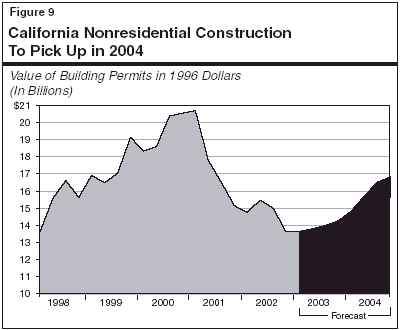
Figure 10 compares our forecasts for the nation and California to our November 2002 forecast, as well as to a variety of other economic forecasts made in recent months. These include the projections made by the University of California, Los Angeles (UCLA) Business Forecasting Project in December 2002, the consensus forecast published in the Blue Chip Economic Indicators (January 2003), the consensus outlook in the Western Blue Chip Economic Forecasts (February 2003), and the Governor's budget forecast.
It shows:
The current economic outlook faces serious risks from a number of quarters. These include a protracted war and an associated spike in oil prices, further weakness in the European and Asian economies (which would have additional negative effects on U.S. net exports), and a further slump in the U.S. stock market (which would adversely impact U.S. consumer and business spending).
Even if the nation's economy avoids the above-mentioned pitfalls, however, there is still an inherent risk associated with our predicted improvement in business investment spending and related hiring. Continued weakness in this area would have direct adverse impacts on GDP growth and could also undercut consumer spending—the strength of which will depend increasingly on job growth and income gains over the next year.
California's demographic trends both directly and indirectly affect the state's economy, revenue collections, and expenditure levels. For example, they influence the size of the labor force, the demand for homes and automobiles, the volume of taxable sales, and the amount of income taxes paid. Similarly, the population and its age distribution affect school enrollments and public programs in many other areas, such as health care and social services. Consequently, the state's demographic outlook is a key element both in predicting economic performance and in assessing and projecting the state's budgetary situation.
Figure 11 summarizes our updated state demographic forecast. We project that California's total population will rise from an estimated 35.8 million in 2003 to 36.3 million in 2004 and 36.8 million in 2005. These population projections use as their starting point published 2000 Census data for California, and have not been adjusted to correct for issues related to potential undercounting (see discussion in shaded box, page 32).
Some Slowing Projected. The state's population is projected to grow at an average rate of about 1.4 percent annually over the next three years. This growth is slightly slower than that experienced in the latter part of the 1990s, reflecting both the dampening effects of a slower economy on net in-migration, as well as a continued decline in birth rates. Nevertheless, the state's projected growth rate still is well above the nation's current rate of about 1 percent annually.
In numeric terms, the number of new Californians being added each year—roughly 500,000—is well above the size of such cities as Long Beach, Oakland, and Fresno, and very similar to such states as Wyoming.
What Is the Latest on the Undercount Issue?Background. For many years now, a major issue concerning the decennial census has been the size and distribution among states of the population "undercount" that occurs when the census is undertaken every ten years—that is, the number of individuals that are not counted through the traditional methods that the census uses. Because California's population includes many subgroups that are known to be particularly subject to being undercounted, the incorporation of accurate undercount figures into the census results would have significant beneficial implications for California, including the amount of federal funds that would be distributed to the state. Adjusted Data Were Developed but Not Initially Released. Shortly after conducting the 2000 Census, the Census Bureau employed statistical methods to estimate the number of persons that census takers were unable to count via questionnaires or in-person visits. However, although the bureau did release an aggregate, national undercount figure, it elected not to use the adjusted data. In doing so, the bureau expressed concerns about imperfections in the sampling process. As a result, the bureau declined to publish adjusted numbers for states, counties, or cities. Adjusted Data Were Then Released But Repudiated. Following numerous requests filed under the Freedom of Information Act, a federal court ordered the release of the adjusted data by the bureau, and the data were in fact made available in late 2002. In releasing the adjusted figures pursuant to the court order, the bureau noted that it has determined that its methodology dramatically overstates the number of individuals not picked up in the actual census count, and thus the adjusted total is no more accurate than the unadjusted data. The Department of Commerce (which oversees the Census Bureau) has taken the position these adjusted estimates should not be used for any purpose that legally requires use of data from the decennial census, and that it will not assist public or private entities in using or interpreting the adjusted population numbers. At this point, the federal government is not using adjusted census data for distributing federal funds to states and localities. What Do the Adjusted Data Show? The adjusted data that were released indicate that the 2000 census' national undercount was 3.2 million persons (1.2 percent of the total U.S. population), an improvement over the 1990 census' 4 million undercount (1.6 percent of the total). Likewise, according to the adjusted data, California's 2000 census undercount reportedly improved considerably from 1990. While California's undercount rate was 2.7 percent in 1990, it was just 1.5 percent in 2000. However, California's rate was still reportedly higher than the national rate as expected, given its population characteristics. Not Having Accurate Demographic Data Hurts California. Because California is particularly vulnerable to undercounting, the use of unadjusted census data causes California to lose formula grant funding (the allocation of nearly $200 billion in federal formula grant funds to state and local governments depends on decennial census figures). Counties with high undercount rates are particularly disadvantaged. California counties thought to have undercount rates exceeding the national average include Alameda, Fresno, Kern, Los Angeles, Orange, San Bernardino, San Diego, San Francisco, and San Joaquin. The use of inaccurate population figures also creates problems for the state in using demographic data to forecast such economic and fiscal variables as school populations, health and social services caseloads, infrastructure needs, available labor force, and housing needs. So, Where Does This Leave Us? Despite the legitimate concerns about undercounting and California's predilection to being adversely affected by it, the allocation of federal funds continues to be based on the unadjusted data. Both public and private sector economists in the state, however, generally continue to rely on official census figures in their work, largely because better alternative comprehensive demographic data series are simply not available at this time. |
California's population growth can be broken down into two major components—natural increase (the excess of births over deaths) and net in-migration (persons moving into California from other states and countries, minus people leaving the state for other destinations). The population growth associated with natural increase accounts for just over one-half of California's projected annual growth over the forecast period, and is assumed to be fairly stable. Net in-migration accounts for the other half of the growth over the period, but varies with California's economic cycle.
Natural Increase. We project that the natural-increase component will contribute around 266,000 new Californians annually over the forecast period. This amount is slightly less than in the late 1990s due to the ongoing decline of birth rates being experienced by all ethnic groups. Despite declining birth rates, however, the natural-increase component is projected to grow slightly. This is due to significant growth in the female population of child-bearing age groups in faster-growing segments of the population, including Hispanic and Asian women.
Net In-Migration. We project that net in-migration will average roughly 232,000 annually over the next three years, or 34,000 less than the natural-increase component. The population growth associated with net in-migration is projected to decline in the near term, due to the economic slowdown. However, a modest rebound is forecast in 2005, reflecting the state's projected economic strengthening.
Roughly 95 percent of the state's net in-migration is associated with foreign in-migration. Foreign in-migration has remained relatively steady over the past decade and we expect similar levels in the near future, although some decline should result from the economy's sluggishness.
Regarding net domestic in-migration, this has historically fluctuated with California's economy. For example, California's early 1990s' recession resulted in negative net domestic in-migration, as more people were leaving the state than were moving in from other states. Similarly, we project that the current slowdown of the state's economy again will result in a decline in net domestic in-migration, especially in the very near term. However, net domestic in-migration should rebound somewhat in response to the economy's recovery, before tapering off to its projected long-term level.
The implications of demographic trends for the budget depend not only on the total number of Californians, but also on their characteristics. California is well known for having one of the world's most dynamic and diverse populations, including an increasingly rich ethnic mix; a large number of in-migrants; and a wide geographic dispersion encompassing highly urban, suburban, and rural lifestyles. The state's current age and ethnic mix is shown in Figure 12.
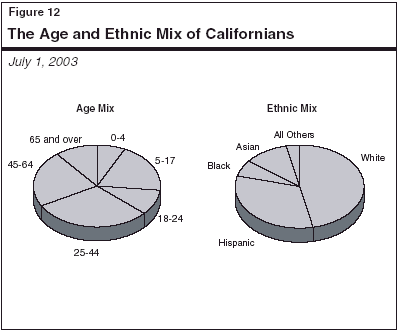
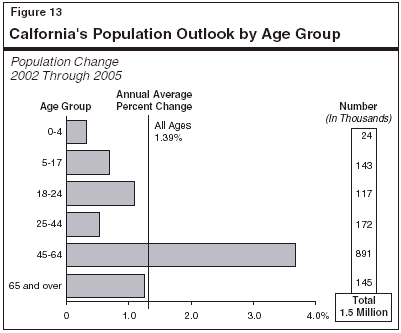
Regarding ethnicity, we project a continuing trend toward increased diversity, as the whites' share drifts down and that for Hispanics and a wide variety of other ethnic groups rises. The age-related characteristics of California's population growth are especially important from a budgetary perspective, given their implications for such program areas as education, health care, and social services. Figure 13 shows our forecasts for both the percentage and numeric changes in different population groups. The 45-to-64 age group (baby boomers) continues to be the fastest growing segment of the population. About 890,000 new people are expected to move into this age category over the next three years, as the tail end of the baby-boom generation moves into its mid-40s.
California's continued strong population growth—including its age, ethnic, and migratory characteristics—can be expected to have many implications for the state's economy and public services in 2003-04 and beyond. For example, strong growth of the 45-to-64 age group generally benefits tax revenues since this is the age category that normally earns the highest wages and salaries. The slowing growth in the 5-to-17 age group implies slower growth in K-12 school enrollments. More general examples of demographic influences include the following:
