
High school is the culminating experience for students during their K-12 years. While many go on to college or technical school, high school represents the end of formal education for many students. High school also is a kind of “launching pad” into adult life. Students mature a great deal during these later teenage years, developing important work habits and attitudes as they become more independent.
This report examines how well high schools are helping all students learn and succeed in their postgraduation goals. Our report begins with a brief overview of current high school outcomes. In Chapter 2, we discuss state laws and policies that influence what students study during high school. Chapter 3 focuses on the issue of high school dropouts. Chapter 4 looks at high school from the perspective of high school graduates who plan on working or attending community college after graduation. Chapter 5 examines how admission policies of the state’s public four-year universities affect incentives for achievement in high school. Chapter 6 provides a summary of the report’s major recommendations.
Our recommendations offer the Legislature several ways to improve high schools. Alone, these changes will not address all of the problems in high schools. Many critical factors are outside of the state’s control. We think, however, our recommendations provide a strategic “road map” for how the state can contribute to improving high schools.
Chapter 1
In 2002-03, 1.8 million students enrolled in grades 9 through 12-the typical high school grades. Most students attend a traditional high school, one that contains grades 9 through 12. In 2002-03, 855 traditional high schools enrolled more than 85 percent of all high school students in the state, serving an average of about 1,800 students per school. While California’s high school students are an incredibly diverse mix of individuals, they can be grouped into three basic populations: students who drop out before graduating, students who graduate having passed the courses needed to establish eligibility for admission to the state’s four-year universities, and students who graduate without qualifying for a public university in California. Our report uses these three groups to better understand the problems high schools face and identify potential approaches to addressing them.
High Schools Address a Wide Range of Achievement
Students begin high school with very different levels of achievement. Figure 1 (see next page) displays the percentage of eighth grade students scoring in the five proficiency levels on the Standardized Testing and Reporting (STAR) English Language Arts test. About one-third of students score in the top two levels-proficient and advanced. About the same proportion scores in the basic category and in the bottom two levels combined-below basic and far below basic. Since the state’s goal is for all students to score in the proficient or advanced levels, Figure 1 shows that about two-thirds of eighth grade students are failing to meet this goal.
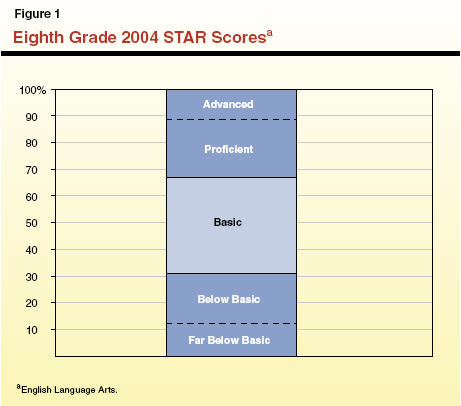
It is important to understand the significance of these data. Since 12.5 percent of high school graduates are eligible for admission into the University of California (UC), the 11 percent of students scoring in the advanced level are scoring at levels roughly consistent with UC’s admission standards. At the other end of the performance scale, about 12 percent-roughly 60,000 students-scored far below basic. Scores at this level are equivalent to randomly guessing at the answers to test questions. The difference between the advanced and far below basic levels, therefore, represents a major achievement gap. (For the remainder of the report, we simplify the STAR testing data by consolidating the top two STAR performance levels into “above basic” and the bottom two levels into “below basic.”)
The STAR data also reveal that most high schools must wrestle with the problem of developing curricula that are appropriate for a wide range of student achievement. In the next section, we briefly review what happens to eighth grade students during the high school years and after graduation.
Achievement During High School
The real test for high schools is not where students start in ninth grade but the improvement made while in high school. One way of measuring this “value added” is by examining the progress of the same group of students over time. Figure 2 shows the STAR scores in grades 8 through 11 for the cohort of students who were in eleventh grade in 2003‑04 (that is, the eighth grade scores are from 2000‑01, the ninth grade scores are from 2001‑02, and so on). As the figure shows, there is very little change over time in the proportion of students scoring in the three levels.
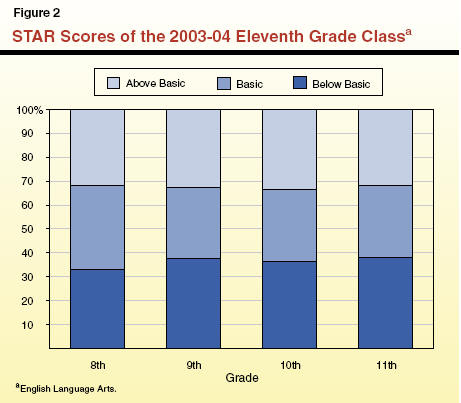
In fact, this figure may overstate the achievement of this cohort of students because it does not account for students who dropped out during high school. Since low-achieving students are more likely to drop out of school, we would expect the remaining students to be higher performing. They are not. Therefore, the data suggest that, relative to state standards, student achievement may be falling during high school.
Another way to evaluate the success of high schools is to look at measures like graduation rates and college attendance rates of recent graduates. By combining data on these two measures, it becomes clear there are three basic outcomes for high school students: failing to graduate (dropouts), graduating and qualifying for admission to UC or the California State University (CSU) (which we will call the “university track”), and graduating without qualifying for a four-year university (which we will call the “general track”).
We have focused this report around these three groups for several reasons. Graduation and continuing on to college represent widely accepted successes for high schools. By focusing on student outcomes, we can more readily identify issues that create barriers to success. In addition, students in the three groups generally face very different problems in high school. Understanding these problems provides a picture of the breadth of challenges high schools face. Finally, all high school students are in one of the groups.
By combining several sources of data, we can track these three groups over the four years of high school. Figure 3 (see next page) displays our estimate of the composition of each high school grade. In ninth grade, students who will eventually drop out represent just under 30 percent of the students in the class. As this group leaves school over the four years, it represents a declining proportion of the class. Since this group does not graduate with the class, it disappears entirely from the “graduation” bar in the figure.
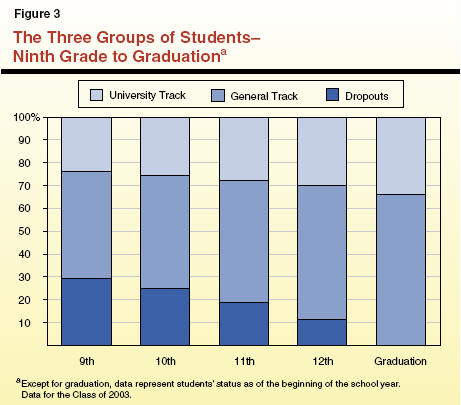
The figure shows that, upon graduation, the university track accounts for one-third of students who remain in school. As a proportion of entering ninth graders, however, the university track comprises only one-fourth of all students. As students in the class drop out of school, this group represents a larger proportion of the remaining students.
The general track contains the largest proportion of students. In ninth grade, almost one-half-47 percent-of all students are included in the general track. As with the university track, this group stays in school and represents an increasing proportion of remaining students over the years. By graduation, the general track accounts for two-thirds of students.
College Attendance by Students in the Three Tracks
Figure 4 conveys a sense of the postsecondary education outcomes for high school students. The left-hand column illustrates the proportion of ninth graders in each of our three groups (the university and general tracks and dropouts). The right-hand column displays the proportion of students who enroll in four-year universities (UC, CSU, and private colleges and universities) and two-year colleges (the California Community Colleges [CCC]) after graduation. As the figure indicates, 45 percent of students attend college after high school-17 percent enroll in four-year institutions and 28 percent attend community colleges. The other 55 percent of students do not attend college in the first two years after graduation-although they may return later in their adult lives.
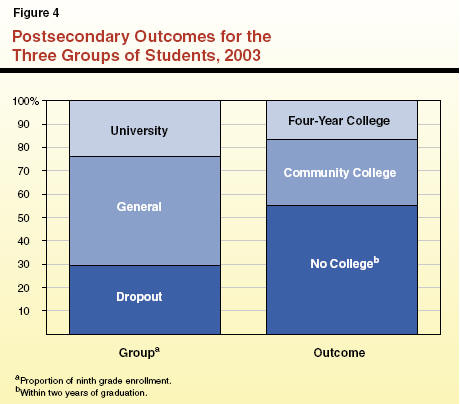
Figure 4 also provides a sense of what happens to students in the three groups immediately after high school. Assuming all students in the university track go to college after graduation, about 70 percent of this group attends four-year colleges and about 30 percent attends CCC or attend college in another state. Figure 4 also suggests that a significant proportion-about 40 percent-of the general track enrolls in CCC. The remainder of the general track and dropouts do not enroll in college.
Unemployment Rates of Students in the Three Groups
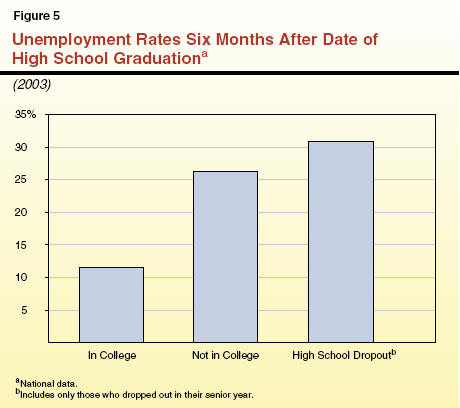
Most of the 55 percent of students who do not attend college after graduation enter the labor force. Unemployment data suggest a difficult transition to the labor market for many of these students. Figure 5 displays national data on the unemployment rates of students six months after they graduated (or would have graduated if they had not dropped out of school). A total of 19 percent of recent graduates were unemployed, which is defined as actively seeking work, but unable to find a job. For graduates enrolled in college, 12 percent were unemployed. For graduates who were not in college and for students who dropped out during their senior year, unemployment rates were significantly higher-26 percent and 31 percent respectively. These figures do not include “discouraged workers,” who are not employed but have given up looking for a job.
Adult unemployment rates also decline as education increases. California’s unemployment rates reflect this trend. For example, in April 2004, 8.3 percent of adults with a high school diploma reported being unemployed. This compares to 5.3 percent for adults with a two-year CCC degree and 4.3 percent for adults with a four-year college diploma.
The data suggest that students who are not preparing for entrance into college experience greater problems in the labor market. Students who enter the full-time labor force have a harder time finding jobs after their high school years and experience higher unemployment rates as adults.
High schools in California face a significant challenge in helping all students experience success. Data provide mixed evidence on whether the state’s schools meet this challenge. Relative levels of student achievement do not seem to improve from eighth to eleventh grade. Students continue to learn, but high schools do not appear to make progress in accelerating the achievement of lower-performing students. On the contrary, the data suggest that student achievement is not keeping up with the pace dictated by state performance standards.
Other outcome data also indicate a mixed picture. Almost 30 percent of students who start high school do not graduate. Dropouts and high school graduates that do not continue on to college also experience a rough transition to the labor force. As we discuss later in this report, even our most successful students-those who attend college immediately after graduation-are not fully prepared for college-level work.
Later in this report, we examine the experience of these three groups in more detail. In the next chapter, we explore the state’s policies that influence the structure of high schools.
Chapter 2
State law affects the design and operation of high schools in many ways, large and small. Remedial instruction funding, for instance, provides supplemental support for classes that take place outside of the school day. Truancy mandates require schools to follow specific procedures as part of local attendance programs. Funding for alternative programs, such as continuation or community day schools, influence the settings districts employ for educating certain groups of students.
In this section, we review five key state policies that shape the course offerings of high schools and measure the amount students learn in school. These laws also define the skills students need to graduate and qualify for admission into the state’s four-year universities. Together, we believe these five policies exert the most significant influence over the operation of high schools.
These policies can be grouped into two categories. The first group includes state laws or programs that structure student choices over the courses they take in high school. This includes high school graduation and university admission course requirements. Also in this group are state-funded Regional Occupational Centers and Programs (ROC/Ps), which provide vocational education courses to students beginning in their junior year. Graduation and university course requirements affect student demand for certain courses while ROC/Ps increase the supply of vocational courses available to students.
The second group consists of two state testing programs, which also exert great influence over high schools. The STAR establishes performance standards for core academic programs, providing feedback about whether students learn the material in these courses. The California High School Exit Examination (CAHSEE) assesses whether students have attained a level of achievement in mathematics and English the state has deemed necessary for all high school graduates.
The two sets of state course requirements play a central role in what students study in high school. Figure 6 displays the specific requirements for high school graduation and for admission into a public four-year university in California. Enacted in 1983, the graduation requirements help ensure all high school students take a minimum number of academic courses prior to graduation. As the figure shows, students must take over a dozen year-long courses to meet this state requirement.
|
Figure 6 High School Course Requirements for Graduation and University Admissions |
||
|
(Number of Annual Courses) |
||
|
|
Graduation |
UC/CSU
|
|
English |
3.0 |
4.0 |
|
Mathematics |
2.0 |
3.0 |
|
Science |
2.0 |
2.0 |
|
History/social science |
3.0 |
2.0 |
|
Foreign language |
1.0a |
2.0 |
|
Art |
1.0a |
1.0 |
|
Physical education |
1.0 |
— |
|
Other |
0.5 |
1.0 |
|
Totals |
12.5 |
15.0 |
|
|
||
|
a State law calls for one of either art or foreign language courses. |
||
The UC and CSU establish a slightly different set of course requirements that students must take as a prerequisite for admission into the four-year university systems. These requirements are known as the “A through G” requirements. The admissions requirement calls for students to take a minimum of 15 year-long courses during high school. In some subjects, students must take specific courses-such as Algebra II in mathematics-to meet the university requirements.
Meeting both the graduation and A through G requirements requires students to take 17 specific courses. (In most subject areas, the A through G requirements call for more courses. In history and physical education, however, the graduation requirements are higher.) In addition, both UC and CSU encourage students to continue taking high-level courses in their senior year. Students who follow this advice by taking courses in all four core areas would use 20 of the 24 high school courses typically available during four years to meet state course requirements.
All high school courses in the subject areas identified for university admissions do not necessarily qualify as meeting the A through G requirements. The UC must specifically approve each high school course that counts toward these requirements. In contrast, districts determine which courses satisfy the graduation requirements, with two exceptions. State law requires one science course to be a laboratory science and students must take algebra as one mathematics course.
The A through G requirements also are important because they create a roadmap-a sequence of courses that, when completed, make a student eligible to apply for admission to a four-year public university in California. By developing the A through G requirements, the universities have helped students and parents understand how to use high school to prepare for UC or CSU.
Vocational Options Through ROC/Ps
Another way the state affects course offerings is through the establishment and support of ROC/Ps. As the name suggests, these agencies provide regional support for vocational education, primarily through county offices of education. In urban counties, ROC/Ps are sometimes administered by consortia of school districts (known as “joint powers agencies”) or very large districts. The 2004‑05 Budget Act includes almost $400 million for the support of ROC/Ps.
The ROC/Ps were established in the 1960s to take advantage of economies of scale that were unavailable to most high school vocational programs. Vocational classes often require specialized instructors and equipment. By attracting students from a larger region, ROC/Ps are able to generate the enrollment in vocational classes needed to finance the higher cost of these programs.
Figure 7 displays the statutory missions of ROC/Ps. Most importantly, state law requires ROC/Ps to help students gain entrance into entry-level occupations. As these jobs typically do not require extensive training, the course structure of ROC/Ps focuses on individual classes. Some ROC/Ps also offer course sequences that help students achieve higher-level job skills or gain entry into advanced community college courses.
|
Figure 7 The Mission of ROC/Ps |
|
|
|
|
|
� |
Allow students to learn entry-level occupations. |
|
� |
Ensure skills are in demand by local employers. |
|
� |
Provide guidance and counseling on vocational matters. |
|
� |
Give priority to students 16 to 18 years old. |
State law also places a priority for ROC/Ps to serve high school students age 16 through 18. Because of this priority, ROC/P classes are targeted mainly at juniors and seniors. State law allows ROC/Ps to serve adults, as well. In 2003‑04, about two-thirds of all ROC/P enrollments were high school students. The proportion of high school students served by individual ROC/Ps, however, varies greatly. While most programs serve only a small percentage of adults, a few programs serve primarily adults.
The High School Exit Examination
In 1999, the Legislature enacted the CAHSEE. This test, which students must pass to graduate from high school, measures student achievement in mathematics and English. Students take the test for the first time in tenth grade. Students who fail either portion of the test may retest up to seven times during the subsequent two years. The test assesses student mastery of the state mathematics standards up to and including algebra and the tenth grade English Language Arts standards.
The class of 2006 is the first to be subject to the CAHSEE requirement. Students in this class took the test for the first time in spring 2004. Almost three-quarters passed each of the subject areas. About 60 percent of low-income students passed at least one of the two portions of the test on their first attempt. Passing rates of English learner (EL) students and special education students were significantly lower.
As discussed above, the Legislature enacted high school graduation course requirements to increase the number of academic courses taken by high school students. The CAHSEE represents another way of improving academic performance. Rather than specifying the number of courses students take, the CAHSEE establishes performance-based criteria for graduation. For instance, it requires that students demonstrate a specific level of mathematical competency in arithmetic and algebra.
As an accountability measure, the CAHSEE significantly affects students and schools. The CAHSEE has increased the academic focus of high school for many students. While high-performing students generally find the CAHSEE standards relatively easy to meet, the test has increased academic expectations for lower-performing students. As a result, more students are taking algebra than before the test requirement was enacted.
In addition, the CAHSEE creates new incentives for schools to boost student achievement. Scores from the CAHSEE are used as the accountability measure for high schools under the federal No Child Left Behind (NCLB) Act. Because the law creates consequences for failing to meet performance targets, high schools are motivated to improve student performance on the test.
Finally, graduating from high school is very important for parents and students. Failing to pass the CAHSEE prevents a student (beginning in 2006) from graduating. As a result, high schools are under significant pressure to help students pass the test. In response, schools have developed remedial courses to help students master the skills needed to pass the test.
State Content Standards and the STAR Tests
In 1997, the Legislature enacted the STAR program. As part of that effort, the Legislature required the development of course content standards that would guide the development of the STAR tests. Beginning in 2000, STAR began to include tests aligned with the state’s content standards. By 2002, STAR included tests for standards-aligned courses in English, history, science, and mathematics in grades 9 through 11 (see Figure 8).
|
Figure 8 High School Courses Assessed by the STAR Program |
|
|
|
|
|
English |
Grades 9 through 11. |
|
Mathematics |
General mathematics, Algebra I, geometry, and Algebra II. Students taking mathematics courses above the level of Algebra II take a “summative” test covering both algebra courses and geometry. |
|
Science |
Earth science, biology, chemistry, and physics. |
|
History/social sciences |
Grades 10 and 11. |
Students generally take a STAR test only after they complete a course that covers the state standards. The English and history tests reflect the grade-level orientation of the state standards in these subjects. The tests in mathematics and science, however, align with specific content areas within the subjects. Students take a “summative” test when they complete mathematics courses beyond the Algebra II level.
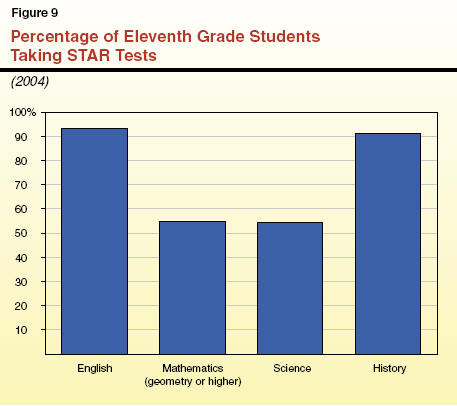
The 2002‑03 STAR results reveal that almost all students take the high school English and history tests. This is consistent with the state graduation requirements of three years of English and history courses. A much smaller proportion of students take more advanced mathematics and science classes and the related STAR tests. These are typically students planning to attend college after graduation.
Figure 9 illustrates this situation. The figure displays the proportion of eleventh grade students taking STAR tests in the four content areas in 2004. Over 90 percent of students took the history and English tests. By comparison, only about 55 percent of eleventh graders took an advanced mathematics test (geometry or higher) or one of the four STAR science courses.
Impact of STAR Results on Educators. The STAR results for grades 9 through 11 have mixed performance incentives for educators. On the one hand, since STAR results cannot be used for high school accountability scores under NCLB, few direct consequences result from low STAR scores for most schools and districts. On the other hand, the STAR scores do determine school rankings under the state’s accountability system. Since these rankings are quite visible to the public, local educators want students to do well on the test.
Impact of STAR Results on Students. For most high school students, however, the STAR results have little impact because there are no negative consequences for doing poorly on the test. Test scores are sent to parents for information purposes. Schools, however, may not include STAR scores on student transcripts without permission. As a result, UC and CSU generally do not have access to STAR scores as part of the admissions process.
The state has tried to create incentives for students to do well on STAR. For instance, state law requires districts to use STAR scores to evaluate whether students are ready for promotion from eighth grade to ninth grade. The state also created a merit college scholarship program that was based on STAR scores. (The program was eliminated as part of budget cuts after only two years.) It is not clear whether either program altered student incentives significantly. Unless students are accountable for their performance on STAR, the test will not create incentives for students to work harder and learn more in school.
The state plays a major role in determining what students study each day and the way the state evaluates performance in those classes. Graduation and university course requirements dictate most of the courses students take during high school. University admissions requirements are also important because they create a pathway to a postsecondary goal of many students-attending UC or CSU. State-funded ROC/Ps create a source of occupational-specific training that confer technical skills to students and help them find better jobs after graduation.
The CAHSEE represents a different way to increase the skills of students. By clearly identifying what all students should know to graduate from high school, the test has two potential advantages over the course requirements. First, the test places more responsibility on students for learning the necessary content. So long as the test content represents a realistic challenge for all students, the CAHSEE encourages lower-performing students to work harder to learn the content assessed by the test. Second, the test creates a statewide benchmark for minimum student achievement. Graduation course requirements can be “watered down” at the local level by giving students credit for passing low-level courses. Because the CAHSEE is performance based, the test helps the state maintain a level of rigor to graduation requirements.
Like the CAHSEE, the high school STAR tests reinforce the state’s expectations for academic courses. The STAR, however, has a greater focus on academic courses taken by students who want to go to college. Unlike the CAHSEE, students currently have little stake in performing well on the STAR tests. As a result, the state may be missing an opportunity to use STAR to increase student incentives to work hard in high school.
Using state tests to hold students accountable also creates new obligations for the state. In the case of the exit examination, the class of 2006 must pass the CAHSEE to graduate. As spring 2006 draws near, concern over the passing rates-particularly for special education and EL students-is growing. Previous court cases in other states have required states to show that students who failed a high school graduation test had a reasonable opportunity to learn the material on the test. Otherwise, courts have not allowed states to deny diplomas to students based on the outcome of the examinations. As a result, using the CAHSEE to define what high school graduates need to know also makes the state accountable for ensuring that students receive the instruction they need to learn the material.
In the next three chapters, we explore more thoroughly the issues related to the three groups-dropouts, the general track, and the university track. Using available data and research, we identify problems students in these three groups encounter while in high school and discuss approaches for addressing them. Each chapter ends with our recommendations for legislative action.
Chapter 3
As noted earlier, about 30 percent of California’s entering high school students fail to graduate. In this section, we examine why students drop out and identify promising approaches to reducing dropout rates. Research offers no easy solutions for reducing dropout rates. Nevertheless, the state can take several important steps to focus attention on districts with high dropout rates and support local efforts to reduce dropouts.
It is important to recognize that our estimate of the dropout rate is significantly higher than the rate calculated by the State Department of Education (SDE). For 2002‑03, for instance, SDE’s dropout rate was 12.6 percent. There are several differences between our methodology and SDE’s dropout rate calculation. Most important, the two methodologies count students differently. The SDE calculation is based on the number of high school dropouts reported by districts. Our estimate tracks the number of students reported as enrolled in each grade and the number graduating each year. Since SDE does not require districts to explain why enrollment declines are greater than the reported dropouts, data do not exist to fully understand why reported dropouts are so much lower than suggested by enrollment data. One major reason for the difference, however, is that SDE’s data capture dropouts only through the fall of twelfth grade. As a consequence, the department’s estimate does not reflect students who drop out in the spring semester of their senior year or who complete twelfth grade but fail to graduate. Our measure captures both groups-we estimate this difference accounts for about 9 percentage points of the difference between our estimate and the SDE rate.
We think our methodology results in an estimate that is closer to the actual dropout rate. By counting the actual number of students enrolled in California schools and the number graduating from high school each year, our data reflect the actual decline in participation over the four years in high school. While our estimate may overstate dropouts somewhat-students who move out of the state are included in our dropout rate-we think our methodology develops a much more accurate rate than SDE’s. In the discussion below, therefore, we use our methodology as the best estimate of dropouts. Until the state develops a data system that collects reliable dropout statistics, data issues will hamper California’s ability to assess the size and scope of its dropout problem.
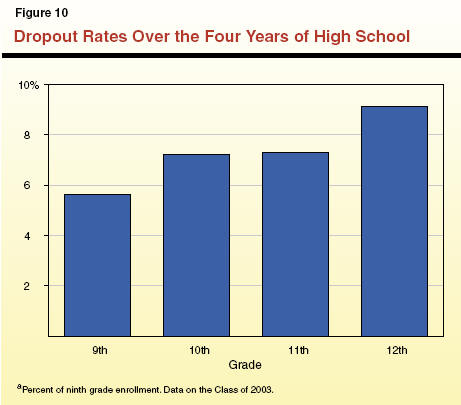
Students drop out at an increasing rate over the four years of high school. Figure 10 shows our estimate of the percent of the 1999‑00 ninth grade class that dropped out each year. For example, 5.6 percent of students dropped out of school during ninth grade, while 9.1 percent of students dropped out during twelfth grade (or did not graduate. Cumulatively, this cohort of students lost about 30 percent of the original class over the four years.
The dropout problem is not uniform across the state. Large urban school districts have higher-sometimes significantly higher-dropout rates than the state average. For example, we estimate dropout rates for the same 1999‑00 ninth grade class for Oakland Unified and Los Angeles Unified School Districts at 50 percent and 55 percent, respectively. San Diego Unified and Long Beach Unified School Districts did considerably better-with dropout rates of about 35 percent-but still exceeded the statewide average.
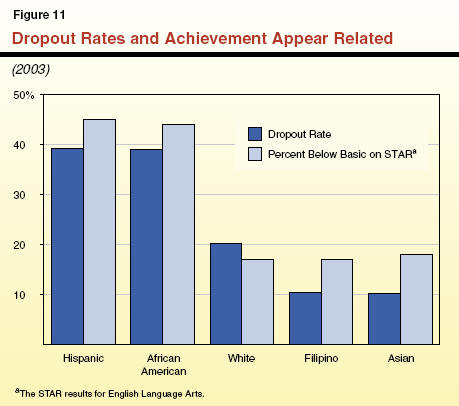
Dropout rates appear highly related to student achievement. Figure 11 displays dropout rates and ninth grade STAR scores for the five largest racial/ethnic groups in California. As the figure shows, dropout rates and the proportion of ninth grade students scoring below basic on STAR for each group is roughly similar. African American and Hispanic students were more likely to score below basic on STAR and were significantly more likely to drop out than most other racial and ethnic groups. While white, Filipino, and Asian students are fared similarly on STAR, white students were twice as likely to drop out as Filipino or Asian students.
Finally, the dropout rate in California has slowly declined over the last five years. We estimate the dropout rate in 1997‑98 at about 33 percent. By 2002‑03, it fell to about 29 percent. This decline suggests that about 20,000 more students graduated in 2002‑03 than if the 1997‑98 rates had applied. In addition, our estimates suggest all the major racial and ethnic groups experienced higher graduation rates over this time period.
A 2004 report by the Urban Institute shows California’s dropout rate was below the national average. This, along with the steady reduction in dropouts over the last five years, provides a hopeful sign that local schools are more effectively addressing the needs of students at risk of dropping out. In the next section, we summarize existing research on the source of the dropout problem.
Dropouts-A Consequence of Disengagement
The National Research Council (NRC) issued a report in 2004 on the problems of urban schools, including low achievement and school dropouts. The report, which synthesizes available research on these topics, describes dropping out as “the ultimate” in student disengagement. “Dropping out of high school is for many students the last step in a long process through which students become disengaged from school.”
Engagement is a mix of attributes that result in a dedication to learning and a belief in the value of school. Figure 12 displays the major attributes of an engaged student. Another way to describe an engaged student is “self-motivated.” Ideally, engaged students are absorbed in the learning process because they find the material interesting. When disengagement becomes advanced, however, frustration and alienation can result in increased absenteeism and behavior problems and, eventually, dropping out.
|
Figure 12 Attributes of Engaged Students |
|||
|
|
|||
|
� |
Enthusiasm |
� |
Active participation |
|
� |
Interest |
� |
Completing work |
|
� |
Pride in success |
� |
Seeking assistance when needed |
|
� |
Social involvement |
� |
Taking challenging classes |
The NRC report finds that the seeds of disengagement usually are planted long before high school. Years of poor performance in elementary and middle schools can lead students to conclude that “school is not for them.” This leads to low expectations for their own success in school and, consequently, low effort-a vicious circle of sorts that results in declining achievement.
Research also suggests that student educational and occupational aspirations are good predictors of dropping out. Enthusiasm for school can wane when students do not see a connection between their course of study and their post-high school goals. This may occur because there is no connection or because students are ill-informed about the steps needed to reach their goals.
The problem of disengagement in high school is not restricted to dropouts. The NRC report cites studies finding that 40 percent to 60 percent of all high school students studied were “chronically” disengaged. This finding is reinforced by several surveys of high school students we reviewed. For instance, a survey of students in Colorado found that 65 percent of students reported they were bored in school at least half of the time. The NRC report concludes that, in most high schools, unless students “come with their own intrinsic motivation to learn (or at least to get good grades), they are likely to feel alienated from their teachers and coursework.”
Key Elements of a Dropout Strategy
The NRC report finds no easy solutions to preventing high school dropouts. Evaluations of programs implementing research-based “best practices” show, at best, mixed success. The report points to five key features of programs that successfully reduced dropout rates. These elements are displayed in Figure 13 and discussed in greater detail below.
|
Figure 13 Key Elements for Addressing High School Dropouts |
|
|
|
|
|
An academic push |
A focus on teaching and learning that “does whatever it takes” to increase the academic skills of students. |
|
Early attention to low performance |
Special programs in middle school for “at-risk” students show
promise in |
|
More personalized schools |
More personal, supportive schools create an environment which encourages lower-performing students to engage in school. |
|
A greater range of options |
Giving students and parents greater control over their program make school more aligned with student goals. |
|
Parental involvement |
Parents must be partners with schools in keeping students on track. |
An Academic Push. The critical feature of any school is an educational program that is committed to doing whatever it takes to help all students achieve. The NRC report defines this as giving all students what they need to learn, holding them accountable, and providing extra assistance when needed. This focus on success sometimes requires changing teachers’ instructional approaches to educating low-achieving students. Holding students accountable includes consequences for failing to complete required work and strong school attendance and truancy programs.
Without this academic push, it is unlikely the other four components will have a significant impact on dropout rates. Students become less likely to drop out when they begin to have success in school. In this context, the other promising components can be viewed as supporting elements-components that are effective only to the extent they complement an effective instructional program.
Early Attention to Low Performance. Research suggests that disadvantaged low-achieving ninth graders typically do not significantly raise their skill levels by twelfth grade. The NRC report cites one study showing that only 15 percent of students identified as weak readers in eighth grade had progressed to an intermediate or advanced level by twelfth grade. The report concludes that, by eighth grade, most low-achieving students had lost their belief that they could make significant progress in school.
Studies also show that student motivation declines as students move through elementary school to middle and high schools. Thus, it makes sense to address the achievement problem before high school, when students are more engaged and when academic deficits are smaller. Initial research on several middle school intervention programs suggests the approach holds promise. Successful programs established alternative schools for at-risk middle grade students, often with smaller class sizes and additional counseling, to accelerate the progress of at-risk students. By comparison, programs that supplemented existing middle school programs with various services showed almost no impact.
More Personalized Schools. Middle and high schools that successfully reduce dropout rates adopt a more personal approach to educating students than the typical high school. The attributes of this approach include:
A school climate that promotes the belief that all students can learn and feel socially connected with the school.
Smaller schools, where students have more personal interactions with teachers and other adults who can help resolve family or personal problems.
High, but achievable, expectations of student academic achievement.
Research suggests these attributes may be necessary, but not sufficient, elements of successful dropout programs. Several studies we reviewed showed schools successfully implementing this personalized approach while having no impact on dropout rates. These findings reinforce our earlier point about the central importance of an academic push.
A Greater Range of Options. The NRC identifies choices as a critical element in helping students “see some value in the high school curriculum.” Choice involves a range of curricular options-including both academic and vocational paths. The report concludes that “Because few urban schools are closely connected . . . to the educational and career opportunities potentially available to students, many students fail to see how working hard in school will enable them to attain the . . . goals to which they aspire.” By connecting students’ high school programs with their postgraduation goals, schools can increase motivation to learn.
Program options for students are important for a second reason. Choices provide students with a way to be involved in their education. With adult freedom and responsibility on the horizon, high school students feel they should have a voice over their education. By giving students a greater range of curricular options, schools can give students (and their parents) more control-and more responsibility-over what they study in school.
Parental Involvement. While almost all school improvement programs-including programs to reduce dropout rates-stress the importance of parental involvement, we were unable to find evaluations identifying the types of involvement that make a difference with at-risk high school students. Literature on parental involvement at the secondary level, however, suggests that parents play a different role in supporting students than when their children were younger. Unlike elementary students, high school students often do not want parents involved in their day-to-day affairs. As a result, parents must “steer” their children through the challenges, keeping them on task, arranging for extra support when needed, and knowing who their child’s friends are.
The parent’s role is very similar to the list of attributes that describe the “personalized” school. This is no accident. All students need encouragement, support, and, sometimes, externally imposed discipline to keep them on track in school. The research is clear that all students are more successful when they get the same messages from school and home. The NRC report finds that parental involvement declines as children get older and that, by some measures, low-income parents are less involved in their children’s education. As a result, schools need to develop ways to engage parents as partners in this endeavor if they are going to significantly reduce dropout rates.
Implementation Is a Critical Factor. Many districts in California already implement programs that include the elements discussed in this section. Programs like Advancement Via Individual Determination and Gaining Early Awareness and Readiness for Undergraduate Programs are designed to boost the achievement of elementary and middle grade students and prepare them for postsecondary education. A few districts also are creating special programs for eighth and ninth graders who achieve at very low levels to improve their skills prior to taking high school courses. Similarly, districts are developing smaller, more personal high schools that provide greater curricular options to students.
As we cautioned above, however, research shows there is no simple formula for success in reducing dropout rates. An evaluation of reform efforts in ten high schools in Boston, Massachusetts, for instance, showed that, despite implementing the key elements discussed above, only two schools produced higher student achievement among low-income, low-achieving students. The evaluation concluded that the successful schools used the reforms to change the culture of high school and increase student engagement. These changes, along with a “laser-like focus on teaching and learning” resulted in higher achievement.
State Actions to Reduce Dropout Rates
What can the state do at a policy level to reduce dropout rates? Most of the effective elements are outside state control. For instance, the state cannot require all high schools to become “more personalized.” Similarly, the state cannot create a desire within school officials to engage parents in meaningful ways. There are, however, several ways the state can support schools and districts in addressing the problem of dropouts. Figure 14 displays a summary of our recommendations, which we discuss in detail below.
|
Figure 14 State-Level Actions To Reduce Dropout Rates |
|
|
|
|
|
Accountability |
Increase the focus of federal accountability programs on lower-performing students. |
|
Flexibility |
Give
schools more flexibility over |
|
Options |
Assist schools in providing more |
|
Early attention to low performance |
Evaluate the effectiveness of remedial programs and social promotion policies. |
|
Data |
Support the student-level database |
Strengthen Accountability for Low Performance and Dropouts. High dropout rates would seem to be an indicator of an accountability problem. That is, local pressure to reduce the number of dropouts is not sufficiently strong to spur concerted action by educators and school board members. There are, in fact, some disincentives to address the dropout problem. When low-achieving students leave, for instance, average school test scores increase. This gives the appearance that the school is improving, and it allows the school to focus on the education needs of the more motivated students that remain. In addition, when students marked as “problems” or “trouble-makers” drop out, they relieve educators of administrative headaches. As a result, inattention to the needs of these types of students can actually make schools appear more successful.
State and federal accountability programs attempt to address these negative local incentives by including graduation rates as a performance measure. The state’s implementation of these programs, however, results in only weak district incentives to improve dropout rates. In addition, implementation decisions by the State Board of Education (SBE) created mixed messages about the importance of raising the achievement of low-performing students, who are at greatest risk of dropping out. To correct these problems, we recommend the Legislature direct SBE to make two changes to the state plan for implementing the federal accountability programs under NCLB. We discuss these changes below.
Refocus NCLB on Helping Low-Performing Students
We recommend the Legislature require SBE to reset NCLB performance levels in order to encourage school districts to focus on the needs of students who are at risk of dropping out of school.
The federal NCLB requires all schools and districts to ensure that a minimum percentage of students achieve at or above a proficient level of performance. This minimum percentage increases each year until, in the year 2014, NCLB decrees that all students must be at the proficient level. Districts and schools that fail to meet these targets two years in a row enter Program Improvement, where they are subject to a variety of sanctions.
Under NCLB, states cannot change these elements of the accountability system. Federal law, however, leaves to states one key decision that significantly shapes the impact of NCLB accountability on schools and districts-the definition of the proficient level of performance. In general, where states set this performance “bar” has a major influence on the incentives created to encourage schools to focus on the needs of low-performing students-those who are most likely to drop out of school.
In 2003, SBE established a high bar for NCLB accountability. Specifically, it set the NCLB achievement targets for grades 2 through 8 at the STAR proficient level. Because the state uses the CAHSEE as its NCLB indicator for high school, it set a CAHSEE target that was equivalent to the STAR proficient level. This high school NCLB target is significantly higher than the score needed to pass the CAHSEE. Only about one third of students currently achieve at the STAR proficient level-thus, the performance bar is set roughly equal to the achievement level of the state’s university track students.
A high NCLB standard has the practical effect of reducing a school’s incentives to attend to the educational needs of students who are likely to drop out. Under NCLB, schools receive credit for helping students improve their performance only when they score at the proficient level. This design encourages schools to focus on the needs of students who scored just below the bar in the previous year, as they are the students who most likely could achieve proficiency the next time around with some improvement. By setting the bar at the STAR proficient level, therefore, the board focused schools on giving extra help to students who previously scored in the STAR basic level.
We believe that the NCLB performance standard should be reset to encourage schools to focus on the needs of students who are at risk of dropping out. For example, using the passing score of the CAHSEE as the performance bar would have several positive effects. First, it would align minimum student expectations for graduation with the federal accountability program. With the existing high NCLB standard, high schools face conflicting incentives. They are under great pressure to help students pass the CAHSEE so they can graduate from high school. Under NCLB, however, high schools receive no credit for helping more students pass the test-they only get NCLB credit when they help students earn the higher NCLB score on the CAHSEE. Given limited resources, which group of students should schools emphasize-students who need help to pass the CAHSEE or students who, with help, can earn the NCLB score on the CAHSEE? By aligning federal accountability standards with the CAHSEE passing score, the Legislature would relieve high schools from this dilemma.
Second, resetting the NCLB standard also would increase incentives for elementary and middle schools to provide extra help to students who are at risk of dropping out. Providing early help to low-performing students holds promise for reducing dropout rates. The existing high bar, however, encourages schools to focus on the needs of students scoring in the STAR basic level, who are less likely to drop out in high school. By lowering the NCLB standard, the state would encourage schools to increase efforts to raise the achievement of low-performing students before their academic deficiencies reach a critical stage.
Third, changing the bar would help schools and districts successfully adjust to NCLB accountability. Where the bar is set establishes the size of the student population that needs to improve. Under the current definition, two-thirds of students are achieving at levels below the performance standard. By resetting the bar, the Legislature would reduce the size of the population that is “underperforming” and send a signal that the state’s goal under NCLB is raising achievement levels of the lowest-performing students. For schools and districts with few low-performing students, this new focus may help them succeed under NCLB accountability. (It remains a question whether schools and districts with larger proportions of low-performing students can succeed under NCLB even with lower performance expectations.)
For the above reasons, the existing policy undercuts incentives to address the needs of students who are likely to drop out of school. To address this problem, we recommend the Legislature enact legislation requiring SBE to set NCLB performance standards at a level consistent with passing the CAHSEE. This would align the state and federal accountability systems, and send a stronger message to schools and districts about the importance of addressing the needs of students at risk of dropping out.
Our recommendation would establish accountability standards similar to those used in other states. The accountability features under the federal act were modeled after Texas’ accountability program from the 1980s and 1990s. Texas began with modest performance expectations for students. As schools helped all students achieve these performance goals, however, the state raised its standard. Over time, the state was able to improve minimum student achievement levels. Currently, Texas maintains a relatively low performance bar under the federal accountability program-more than 80 percent of students in Texas meet the state’s definition of proficient under NCLB.
Strengthen Accountability for Dropouts as Data Improve
We recommend the Legislature require SDE to collect student-level data on graduation rates beginning in 2007 as a means of including dropout data on the state’s Academic Performance Index (API).
Both the state and federal accountability programs attempt to increase local responsibility for dropouts. State law calls for including dropout rates in the API. Federal law requires states to hold districts accountable for graduation rates. To date, dropout rates have not been included in the API due to concerns about the accuracy of the dropout data.
Graduation rates have been included as part of the federal accountability system. The SBE approved a two-part test for determining whether schools and districts make adequate progress on increasing graduation rates (or reducing dropout rates). Specifically, schools or districts can show adequate progress by:
Maintaining a graduation rate of at least 82.8 percent. According to SDE, 20 percent of high schools reported a lower graduation rate in 2003. Schools and districts graduating a lower proportion of students can still demonstrate adequate progress by meeting the second test.
Increasing the graduation rate by 0.1 percent over the previous year’s rate (or by 0.2 percent over the previous two years).
These accountability provisions create fairly weak incentives for schools and districts to focus on reducing the level of dropouts. In 2004, for instance, SDE reports that about 10 percent of all high schools did not demonstrate adequate progress based on these criteria-and only 3 percent failed to make adequate progress due solely to the graduation rate requirement.
New Data System Offers Better Graduation Data. The current graduation and dropout data are problematic, and it is difficult to base strong accountability requirements when the data are so weak. In two years, however, the state will have much better data to calculate dropout and graduation rates. This is because of the implementation of the California Longitudinal Pupil Achievement Data System (CALPADS). The CALPADS will store longitudinal state assessment data on all K-12 students. To collect data on students as they move to different districts over time, the state assigns each student a unique identifier. Beginning in 2006, the student identifier will be included on all students’ state test results.
We think the state should begin using the longitudinal testing data to calculate graduation and dropout rates for high schools and districts as soon as possible. Based on SDE’s existing methodology, the state would have to wait until 2010 to determine these rates using the CALPADS data. Because SDE’s rates measure dropout and graduation rates for each cohort of students, its methodology requires collecting dropout data over four consecutive years and graduation rates after the cohort of students would normally graduate.
Rather than follow a class of students from ninth grade through graduation, however, the state could calculate dropout rates beginning in 2007 by identifying the number of students that drop out in each grade between two consecutive years. Specifically, the state could measure dropouts by identifying the number of students who took the ninth grade STAR test in 2006 but who were not reported as enrolled in school for the tenth grade STAR test in 2007. (The STAR program collects data on all students enrolled at the time of testing-not just those who take the tests.)
With the student identifiers in place, the state would lack only one piece of data needed to develop graduation rates-a list of students (with their identifier number) that graduate in 2007. Just as the state collects data on all enrolled students in grades 2 through 11 as part of STAR, the state could request districts supply the state with similar data on each year’s graduates. Obtaining dropout and graduation data through STAR would allow SDE to discontinue its current collection of these data. As a result, the Legislature may be able to implement this change with little or no additional cost.
To improve the accuracy of dropout and graduation data, therefore, we recommend the Legislature require SDE to begin collecting student-level data on high school graduates, including each student’s unique identifier number. The requirement would begin with the class of 2007. We also recommend the Legislature require SDE to report to the fiscal and policy committees on the options for adding the improved dropout data to the API and for strengthening local accountability for graduation under NCLB. This would provide the Legislature with information needed to monitor the implementation of including dropout and graduation rates in the state and federal accountability programs. We recommend requiring this report by January 1, 2006.
Increase Flexibility Over the Use of State Resources
We recommend the Legislature extend the consolidation of categorical programs initiated in the 2003‑04 legislative session and give schools and districts greater flexibility to address the needs of students at risk of dropping out.
In 2004, the state enacted Chapter 871 (AB 825, Firebaugh), which consolidated eight categorical programs into a “pupil retention block grant.” Included in the block grant are funds for continuation schools, opportunity classes, and tenth grade counseling. Research on alternative programs suggests that students are more likely to drop out of alternative schools than if they had remained in their regular high school. By consolidating these funds, therefore, the act gives schools significantly greater flexibility to use funds in ways that reduce dropout rates.
Most of the resources that support educational services for low-performing students, however, were not included in the consolidation. The 2004‑05 Budget Act provides more than $1.2 billion in additional resources for helping low-achieving students through the state Economic Impact Aid (EIA) and Targeted Instruction Improvement Grants programs. Districts also receive smaller amounts of funds for services affecting this population through a variety of small programs. For example, districts spend about $21 million each year to notify and meet with parents of truant students through two state-mandated local programs.
Each of these programs comes with various requirements and prohibitions on the use of funds locally. The EIA funds, for example, must supplement the educational program for those students identified as eligible for program services. Remedial instruction funding can be used to supplement a student’s educational program outside of the regular school day or school year. These rules were designed to prevent districts from using these supplemental funds for base program expenses such as teacher salaries, textbooks, or utilities.
As discussed above, research suggests that supplemental services are not the most effective way to increase achievement and reduce dropouts. Schools must build the school’s program and culture around the goal of helping all students achieve. Schools that attempt such a change can find the categorical rules difficult to accommodate. For example, the EIA requirement to use program resources for supplemental services limits principals’ ability to use funds as part of the school reform effort. Similarly, state truancy mandates limit schools’ responses to the problem.
While the changes in AB 825 provide a good start, we recommend the Legislature extend the reforms in a way that increases local flexibility and accountability for improving student performance and increasing graduation rates. We have recommended in past years that the Legislature restructure these programs and increase local accountability for achieving the goals of these programs. By grouping the major categorical programs into block grants, the Legislature could significantly reduce the restrictions on local use of the funds and address inequities in existing funding formulas. By highlighting the effectiveness with which districts use these supplemental funds, our accountability provisions also would stress the Legislature’s concern with the problems of low achievement and dropouts. We continue to believe in this approach. (Please see our 2002‑03 and 2003‑04 Analysis of the Budget Bill, beginning at page E-77 and E-43, respectively, for more detail.)
Encourage More Curricular Choices for Students
Currently, the only state-developed path to a postsecondary goal that is available to all students is the A through G requirements, which are required for admission to a four-year public university in California. To satisfy these requirements, most students must carefully plan their four years in high school. The majority of high school students suffer from the lack of similar paths that help them achieve their post-high school goals. Since less than a one-quarter of students who enroll in ninth grade satisfy the A through G requirements upon graduation, the remaining students must find ways to connect school to their postgraduation goals without clearly defined course sequences to assist them.
In the next chapter, we recommend the Legislature take a series of actions to help schools develop a variety of curricular options for students and help students and parents make informed decisions about their choice of programs. Our goal is encouraging schools to create academic and vocational programs that respond to the interests and needs of students. Our proposal also would require districts to provide academic and career counseling to help students and their parents make informed choices about their high school plan. This means providing assistance in refining each student’s long-term goals, fully understanding the high school options available, and gauging the likelihood of success in their choice.
We think these recommendations would help all students-and particularly students at risk of dropping out-use high school as effectively as possible to work toward their goals in adult life. Please see our recommendations in the next chapter of this report.
Evaluate the Effectiveness of Remedial Programs
We recommend the Legislature direct SDE to develop a proposal to evaluate remedial education programs and state “social promotion” policies.
An obvious solution to improving achievement and reducing dropouts in high school is to reduce the number of low-performing students entering ninth grade. Several state policies encourage districts to address low achievement in elementary and middle schools. We think the state should dedicate a modest amount of funds to evaluate the effectiveness of two of these policies in addressing low achievement-funding for supplemental instruction and state social promotion mandates.
Supplemental instruction programs reimburse districts for each hour of additional class time that is provided to students outside of the regular school day. The state’s funding rate assumes a student-teacher ratio of about 30 to 1, which is identical to the formula used to pay for summer school programs. We think it is likely that this level of resources does not provide adequate support for effective remedial instruction programs-addressing the academic deficiencies of low-performing students may require a lower student-teacher ratio. Unfortunately, we were unable to locate any studies on the subject of effective remedial approaches.
The Legislature also enacted social promotion policies in the mid-1990s, which require districts to establish policies for identifying students who need additional help before moving up to the next grade. Students who are not achieving at the minimum level identified by the district for promotion to the next grade must receive supplemental instruction. As a result, the promotion mandates work in tandem with the supplemental instruction programs.
The state has never evaluated the promotion program. Given the lack of significant improvement shown by low-performing students in the elementary and middle grades, STAR data suggest that most district social promotion and remedial education programs are relatively ineffective. Evaluating the local implementation of these policies, however, may help the state identify local practices for identifying and serving low-achieving elementary and middle grade students who are successful in raising achievement. In addition, the state could evaluate whether programs tailored for specific subgroups of students yield better results than programs that attempt to include students with a variety of educational needs.
Therefore, we recommend the Legislature direct SDE to develop a proposed design for this evaluation. The Legislature could review this proposal to ensure it accomplishes its goals in evaluating these programs and to determine the amount to appropriate in the annual budget act. Based on past evaluations, we think this evaluation would cost about $400,000 and could be supported with federal funds.
Conclusion
The state plays a critical role in focusing attention on the problem of high school dropouts and giving educators better ways to address the problem. Our recommendations would strengthen existing accountability programs, improve information available to parents and educators, and increase options available to students. In the next chapter, we examine the curricular options available to high school students and discuss specific steps to increase the choices available to students.
Chapter 4
In this chapter, we take a closer look at the problems faced by students who graduate from high school but do not satisfy the minimum course requirements for entry into UC or CSU. This group constitutes just under one-half the entering ninth grade class and two-thirds of high school graduates. The general track follows two main paths after high school-continued education in community college or employment. Our review of research and data show that this group suffers from some of the same problems that affect dropouts-high schools often are not organized to help students connect their schooling to their post-high school goals.
High Aspirations, Performance Below Standards
As discussed earlier, data currently are not available to directly measure the performance of students over time. By combining data from different sources and making several key assumptions, however, we can paint a rough picture of the achievement and post-high school aspirations of students in the general track. This analysis suggests that most general track students perform somewhat below state standards in high school.
A significant proportion of students in the general track want to go to college. The postsecondary aspirations of this group, however, far exceed their readiness for college. The mismatch between the performance and aspirations of general track students has important implications for the success of this group after graduation.
Most Students Want to Attend College
The general track contains students with a wide range of ability and achievement. For the most part, however, general track students score in the basic level on STAR. As discussed earlier in the report, the data also suggest STAR scores for this group decline somewhat in eleventh grade. We view this decline as an indicator of falling student motivation.
Most general track students also begin high school with the goal of enrolling in college. Figure 15 shows survey results taken at the time students took the CAHSEE in 2002‑03. The survey includes virtually all tenth grade students plus eleventh grade students who did not pass the test the previous year. We modified the tenth grade data by subtracting the proportion of students in our university track from the percentage of students in the survey aspiring to a four-year college.
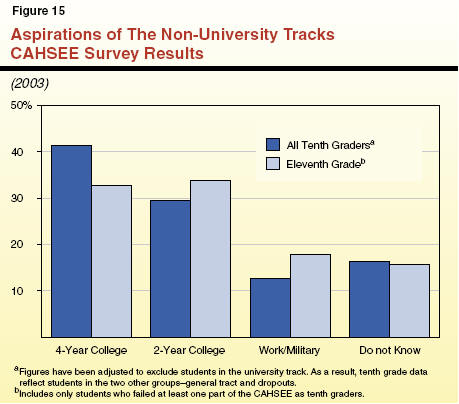
As a result, data shown for tenth grade students represent the aspirations of students in the general track and those who will eventually drop out of school. As the figure shows, 71 percent of these tenth graders want to enroll in college-41 percent in a four-year university and 30 percent in a community college or technical school. Only 12 percent of students plan to work or enter the military upon graduation.
The aspirations of eleventh grade students who failed the CAHSEE on the first attempt are very similar to those of the nonuniversity track tenth graders. We estimate that about one-half of students in the general track took a CAHSEE test in eleventh grade. Despite having failed at least one part of the CAHSEE, about one-third of the group hopes to enroll in a university. Another one-third plans on attending a community college. Only 18 percent plan on working after graduation.
What actually happens to students suggests these aspirations are unrealistic. About 40 percent of the general track will go on to community college-far fewer than the 70 percent who plan to go to a four-year university or community college. Similarly, roughly 60 percent of this group will go directly to work after graduation-far more than the 12 percent to 18 percent reported in the CAHSEE survey.
The fact that so many students do not realize their postsecondary education goals immediately after college suggests these aspirations often represent vague hopes rather than firm plans. How can high school students get so close to graduation without a more realistic picture of their options after graduation? As we will see in the next section, the experience of high school graduates who enroll in a community college indicates that even students who make it to college often do not understand what it takes to reach their postsecondary goals or realistically assess their chances for success in college. Together, the CAHSEE survey data and the community college experiences of graduates suggest a wide swath of high school students have only vague ideas about how to use their high school years to achieve their postgraduation goals.
Many Students Unprepared for College
About 150,000 recent high school graduates (ages 18 or 19) enroll in CCC each fall. This represents two-thirds of students who enroll in postsecondary education after high school. Most of these students did not satisfy the A though G requirements in high school, and are part of our general track of students. Only about one-third of enrolling CCC students successfully complete a CCC course of study. Within six years of enrolling, about 25 percent transfer to one of the public universities and another 7 percent receive a two-year academic or vocational certificate or degree but do not transfer to a four-year institution.
Low motivation and poor preparation lie at the foundation of these low success rates. For instance, our review of CCC data reveals that:
A Significant Proportion of High School Graduates Drop Out of Community College After Only One Semester. Almost one-half of recent graduates enrolling in a community college attend on a part-time basis. Of this group, 40 percent fail to return the next semester.
More Than 40 Percent of Recent Graduates in CCC Need Basic Skills Remedial Courses. State-required placement tests show that recent high school graduates enrolling in CCC need to repeat high school courses in basic English reading and writing (at least two levels below the transfer freshman composition course) and mathematics (below Algebra I).
Many College Students Are Still Unclear About the Role of Education in Their Lives. About 25 percent of recent high school graduates begin community college with no declared goal for what they want to achieve in college even though the CCC course planning process encourages students to design their schedules according to their personal goals.
These data suggest that a significant proportion of recent high school graduates who enroll in community college are simply not ready for college. These students do not have the motivation and/or academic skills needed to succeed in college. Many arrive at college without a clear picture of what they hope to accomplish while in school. A community college instructor quoted in a 2003 report by Policy Analysis for California Education (PACE) on the transition from high school to community college commented:
For some students, the first year of community college is grade 13. It seems that they are just continuing on-all of their friends are coming here, they are just moving along with the pack. There’s not even necessarily (for some of the first-year students) an acknowledgement . . . that this is even college.
Students Need Better Information About College
Recent studies suggest these problems result from the failure in high school to give students information that would help them answer two key questions: (1) what level of achievement in high school is needed for success in college and (2) how does each student’s high school record compare to the standard for success in college? Studies we reviewed found that:
Counselors Often Recommend College for Virtually All Students. Research on high school counseling programs found that counselors often “advise college for almost everyone.” Even with lower-performing students, counselors are “reluctant to confront students who had unrealistic expectations regarding college or job plans.”
Students Are Not Aware That High School Achievement May Not Meet CCC Standards. The PACE report on community colleges found that many students were not aware that passing a high school course does not mean a student has met CCC standards. As a consequence, community colleges often require students to repeat basic high school mathematics and English courses. The report concludes that students ”do not understand what is expected of them in college, nor the level of academic preparation required of them to handle college-level work.”
General Track Students Are Unfamiliar With the A Through G Requirements. The PACE study also found that less than one-half of students planning to attend a CCC after graduation were familiar with the A through G requirements. As a result, students interested in transferring from community college to a four-year university may be unaware they must first satisfy the A through G requirements in community college before they can begin taking transfer-level courses.
As we discuss in the next chapter, somewhat better signals have been developed for students who want to attend UC or CSU after high school. The A through G requirements define the precollegiate courses students must pass. Both UC and CSU establish minimum grade point averages for admission, and most students must take the SAT. These requirements have two functions. First, they help the universities identify students who are prepared for higher education. Second, they give students feedback on whether they are achieving at levels consistent with being prepared for college.
No similar signals have been developed for students planning to go to a community college. This has negative consequences for students. As one report concludes: “Students’ failures arise not from barriers inside colleges, but from a failure of colleges, and especially community colleges, to convey clear information about the preparation that high school students need in order to have a strong chance of finishing a degree.”
Payoffs to High School Vocational Education Are Low
Not all students want or need to attend college after high school to reach their career goals. Vocational education is another way schools have tried to help students use high school to reach their long-term goals in the workplace. In this section, we examine the impact of secondary vocational education on wages and the likelihood that a student will attend college. Research indicates that vocational courses at the secondary level do not provide significant benefits to most students. While research indicates that sequences of vocational courses can result in significant wage increases, these sequences have not been implemented with much vigor statewide. As a consequence, existing vocational education courses do not offer students an alternative that helps them find jobs with long-term career possibilities.
Participation in Vocational Education Declining
The participation of high school students in vocational education has been declining for many years. In our 1994 report School-to-Work Transition, we noted a 20 percent reduction in high school student attendance at ROC/Ps between 1983 and 1993. This reduction was, in part, caused by the enactment of high school graduation course requirements in 1983.
The decline in participation in vocational education has continued in recent years. Figure 16 displays the average number of vocational classes students took in 1997‑98 and 2002‑03. The figure includes all classes listed by districts or ROC/Ps as “vocational,” from basic courses such as keyboarding to high-level occupational courses. Since 1997‑98, vocational enrollments have declined from 2.2 courses to 1.9 courses per student. Of course, not all students take two vocational courses. National studies show that almost all students take at least one vocational class. Only a small proportion of students take three or more vocational courses.
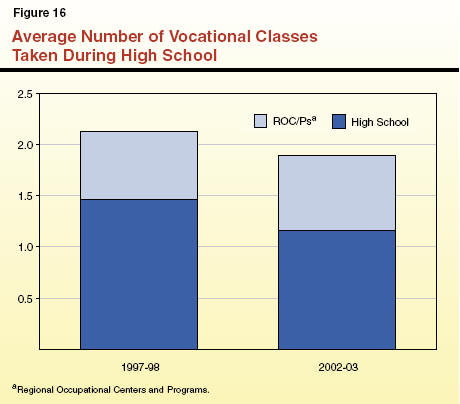
The figure also shows that while the average number of vocational courses offered by high schools dropped sharply over the period, it increased somewhat for ROC/Ps. As a result of these trends, ROC/Ps now provide a higher share of high school vocational courses.
Secondary Vocational Courses Have Little Impact
A great deal of research has focused on the question of whether vocational courses impart significant academic or occupational skills that help students find better jobs and earn more. Figure 17 summarizes the findings common to many of these studies. In general, the conclusion of these studies is that high school vocational courses may provide short-term value to students-in the form of increased employment and wages-but have little effect on academic outcomes.
|
Figure 17 Impact of Secondary
Vocational Education on |
|
|
|
|
|
Dropouts |
Little evidence that vocational programs reduce dropout rates. |
|
Employment |
Small short-run increases in employment. |
|
Earnings |
Modest increases only from completing a sequence of courses in an occupational area. |
|
Academic achievement |
No increase or decrease in academic skills. |
|
College attendance |
No effect on college attendance rates. |
Dropouts. Research on whether vocational education programs induce students to stay in school longer generally finds that they do not. This research, however, is fraught with methodological problems and generally not considered conclusive.
Employment. Findings on employment rates after high school suggest modest impacts from vocational education. An evaluation of the federal vocational education program, known as the National Assessment of Vocational Education (NAVE), concluded that vocational education does little to increase the likelihood that graduates are employed. While other studies show somewhat larger effects, the impacts are significant only during the first couple of years after graduation.
Earnings. Research suggests that individual vocational courses have little impact on wages. Instead, research suggests that vocational studies have the largest effect in combination with other courses. One study, for instance, found fairly large (10 percent) increases in wages resulting from taking four advanced vocational courses or two advanced vocational courses and a computer course. The NAVE report cited studies that showed about 5 percent wage gains from each advanced high school vocational course when combined with study at a community college. As with increased employment, these wage gains diminish over time.
Academic Achievement. Almost all studies we reviewed conclude that vocational courses have no impact-either good or bad-on student academic achievement as measured by test scores. A previous evaluation of the federal vocational education program found vocational courses contained little academic content, were much easier than academic courses, and were much less likely to assign homework.
The recent NAVE report did find initial efforts to increase the academic rigor of vocational courses in some areas of the country. In general, however, the report concluded that most vocational courses did not contain sufficient academic content to increase student skills. The report also finds that taking vocational classes does not result in weaker academic skills.
College Attendance. Researchers have also looked at the effect of vocational course-taking on the likelihood that students will attend college. The NAVE report finds that college attendance of vocational students increased in the last decade and that participation in vocational classes does not reduce the chance that students will enroll in college.
Conclusion. These findings indicate that individual vocational courses have small short-term benefits and few long-term payoffs for high school students. Students benefit primarily from taking a combination of courses that results in skill levels that advantage them in the labor market.
Vocational Course Sequences Are Not Well Developed
These findings suggest that high schools need to structure vocational education as a sequence of courses rather than individual courses. For the most part, vocational education at the high school level is not designed as sequences or pathways. As discussed in Chapter 2 of this report, state law directs ROC/Ps to prepare students for entry-level jobs. This results in a focus on individual courses rather than pathways leading to advanced skills.
Educators have developed several models for sequencing vocational and academic courses as a means of helping students achieve their educational goals in high school-Partnership Academies, Tech-Prep, and youth apprenticeship programs. Below, we briefly review the designs of these programs and available research evidence on their effectiveness.
Partnership Academies. Partnership Academies integrate academic and vocational coursework into a three-year sequence based on an occupational theme. Usually designed as a “school within a school,” academies also include mentoring and internships in the field of study. Currently, SDE reports 290 Partnership Academies in California.
Several of California’s Partnership Academies participated in a national study of the program. Compared to a control group, the evaluation found few significant differences in student outcomes for those participating in an academy in terms of graduation rates, college attendance, or employment. Because of the study’s design, however, these findings apply to programs in which participation is voluntary, and may not represent the outcomes for schools that require all students participate in an academy.
Tech-Prep. Tech-Prep creates a pathway for high school students that results in a community college certificate or degree or a four-year college diploma. The intent behind Tech-Prep is to create the academic and vocational linkages between high schools and community colleges to create a “funnel” effect that leads to college after high school. Tech-Prep pathways are encouraged by the federal government as part of the Federal Vocational Education Act.
The NAVE report finds most Tech-Prep programs are not achieving these goals. While Tech-Prep modestly improves coordination between high school and community college vocational programs, aligning the academic courses needed for success in occupations is much less common. In addition, few programs use Tech-Prep as a funnel to direct students into postsecondary education.
The department reports that 280,000 students took at least one vocational course that was part of a Tech-Prep sequence in 2002‑03. These data are virtually meaningless, however, as SDE merely counts the number of students who enroll in a course identified as part of a Tech-Prep sequence of courses. The department does not collect data on the number of students who complete a sequence.
Youth Apprenticeships. Youth apprenticeships combine academic and vocational instruction with a significant amount of on-the-job training to prepare students for specific high-skill occupations upon graduation. Modeled after similar programs in Europe, apprenticeships are typically two-year programs that start in eleventh grade.
We were able to find only one evaluation of youth apprenticeship programs in the United States. This study, which examined initial implementation efforts in Georgia, concluded that apprenticeship programs differed little from pre-existing vocational and workplace learning courses. Schools generally did not tailor the academic program for apprenticeship students nor link a student’s vocational program to the on-the-job training component.
Community College Courses Provide Long-Term Benefits
Community colleges have well-developed vocational education programs that result in occupational certificates or degrees. The NAVE report found these programs have significant long-term benefits to students. Students completing vocational certificate programs experience long-term earnings gains of about 10 percent (6.5 percent for men and 15 percent for women) compared to the average earnings of a high school graduate. A two-year vocational degree increases long-term earnings by almost 40 percent (30 percent for men, 47 percent for women).
Students in high school currently participate in some of these programs. High school students accounted for about 28,600 community college full-time equivalent students in 2003‑04. Of this total, vocational courses accounted for 15 percent of the instructional time. The other 85 percent represent courses in academic subjects.
Data also show that few high school graduates enroll directly in a community college with the goal of obtaining a vocational degree. Data from CCC show only about 5,500, or 4 percent, of recent high school graduates who enroll in CCC begin with the goal of earning a vocational certificate or degree. The data reinforce our previous findings that virtually all students are encouraged to attend college for an academic degree.
Conclusion
Vocational education, as it currently exists, has little to offer high school students. Individual courses have little impact on the long-term career prospects for students, and schools have scant experience in creating course sequences that payoff for students and encourage them to enroll in CCC vocational programs. Only the community college programs-and especially two-year vocational degrees-provide course sequences that offer large, sustained benefits for students. Despite these benefits, community college services to high school students usually focus on academic courses, not vocational education.
The failure to develop course sequences for high school students has important consequences for students-those who want a rigorous vocational program must figure out which courses to take, when to take them so the sequence can be completed by the end of the senior year, and which institution offers the most valuable instructional content. In the next section, we identify ways the Legislature can address these issues.
Students Need Better Information, More Choices
In this chapter, we reviewed the high school and postgraduate experience of the general track, which we define as those students who graduate from high school without having met the A through G requirements. On the whole, data on postgraduation outcomes for this group suggest many are unprepared for success in college and the labor market.
The data paint a picture of a group of students who see one option for success in life-an academic college degree-but who are failing to gain the skills needed for success in that endeavor. While many take vocational education courses in high school, few seem to view it as a path with long-term payoffs.
It is also clear that many students do not clearly understand the achievement levels needed for success in college or where they stand relative to those achievement levels. While most students begin high school with the goal of attending college, data from CAHSEE show that even students who are struggling to graduate from high school see college as their road to success.
To address these issues, we recommend the Legislature take a number of actions to improve the information and options available to students during high school. We propose to make schools more accountable for helping students make successful transitions to school and work after high school. Our recommendations also would more effectively integrate vocational resources in schools and provide funding for career and educational counseling to meet these goals.
Our recommendations would require a more flexible, customized approach to schooling than most high schools currently deliver. As a result, fully implementing our recommendations would take time. For that reason, we recommend the Legislature phase in the changes to the state’s accountability system over a five-year period. This would give time for schools and districts to build the programs needed to meet the new accountability requirements.
Develop A Greater Range of Curricular Options
The Need for Vocational Pathways
As discussed above, there is currently only one well-developed career pathway for high school students-the A through G requirements needed for UC or CSU. Courses are sequenced through the four years of high school so that, upon graduation, a student has taken all of the required courses. The A through G requirements, however, are an entirely academic option. We believe that schools need to develop options for students choosing a more vocationally oriented pathway and that there are at least three general types of programs that would serve that need.
Four-Year Pathways. First, four-year vocational paths could be structured to help students reach the highest possible levels of academic and vocational skills. For the more academically prepared students in this group, the pathways would allow students to work on CCC vocational degrees while they are in high school.
Two-Year Pathways. Our second optional path would establish two-year vocational programs that provide an employer-validated skill certificate. These paths would be available to students who are not ready to commit to a four-year course sequence in ninth grade or who change plans during high school. To the extent feasible, these two-year paths should be coordinated with CCC programs so that students could transition seamlessly to a higher-skill postsecondary program.
Combined Academic and Vocational Pathway. The third pathway would combine vocational instruction with courses needed to satisfy the A through G requirements. Programs like Partnership Academies can accomplish both of these academic and vocational goals. This pathway would have a number of benefits. Since many students work while in college, the vocational component could help students find jobs that pay higher wages. This could allow them to work fewer hours and finish college more quickly. In addition, for students who are uncertain about whether they are suited for college, the pathway provides a “hedge” strategy, where they pursue college and a vocation simultaneously.
As discussed, there are three key “players” in the provision of vocational services-school districts, ROC/Ps, and community colleges. These educational agencies would need to organize their resources into pathways or sequences that result in credentials and diplomas that have value to employers.
Under our proposal, high schools would have the lead role in developing these various options. High schools, however, would be successful only with the active support and involvement of ROC/Ps and community colleges. We think the Legislature needs to take several actions to make this happen:
Encourage local education agencies to work together to develop vocational sequences at the secondary level and improve access of high school students to CCC vocational courses.
Redefine the mission of ROC/Ps to require the programs to focus on the needs of high school students and participate in structured course sequences with high schools and community colleges.
We discuss these recommendations in detail below.
Encourage Coordinated Vocational Programs
We recommend the Legislature use federal vocational education funds as a lever to encourage community colleges, ROC/Ps, and school districts to coordinate secondary and postsecondary programs into comprehensive sequences.
High schools need the active participation of ROC/Ps and community colleges to create the vocational sequences described above. Too often, however, these three agencies work independently from each other at the local level. Because ROC/Ps and community colleges serve both high school students and adults, opportunities for conflict arise, such as duplicate course offerings or lack of coordinated course sequences.
Tech-Prep is designed to coordinate the three agencies that help “funnel” students from secondary vocational programs to community college programs. The model for coordination contains four central policies or activities for helping students navigate smoothly between the agencies. These policies include:
Identifying the courses high school students should take as a prerequisite for entrance into a community college vocational program.
Agreement on what students are taught in the high school courses so they do not have to repeat the courses in community college.
A process for determining whether high school students earn college credit for advanced courses taken in high school.
Outreach by CCC to encourage students to continue their education beyond high school and to facilitate their enrollment in the community college vocational program.
While these policies appear relatively modest, this level of coordination is the exception rather than the rule across the state. According to CCC’s Chancellor’s Office, about 700 Tech-Prep sequences operate between K-12 education and community colleges. This represents less than one coordinated occupational sequence for every high school in the state.
One sequence per school, however, falls far short of the range of options required to meet student and business interests. A school, for instance, may have a coordinated sequence in automotive technology. This one sequence would not meet the needs of students at the school interested in careers in the medical, computer, or publishing fields. As a result, despite Tech-Prep’s efforts to encourage the development of coordinated sequences for more than a decade, the number of sequences is small relative to demand.
This limited success also suggests that there are few other incentives compelling secondary and postsecondary vocational education to coordinate. An evaluation of the Tech-Prep program published in 2004 supports this conclusion. The report observes that implementation of Tech-Prep in community colleges “can be uneven and relies heavily on an active Tech-Prep coordinator and, often, on a dean who supports the vision for Tech-Prep and sees how it relates to the college’s vision for career technical education as a whole.” In other words, coordination of vocational programs occurs because of individual initiative rather than from incentives built into the system that encourage such coordination.
Because high schools need the assistance of ROC/Ps and CCC to develop high-level vocational options, system incentives are needed to encourage all three agencies to work together to meet the needs of students. We think the best way to create this incentive is by requiring each agency to use a large proportion of the federal vocational education funds for courses that are part of K-14 sequences. For instance, the Legislature could require that, beginning in 2008, each local recipient of federal vocational education funds use a significant proportion of the available funds to support courses that are part of a two- or four-year sequence. In this situation, we would suggest setting specific targets for high schools, ROC/Ps, and community CCC, given the different role each agency plays in a coordinated vocational program.
Currently, the federal vocational education program annually provides California with about $120 million to support and improve state-funded vocational programs operated by the three agencies. Our recommendation would not alter the allowable uses of these funds-except that most of the courses operated by the agencies would have to be part of a coordinated two- or four-year sequence. By conditioning funding on successfully meeting these coordination goals, we think this requirement would create a strong incentive for all three agencies to work together and create vocational sequences for high school students.
Therefore, we recommend the Legislature require the three agencies to spend most of the state’s federal vocational education funds on services and supports for courses that are part of a two- or four-year vocational sequence. This recommendation is consistent with the goals of federal law. The federal act, however, likely will be reauthorized during 2005‑06. The Legislature, therefore, also would need to track proposed changes to federal law to ensure that these funds will continue to be available to support the development of vocational sequences.
Redefine the Mission of ROC/Ps
We recommend the Legislature enact legislation to focus the mission of ROC/Ps on meeting the vocational needs of high school students in two- or four-year course sequences.
The ROC/Ps would play a critical role in the operation of the two- and four- year course sequences by providing some or all of the advanced vocational instruction. As discussed above, the current statutory framework for ROC/Ps, however, pushes these agencies to provide individual courses rather than sequences of courses. In addition, by allowing ROC/Ps to serve adults as well as high school students, state law reduces incentives for these agencies to make their programs responsive to the needs of high school students.
For these reasons, we recommend the Legislature redefine the mission of ROC/Ps to give them more flexibility to meet the needs of high schools and students. Four major changes are needed as discussed below.
Revamp Offerings Into Course Sequences That Provide Skill Certificates. Instead of the current focus on entry-level skills, the Legislature should alter the mission of ROC/Ps to providing courses that are part of two- and four-year sequences that result in skill certificates that are validated by industry. The certificates would document for employers the academic and vocational skills achieved by students completing the course sequence.
Focus ROC/Ps on High School Students. Current law places no limits on the proportion of adults served by local ROC/Ps. In some areas of the state, the programs serve primarily adult students. We recommend the Legislature prohibit ROC/Ps from serving adults as a means of increasing their incentive to participate in local course sequences and make their services as valuable and convenient as possible to high school students. In addition, we recommend the Legislature eliminate the current ban on ROC/Ps serving students under age 16 so that these agencies can participate in administering four-year high school vocational sequences.
Use Growth Funding to Equalize ROC/P Resources. The historical distribution of ROC/P funding results in some communities receiving substantially more resources (relative to their high school population) than other communities. For example, Del Norte and Ventura County ROC/Ps receive funding sufficient to serve less than 3 percent of the counties’ high school students, whereas Mendocino and Inyo County ROC/Ps receive funding for about one-quarter of their high school students. To address these significant differences, we recommend the Legislature revise the ROC/P funding formula to distribute growth funding only to agencies that receive below average levels of funding. Over time, these large funding disparities would be eliminated.
Reflect the Need for Options in the API
We recommend the Legislature amend the API to hold high schools accountable for the successful transition of students to school or work after high school.
Our approach involves increasing the incentives for schools to create curricular options that help high school students succeed in their choice of pathways. We believe that one critical way to support this objective is by adding to the API the percentage of graduates who have met their high school goals. Goals that would count as successes would include the A through G requirements and any two- or four-year vocational certificate or degree. (As discussed above, this proposed change to the API would become effective in five years-after a transition period that gives districts time to implement other changes recommended in this report.)
While the API and the state accountability system have been somewhat superseded by the federal accountability requirements, the API and associated school rankings still provide a powerful means of communicating the success of schools in the state. Parents, community and business interests, and real estate brokers know that a high API and school ranking signals quality. As a result, educators and school board members continue to see the API as an important outcome indicator. By adding into the API the success of high schools in helping students attain their high school goals, the Legislature would stress its importance.
While this academic focus is important for high schools, we think they have a more complex mission than elementary or middle schools. For many students, high school represents a transition phase from school to the labor force. While these students deserve a rigorous academic experience, high schools also should make this transition as successful as possible by giving students the opportunity to develop skills that are valued in the labor market. Our recommendation would signal educators that improving students’ transition to college and the labor force is a critical responsibility of high schools.
Improve Career Path Counseling and Information
We recommend the Legislature take various actions to improve the career information provided to students just before and during high school.
Our proposal to expand the curricular options available in high schools assumes that students and parents would have sufficient information to take advantage of the expanded opportunities. It also asks students and parents to focus on possible careers at the beginning of high school. At the current time, however, we think few schools make a concerted effort to provide the level of career exploration and counseling or information on available curricular options that is necessary.
A critical part of our proposal, therefore, is to improve career counseling and planning for high school. Our proposal has two parts: (1) an eighth grade component that would emphasize career exploration, counseling, and the development with students and parents of a high school course plan, and (2) a tenth grade “check-in” counseling component that would assess each student’s progress and make any changes to the plan desired by students and parents. It is important to note that this career “counseling” would not have to be provided by certificated counselors-there are a variety of ways high schools could provide these services. We discuss these two components in greater detail below.
Eighth Grade Planning. We recommend the Legislature establish and support an eighth grade counseling and planning program. We see three critical components to such a program.
Career Awareness and Exploration. This would help students focus on occupational areas in which they may be interested.
Career and Academic Counseling. Students and parents need honest information about the demands that the different choices make on students’ time and commitment to school. As part of the process, schools would provide information on each student’s current achievement levels and what the student needs to do to maximize the chances of success in the various options of interest to the student and parents. We think data from the STAR tests are an essential piece of information, as it provides the most objective information about the student’s performance relative to the state achievement standards.
A High School Course Plan for Each Student. This would identify the specific courses the student would take to reach the academic and vocational goals desired by the student and parents. Involving parents in the choice of high school goals also may strengthen the role of parents in demanding good local options for all students.
Tenth Grade Check-In Sessions. We also recommend counseling and planning sessions for tenth grade students. Some students will need changes in their plan during high school. Some students may find their original plan was not realistic. Others may want to alter their occupational focus. The check-in planning process provides a formal opportunity for students and parents to change their high school plans.
This review would assess each student’s progress on their chosen plan and give students and parents an opportunity to alter the plan. This formal re-evaluation is designed to maintain flexibility in the high school plans so that students would not be “locked-in” to one course of study when events dictate a change. In fact, the emphasis on two-year vocational sequences stems from the need to provide good options for students whose plans change during high school. By including this process, the Legislature could ensure that at least one formal review occurs during high school.
Fiscal Effect. The cost of our proposed career counseling program would, of course, depend on the specific provisions adopted by the Legislature. As an illustration, however, if the program’s eighth grade requirements necessitated adding one hour to the schedule each week, the cost would be about $75 million annually. The tenth grade program could probably be done in roughly one-half the time and at one-half the cost. These would be Proposition 98 expenses and could be accommodated within the minimum guarantee in the future from funds available for program expansion.
We also suggest the Legislature consider phasing these funds into the budget over several years. It will take at least one year for districts to develop the counseling/planning sessions. It may take more than one year to develop and implement the expanded curricular options. Therefore, adding these funds into the budget over several years may result in providing the funds at the time schools can use the new resources most effectively. We also think the Legislature should give districts considerable flexibility to use these funds in ways that best meet local needs.
Our recommendations above involve some fairly significant changes for middle schools, high schools, ROC/Ps, and community colleges. As such, there will be numerous implementation issues that will need to be addressed. One key issue discussed above, for instance, is how the various educational entities providing vocational classes would work together to develop new pathways for high school students.
Given these difficult issues, it would take time to fully implement these recommendations. We believe the Legislature should consider a five-year horizon in thinking about program implementation. For instance, it might want to start with the development of new vocational pathways, then deal with the eighth grade counseling and finally the tenth grade counseling.
Our proposal may raise concerns among some educators and policymakers that students will be “tracked,” that is, discouraged from a curriculum that allows students to succeed in college after graduation. These concerns assume, however, that current policies do not implicitly create tracking of students. As we have seen in this chapter, the lack of planning results in many students in the general track being unprepared for success in college or work.
We believe that our proposed planning process actually would work to prevent the tracking of students. This would occur for two related reasons. First, the eighth grade planning process would give students and their parents information about the range of available choices and the decision about which option to choose. For students who do not automatically get placed in the university track, this early outreach and planning process would give students the greatest opportunity to develop a high school plan that meets the A through G requirements-or comes as close as possible to meeting them. Thus, early information about choices should expand, not restrict, a student’s option.
Second, our proposal would stress options that encourage students to attain higher level skills. As discussed above, we propose to reorganize high school vocational offerings into sequences that allow high school students to earn (or earn credits towards) a community college vocational credential or degree. By creating these sequences, vocational education would funnel students into community college who currently do not attend college after high school.
To us, the data speak forcefully: the lack of planning and career counseling results in students with vague and unrealistic goals. General track students pay for this lack of information after graduation, when they struggle in community college or in the labor market. While no system can be perfect, we believe students and parents would be better off with a variety of choices and good information with which to evaluate those choices than the current system that implicitly makes most parents and students develop their own plan.
Our recommendations include several significant changes in the structure of the state’s K-12 institutions. While our recommendations are focused on meeting the needs of students in the general track, we think the expanded options and accompanying high school planning process would benefit all high school students.
The career planning and expanded options would help students at risk of dropping out. The planning process and greater range of curricular options would help students connect their high school program to their postgraduate plans.
Career planning also would help students interested in attending a four-year college. Students would learn in eighth grade about the A through G requirements. The planning process would help ensure that students are given every opportunity to take the courses that meet these requirements.
Expanded curricular options would encourage more students to attend community college. By working to funnel students in vocational programs to community college, our proposal seeks to increase the proportion of students attending college.
These recommendations would take time to implement as they ask high schools, ROC/Ps, and CCC to work cooperatively to create an array of options that meet student needs. The data seem clear, however-high schools could help many students make a better transition to adult life. By expanding choices available to parents and students and strengthening accountability for helping students succeed in new areas, the high school experience could be better connected to students’ aspirations and make a larger difference in their adult lives.
Chapter 5
Earlier in this report, we noted that one-fourth of students entering ninth grade satisfy the A through G requirements upon graduation. In this chapter, we take a closer look at the university track and how preparation in high school affects the likelihood of obtaining a college diploma. We also look at how higher education admission policies affect student incentives for working hard during high school.
Community Colleges Help Many Students Obtain a Four-Year Degree
High school students whose goal is a degree from UC or CSU have two major routes to that end. Students may apply directly to enter one of these systems as a freshman. About two-thirds of students who meet the A through G requirements, or about 70,000 students, attend UC or CSU immediately after graduating from high school.
The second major path to a four-year degree is through a CCC. As shown in Figure 18, more than 35 percent of high school graduates who earn a four-year diploma start their undergraduate education at a CCC.
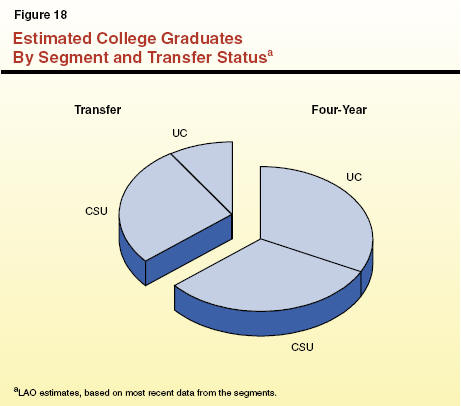
The figure also shows that transfer students account for almost one-half of recent high school graduates earning a degree at CSU and more than one-fifth of UC graduates. These data indicate the importance of CCC in getting students on the road to a four-year degree.
Many College Students Begin With Academic Deficiencies
Colleges and universities find many high school graduates are not fully prepared to do college-level work. All three segments of California’s public postsecondary system (UC, CSU, and CCC) assess entering freshmen for their readiness in mathematics and/or English. At UC and CSU, students may be required to take a placement test. Those scoring below a certain level on the placement tests are required to take remedial courses. Community colleges also assess incoming students for placement purposes. Each college uses its own assessment tools and sets its own standards for determining which students require remedial help.
Figure 19 displays the proportion of high school graduates enrolling in higher education who were assessed as needing remedial instruction in 2002‑03. For UC, 30 percent of students needed remedial instruction in reading and writing. Almost 50 percent of CSU freshmen needed remedial coursework in English (and about 35 percent in mathematics). For community college students, more than 40 percent of entering freshmen needed to retake at least one basic skills course.
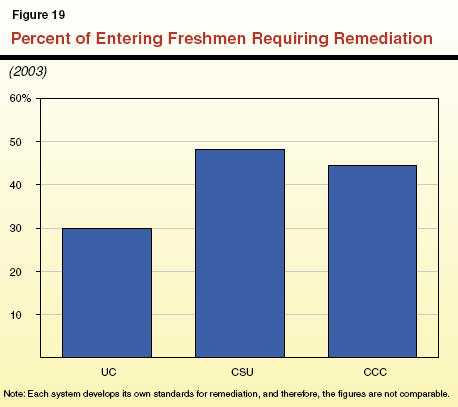
Since each segment sets its own standards, these numbers are not comparable. The CCC definition of remedial coursework encompasses significantly lower skills than the definitions used by UC or CSU. As discussed previously, the CCC defines basic skills courses in mathematics as courses below the level of Algebra I. The CSU placement test covers geometry and Algebra II. As a result, if the CSU definition of prerequisite college skills were applied to community college students, the CCC remediation rate would be much higher.
High School Preparation Affects Success in College
Figure 20 shows the proportion of UC, CSU, and CCC first-time freshmen who return for their second year of college (one-year “continuation”) and their long-term graduation rates. The one-year continuation rates give a sense of whether students were ready for college-they returned for a second year of school. Graduation (or transfer) rates indicate success in achieving the students’ educational goals. While academic preparation is only one factor influencing continuation and graduation, Figure 20 suggests preparation is an important factor.
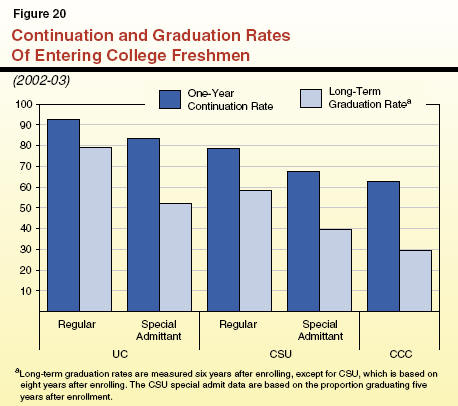
As the figure shows, UC achieves the highest rates of continuation and graduation among regularly admitted students. This reflects the high-achieving nature of the students accepted by the university. These students also were less likely to need remedial coursework than students in CSU or CCC. The CSU has continuation and graduation rates that are 15 percent to 20 percent lower than UC. The rates for CCC are the lowest of the three segments, with just over 60 percent of students continuing into their second year of studies and only 30 percent of students achieving their goal of transfer.
Figure 20 also shows the same rates for students who are accepted as specially admitted students into UC and CSU. Despite not meeting all of the regular admission criteria, the universities found that these students merited acceptance because of economic disadvantage or due to special athletic or other talents. As the figure shows, continuation and graduation rates of special admits are significantly lower than for other students in UC and CSU.
The PACE study on community college students concludes that “students who are required to take remedial . . . coursework are less likely to persist or complete.” Data from UC and CSU also suggest that academic preparation is a critical factor in earning a college diploma. Better academic preparation in high school may help improve these rates, thereby making a university diploma a more-likely possibility for many students.
Grades May Disguise Inadequate Achievement Levels
In the previous chapter, we discussed how community college students often are unaware that successfully passing high school courses may not result in achievement levels that meet community college standards. As a result, students are required to repeat courses they took in high school. In this chapter, we see these issues also affect students in the university track. Students in all three segments must repeat courses they took in high school. Students who are less prepared are also less likely to continue and complete college.
A key underlying problem is the central importance that high school grades have in assessing academic success. For instance, UC and CSU rely on grades as the primary indicator of performance. For most applicants to CSU, admission is based solely on high school grades. The UC uses a combination of grades and SAT scores. In addition, students and parents rely on grades as a main signal of the quality of classroom performance.
Unfortunately, grades are not a reliable measure of student achievement. Course grades are known to be subjective, with grading standards varying significantly among districts, schools, and teachers within a school. In addition, grade inflation in K-12 education is becoming a source of concern to colleges throughout the country, and students can “cherry pick” classes to maximize good grades.
Because of the importance of grades in admission policies, some students can be accepted to UC or CSU as a regular student without mastering high school skills described in the A through G requirements. The placement tests, on the other hand, provide a more objective measure of English (as well as mathematics at CSU) skills that entering freshmen are expected to learn in high school. Higher education placement tests are needed precisely because grades are not always good indicators of student achievement.
Both UC and CSU recognize the need to strengthen the connection between admission or placement policies and objective measures of what students actually learn in high school. In a 2002 report, UC’s Board of Admissions and Relations with Schools (BOARS) recommended that standardized tests for admission should “measure levels of mastery of content in UC-approved high school preparatory coursework and should provide information to students, parents, and educators enabling them to identify academic strengths and weaknesses.”
With this recommendation, UC recognizes that admission tests should provide the same signals about student achievement as grades-but without the subjectivity. The BOARS also found the SAT was not well-aligned with the A through G classes. Therefore, UC negotiated changes in the SAT to more closely align with the material students study in high school. The revised SAT will be given for the first time in 2005, and UC will evaluate whether these changes improve the usefulness of the test for admissions and placement decisions.
The CSU took a different approach. Working with SDE, the university developed a plan to use the eleventh grade STAR tests to help prospective students identify whether they will require remedial instruction in mathematics and English when they enroll in CSU. In order to fully align the STAR tests with CSU’s placement examinations, students answer supplemental questions that are combined with the STAR results. Students who answer the supplemental questions receive a report from CSU indicating whether they are ready for college-level work. Passing the test exempts students from any remedial courses in college. The supplemental questions were included in STAR for the first time in 2004, and students completed a total of 180,000 CSU English and mathematics tests.
The state’s public universities recognize their policies affect the K-12 system, and they are trying to improve the signals to students of whether they are adequately prepared for a four-year institution. The CSU’s STAR project is especially noteworthy in its attempt to connect university placement policies directly to the K-12 assessment system. Both efforts, however, fall short. Neither UC nor CSU propose to reduce the influence of high school grades in admissions policies. Until the systems base admissions on a more objective measure of performance, admissions standards will continue to conflict with placement standards.
In addition, the revised SAT and the CSU/STAR provide information to students late in eleventh grade or early in twelfth grade-too late for students to significantly remediate skill deficiencies. Earlier and ongoing information would be extremely valuable to students and parents, and in the long run, would make a larger impact on the readiness of high school graduates.
Holding Students Accountable for Achievement Would Improve Incentives
The BOARS report acknowledges that UC’s admission policies send messages to students and parents, as well as the K-12 system. In fact, BOARS recommends that the university’s testing requirements should signal that “the best way to prepare for postsecondary education is to take a rigorous and comprehensive college-preparatory curriculum and to excel in this work.” By aligning the content of admissions tests with high school course content, therefore, BOARS recognizes that university admissions policies could increase student incentives for learning in high school. Other researchers have reached similar conclusions. One report bluntly concludes that “remedial programs inadvertently convey to students that high school is irrelevant and that there are no penalties for poor effort.”
In essence, both reports suggest that holding prospective college students accountable for their work in high school would induce students to work harder and learn more. Recent research on the effect of state minimum competency examinations supports this conclusion. These tests are similar to California’s CAHSEE-students must pass the test as a condition of receiving a high school diploma. States requiring these tests experience significantly higher student achievement and a larger proportion of students attending college. These states also have smaller achievement gaps between low-income and higher-income students.
The report on competency examinations concludes that these tests “change how student achievement is signaled. By doing so they transform the incentives for everyone: parents, teachers and school administrators, as well as students.” Without the external standards of achievement, students and parents focus on grades as the indicator of achievement. If students are held accountable based on external standards for excellence rather than grades, parents’ focus switches to achievement based on the standards. This, in turn, can empower educators to make changes to schools that result in greater learning.
The CAHSEE, however, does little to improve the achievement of students in the university track because the test measures skills most students in the university track master well before tenth grade. The BOARS report, however, suggests that admissions tests can have powerful effects on student achievement and the K-12 education system. As a result, using a standardized measure of high school achievement for postsecondary admissions and placement could direct these powerful incentives in a direction that supports K-12 education rather than weakening it.
Use STAR Results for Admission and Placement
We recommend the Legislature require UC and CSU use STAR scores as a major factor for admission and placement decisions. We also recommend the Legislature require the Chancellor of CCC to set statewide standards for using STAR results to place freshmen in appropriate community college classes.
The state’s four-year universities have developed policies that provide pathways through high school for students interested in a college diploma. The A through G requirements signal students about the types of courses that prepare students for college-level work. The universities are also trying to develop ways to signal students about whether their actual achievement in these high school courses is consistent with readiness for college.
Despite these policies, however, evidence shows that freshmen at the four-year universities often lack the prerequisite skills needed for success in college. As a result, a significant number of college students must repeat courses they took in high school. Data also suggest these students also are more likely to drop out of college before earning a diploma.
College admission policies have far-reaching impacts on the willingness of students to work hard in high school. Lacking measures of achievement based on external standards, parents and students push schools to raise grades. University policies that reinforce external standards for what students learn in high school create incentives for parents and students to push schools to help students demonstrate higher achievement on those standards.
For these reasons, we think the state should use the STAR tests for admission and placement decisions in our postsecondary system. The STAR tests offer a ready-made set of standards-aligned examinations in history, science, English, and mathematics. By using the STAR results for these important postsecondary decisions, the state would:
Create Stronger Incentives for Learning. Using STAR results would increase the focus of parents and students on learning and reduce the emphasis on grades.
Provide Early Signals About Student Achievement. The STAR results would provide objective feedback to students in ninth and tenth grades about whether they are performing at levels consistent with the university admission standards.
Establish a More Complete Record of Student Achievement in High School. Students take STAR tests in four content areas over three years of high school, whereas the SAT measures only English and mathematics in eleventh or twelfth grades. By providing a more complete record of academic performance, the STAR data also may be a better indicator of student success in college, which is one criterion UC uses in evaluating admission tests.
Using the STAR Tests for Admissions Would Reduce Costs and Increase Access. Under our recommendation, students applying to UC would no longer have to take the SAT tests, potentially saving time and money. In addition, eliminating the SAT requirement would increase the pool of students eligible for admission-those students who satisfied the A through G requirement but did not know about the additional SAT test requirements.
We discussed our proposal with representatives of the three segments. The UC and CSU indicated that the systems understood the need to further align the K-12 and postsecondary systems. Given the stage of development of the UC and CSU efforts in this area, this appears to be a good time to raise this issue. The UC will evaluate the predictive qualities of the revised SAT test with the high school class graduating in 2006. By expanding this evaluation to include STAR scores, UC could compare the relative benefits of the SAT and STAR tests. Similarly, CSU just completed its first expanded eleventh grade STAR test for the Class of 2005. As CSU evaluates the effectiveness of this mechanism for placement, it also could review the use of STAR data for admissions.
In recommending a change in admissions procedures, we recognize that implementing our proposal would require a lengthy process of review. The universities, for instance, would need to evaluate whether the STAR tests in their existing form satisfy their criteria for use in the admissions process. We also recognize the need to consult with the UC and CSU faculty senate on how best to incorporate STAR data into the admissions decisions. Despite these complexities, using STAR to improve the alignment of standards would create benefits for the universities, high schools, and students. Because of these benefits, it makes sense for the Legislature to begin the implementation process as soon as possible.
CCC Should Use Same Standards. Similarly, we recommend the Legislature require community colleges to use STAR data for recent high school graduates to determine whether remedial coursework is necessary. We make this recommendation for two reasons. First, as discussed in the previous chapter, CCC’s open enrollment policy makes it difficult to signal students about whether they are achieving at the level needed for success in community college. By using STAR results for placement purposes in CCC, the state could provide much better feedback to high school students on their preparedness for college.
The second reason for CCC to adopt standards for using STAR results is to further align the state’s K-16 education policies. If UC and CSU develop admissions and placement policies using STAR data, it would be important for CCC to use the same placement standards. As discussed previously, CCC transfer students must satisfy the A through G requirements and the UC or CSU transfer requirements. Failing to align placement standards for A through G courses could signal students that the CCC transfer route is less rigorous than going directly to UC or CSU.
For these reasons, we recommend the Legislature require CCC to work with UC and CSU to set statewide standards for placement using STAR results. Unfortunately, CCC generally opposes the concept of any systemwide placement standards. Currently, each district decides which assessment instruments to use as part of the placement process. According to the Chancellor’s Office, districts value their independence over issues such as placement.
We recognize the value of local flexibility so that each district can respond to the needs of its local community. In this instance, however, assessment and placement practices have statewide implications. Because there is considerable value to students and the K-16 system of using STAR data for placement decisions, we think the Legislature should require a systemwide placement standard for community colleges. Such an approach would create a more consistent, coherent system of higher education standards in California.
Chapter 6
In this report, we examined the workings of high school from the perspective of three main groups: high school dropouts, the general track (all other students who graduate), and the university track (those who graduate and are eligible for admission into UC or CSU). Despite considerable differences in the types of issues schools face in serving these groups, several themes emerge in our recommendations that are consistent across the groups.
Our recommendations address the problems experienced by high school students by strengthening accountability, improving available information for decision making, and increasing flexibility to improve the options available to decision makers. Not all of our recommendations are focused at the state level. Increasing accountability, information, and flexibility of local programs and processes may be more important in addressing specific problems.
Accountability. Existing accountability programs should be modified in order to create stronger incentives for increased student achievement. We recommend strengthening state accountability by resetting the state’s standard for proficiency under the federal NCLB and increasing the importance of dropout and graduation data in the state and federal accountability formulas (as the quality of the state’s data improves). We also would make high schools accountable to the state for improving student transitions to college and work by adding the proportion of high school students who complete the A through G requirements or another course sequence that results in a ROC/P or community college skill certificate.
Two of our recommendations aim at strengthening local accountability through parents. By creating a career planning process, we try to increase the leverage of students and parents to participate in a course plan that meets the long-term aspirations of students. By using STAR scores as a primary measure of student performance for UC and CSU admissions, we try to enlist parents in the cause of promoting high achievement-rather than high grades.
Information. Improving information available to state and local decision makers is also an important state role. The lack of good data on high school dropouts complicates the state’s desire to hold schools and districts accountable for addressing this problem. Our recommendations on using dropout data from the CALPADS is designed to highlight the importance of this new system and suggest a way to provide early information to state decision makers and local educators on the nature of the dropout problem. Our proposal to evaluate state supplemental instruction and social promotion programs is intended to provide insight into ways educators can increase the achievement of low-performing students.
Parents and students also need better information about their choices and the likelihood of success in those choices. To provide this information, we recommend creating intensive career counseling and planning in eighth and tenth grades. With this information, parents and students will be able to make informed choices about how best to use high school to reach the students’ post-high school goals for work and school.
Flexibility. Existing state and federal categorical programs provide a considerable amount of resources to support the changes recommended in this report. Our recommendations generally suggest ways the Legislature can help districts organize these resources more effectively. In addition, giving districts greater flexibility over the use of categorical resources can facilitate this reorganization of resources.
Students need and want better and more choices in high school-and schools need to be more flexible in providing these choices. Students need other viable alternatives besides getting a four-year college diploma-only about 15 percent of high school graduates earn a college diploma in the decade after high school. Students also want to feel more involved in their education, and creating choices over their high school program empowers students and their parents to use high school to reach their postsecondary goals. We think a greater range of options will benefit all groups of high school students.
The Bottom Line. Our recommendations offer the Legislature several ways to improve high schools. Alone, these changes will not address all of the problems in high schools. Many critical factors are outside of the state’s control. We think, however, our recommendations provide a strategic approach for how the state can contribute to improving high schools.
| Acknowledgments
This report was prepared by Paul Warren, under the supervision of Steve Boilard. The Legislative Analyst's Office (LAO) is a nonpartisan office which provides fiscal and policy information and advice to the Legislature. |
LAO Publications
To request publications call (916) 445-4656. This report and others, as well as an E-mail subscription service, are available on the LAO's Internet site at www.lao.ca.gov. The LAO is located at 925 L Street, Suite 1000, Sacramento, CA 95814. |