Protecting children from abuse and neglect is a critical and challenging responsibility of government in California. Each day, county child welfare agencies investigate reports of child abuse and neglect and make decisions whether children will enter or exit foster care, the latter by reunification, adoption, or guardianship. This report provides an overview of child abuse and neglect in California and the Child Welfare Services (CWS) system that was developed to address it. The report explains the federal, state, and county government roles in the CWS system, how the system is funded, and how foster care providers are paid. The report also describes the trends and outcomes of children in foster care, and analyzes how child welfare outcomes have changed over the last decade. The primary purpose of this report is to provide the reader with an overview of the trends and issues in child welfare and an understanding of how children fare in the CWS system. Through our analysis of child welfare trends and outcomes, we also raise several issues for future legislative consideration that present opportunities to improve child welfare outcomes.
In general, child welfare outcomes have improved steadily over the last decade. As compared to earlier years, children spend on average less time in foster care, are more frequently reunified with their families, and have more permanency in their living situations. County child welfare agencies have also removed fewer children from their homes than in prior years, making greater use of community–based methods for addressing child abuse and neglect. In part due to several policy and operational changes in the CWS system—such as the introduction of standardized and more robust risk assessment tools—there are close to half the number of children in foster care today than there were in 2000. However, while foster care caseloads have fallen dramatically (generally considered a positive trend), the CWS system still has many areas where it can improve upon child safety, permanency, and well–being outcomes—the three domains of child welfare outcomes under law.
We raise the following issues (among others in the report) for the Legislature to consider.
- Group Home Provider Rate Reform and Accreditation. The Legislature could consider (1) replacing the existing group home provider rate system (which is provider–focused) with one that better links the individual needs of children with the funds given to providers and (2) requiring group homes to obtain national accreditation with the goal of improving group home quality standards.
- Incentivizing County Performance Through Realignment Growth Revenues. The Legislature could consider revising the allocation of realignment growth revenues that support county child welfare programs to provide incentives for improved county performance in child welfare.
- Establishing Outcomes Evaluation of Foster Care Providers. The Legislature could consider creating capacity in the child welfare information system for the collection and reporting of child welfare outcomes at the foster care provider level (beyond the current reporting of outcomes at the state and county levels). This information would better inform the CWS system on the relative performance of providers and could be useful in efforts to improve the quality of provider services.
- Expanding Evaluation of Child Well–Being Outcomes. The Legislature could consider expanding the collection and reporting of data on how children fare in the CWS system in the areas of physical and mental health and educational attainment. Currently, very few indicators of child well–being exist in the CWS system.
Child abuse and neglect affects many of the state’s children and can have lifelong consequences. (In this report, we refer to child abuse and neglect collectively as “child maltreatment.”) In 2012, there were reports of child maltreatment for over 487,000 children in California. Of this total, county child welfare agencies substantiated cases for nearly 82,000 children. In that same year, about 60,000 children were in foster care and 109 children died of suspected child maltreatment.
This report provides an overview of child maltreatment in California; how the Child Welfare Services (CWS) system responds to child maltreatment; and the state’s trends, demographics, and outcomes for children in the CWS system. The purpose of the report is to provide an overview of issues related to child maltreatment and also raise issues for the Legislature to consider for improving outcomes in the CWS system.
This report is organized into five chapters, each providing an overview of issues and most raising issues for future legislative consideration. Chapter 1 defines child maltreatment and provides background information on related trends. Chapter 2 provides an overview of the CWS system and how the system interacts with children and their families. Chapter 3 provides information on foster care trends and demographics, details the last decade’s trend of declining foster care caseloads, explains where children are placed in foster care, and discusses issues related to foster care placements. Chapter 4 describes the federal, state, and county funding sources for the CWS system and highlights recent major changes in the state–county fiscal relationship. Chapter 5 provides an overview of federal and state outcome measures for CWS and describes how the state’s CWS system has performed in recent years. For reference, we have also included a glossary of commonly used terms at the end of the report.
Child Abuse and Neglect—What it is and How it is Identified
State law defines three categories of child abuse: physical abuse, sexual abuse, and emotional abuse. The law also defines child neglect as either “general” or “severe” neglect. The following is a description of the different types of child maltreatment as defined in statute.
- Physical abuse is willful bodily injury inflicted upon a child.
- Sexual abuse is victimization of a child by sexual assault or exploitation. Sexual assault includes child molestation, fondling, rape, or incest. Sexual exploitation includes promoting, assisting, or coercing a minor to engage in obscene acts (such as prostitution or participating in pornographic material).
- Emotional abuse is unjustifiable mental suffering inflicted upon a child that endangers the child’s health and results in certain behavioral disorders such as severe anxiety, depression, withdrawal, or aggressive behavior.
- General neglect is the failure of a parent or caretaker to provide a child with adequate food, clothing, shelter, medical care, or supervision.
- Severe neglect is negligent care by a parent or caretaker of a child that results in a child’s medically diagnosed poor physical or emotional development. Severe neglect includes a parent’s or caretaker’s failure to protect a child from severe malnutrition.
Reporting Comes From Mandated and Nonmandated Reporters
State law requires individuals in certain professions, called “mandated reporters,” to report to law enforcement or county child welfare agencies (the latter hereafter referred to as “Child Welfare Services [CWS] agencies”) suspected cases of child maltreatment that they become aware of in the course of their employment. The list of mandated reporters has grown over time, and consists of a broad range of individuals that work with children, including: (1) school staff, (2) healthcare professionals, (3) clergy, (4) certain public safety staff, (5) social workers, and (6) therapists. In addition to mandated reporters, law enforcement and CWS agencies receive reports of child maltreatment from nonmandated reporters, such as family, friends, and neighbors who have witnessed or have knowledge of suspected child maltreatment. As shown in Figure 1, the majority (72 percent) of child maltreatment reports come from mandated reporters.
Reports Are Investigated to Substantiate Allegations
When a CWS agency receives a report of suspected child abuse or neglect (which is also called a “referral”), county CWS social workers investigate the report to determine if the alleged child maltreatment is “substantiated” as defined in state law. Substantiated reports require further action by the CWS agency, and can result in either the agency providing supportive services to the child and family or, if there is imminent risk to the child’s safety, the CWS agency removing the child from the home. In addition to substantiated reports, state law and CWS practice also define various types of unsubstantiated reports—“inconclusive,” “unfounded,” and “evaluated out” reports. The following are descriptions of the possible case dispositions following a report of child maltreatment.
- Evaluated Out—based upon the information in the initial referral, the CWS agency determined that no child maltreatment (as defined in statute) has occurred, and no further investigation is conducted. (This category of case disposition is not defined in statute, but is used in practice.)
- Unfounded—the investigator determined that the referral was false, improbable, or otherwise did not meet the statutory definition of child maltreatment.
- Inconclusive—the investigator did not determine that the alleged child maltreatment was unfounded, but there was insufficient evidence to substantiate the report.
- Substantiated—the investigator determined, based upon available evidence, that child maltreatment more likely than not occurred.
Many Child Maltreatment Reports Are Not Substantiated
A relatively small percentage of child maltreatment reports (18 percent in 2011) are substantiated. For the last several years, CWS agencies have determined that nearly half of all child maltreatment reports are unfounded, and nearly 20 percent of cases were evaluated out without any formal CWS investigation. Since the last decade, there has been a decline in the rate of substantiated/inconclusive reports and an increase in the rate of unfounded reports. Figure 2 shows the trends in CWS case disposition since 2000.
Variation in Case Substantiation Rates by Child Maltreatment Type
The rate of child maltreatment cases that are substantiated varies by type of maltreatment. Certain categories of child maltreatment, such as sexual abuse or physical abuse, have lower substantiation rates than other types of child maltreatment, such as general neglect. As shown in Figure 3, sexual and physical abuse accounts for 28 percent of all allegations of child maltreatment, but only 14 percent of substantiated cases. Conversely, general neglect (the most frequent report of child maltreatment), accounts for 46 percent of all allegations while accounting for 62 percent of substantiated cases. It is possible that the higher substantiation rate of general neglect is partially attributed to the fact that CWS agencies investigate all possible types of child maltreatment when visiting a family reported to the CWS system. In some cases, a CWS social worker may not find evidence of the reported category of child maltreatment, but may find evidence of general neglect.
Figure 3
Reported Versus Substantiated Child Maltreatment by Maltreatment Type
2012
|
|
All Allegations
|
Substantiated Cases
|
|
Sexual abuse
|
9%
|
5%
|
|
Physical abuse
|
19
|
9
|
|
Severe neglect
|
2
|
4
|
|
General neglect
|
46
|
62
|
|
Emotional abuse
|
9
|
8
|
|
Caretaker absence/incapacity
|
2
|
5
|
|
Sibling abuseda
|
14
|
7
|
Figure 4 displays a summary of the victims and perpetrators of substantiated child maltreatment by demographic data and, for perpetrators, by relationship to the child victim. Close to half of all victims reported for child maltreatment are five years old or younger. Two–thirds of perpetrators are between the ages of 20 and 39, and most perpetrators (89 percent) are the child’s parent. Child maltreatment allegation and substantiation rates vary significantly by race. African–American and Native American children are significantly more likely to be reported as victims of child maltreatment than White or Asian/Pacific Islander children (as compared to their respective proportion of the total state population). While White children have an average (substantiated) child maltreatment victim rate of 7.4 per 1,000 children in the population, African–American children have a victim rate of 20.1 per 1,000 children.
Figure 4
Victims and Perpetrators of Child Maltreatmenta
Federal Fiscal Year 2010–11
|
Victims
|
Perpetrators
|
|
|
Percent of Total
|
Victim Rate(Per 1,000 Children)
|
|
Percent of Total
|
|
Age
|
|
|
Age
|
|
|
Less than 1
|
13%
|
20.9
|
6 to 15
|
1%
|
|
1 to 5
|
32
|
10.1
|
16 to 19
|
4
|
|
6 to 10
|
25
|
7.9
|
20 to 29
|
34
|
|
11 to 14
|
18
|
7.0
|
30 to 39
|
34
|
|
15 to 17
|
12
|
5.7
|
40 to 49
|
18
|
|
Statewide
|
100%
|
8.6
|
50 to 75
|
7
|
|
|
|
|
Unknown
|
2
|
|
|
|
|
|
100%
|
|
Gender
|
|
|
Gender
|
|
|
Male
|
48%
|
8.2
|
Male
|
45%
|
|
Female
|
52
|
9.1
|
Female
|
55
|
|
Statewide
|
100%
|
8.6
|
Statewide
|
100%
|
|
Race/Ethnicity
|
|
|
Race/Ethnicity
|
|
|
Latino
|
54%
|
9.1
|
Latino
|
46%
|
|
White
|
23
|
7.4
|
White
|
30
|
|
African–American
|
13
|
20.1
|
African–American
|
14
|
|
Asian/Pacific Islander
|
2
|
1.9
|
Asian/Pacific Islander
|
3
|
|
Native American
|
1
|
13.0
|
Native American
|
1
|
|
Other/unknown
|
7
|
—
|
Other/unknown
|
7
|
|
Statewide
|
100%
|
8.6
|
Statewide
|
100%
|
|
|
|
|
Relationship to Child
|
|
|
|
|
|
Parent b, c
|
89%
|
|
|
|
|
Non–parent
|
11
|
|
|
|
|
Statewide
|
100%
|
Identifying risk factors for maltreatment is important because it helps policymakers and child welfare professionals direct resources for health and human services programs that prevent or reduce the risk of child maltreatment (such as for substance abuse treatment or counseling) towards the most at–risk families. Researchers have identified many parent, child, and family risk factors that increase the likelihood of child maltreatment in a family. Children in families with multiple risk factors are typically at greater risk of child maltreatment, and certain risk factors predict a higher probability of child maltreatment.
Parent Risk Factors. Researchers have found that children of parents with substance abuse problems, mental health disorders, and low educational attainment have a higher risk of child maltreatment. Additionally, children of young parents or parents with a history of childhood abuse have been shown to have increased risk of child maltreatment. Some parent risk factors can be addressed through services such as substance abuse and mental health treatment. Parenting classes, particularly for young parents, can be effective in addressing some risk of child maltreatment. As we discuss in Chapter 2, these types of services are typically used after a family has come in contact with the CWS system to prevent future child maltreatment.
Child Risk Factors. Researchers have shown that young children (particularly infants), children with a low birth weight, and children with mental or physical disabilities are at increased risk of child maltreatment. Children with these risk factors typically require higher levels of parental care and supervision, and are thus more vulnerable to child maltreatment in a family with high stress levels or other social issues such as substance abuse or mental health disorders.
Family Risk Factors. Researchers have shown that there are also family risk factors for child maltreatment including families with: (1) single–parent heads of household, (2) low socioeconomic status, (3) domestic violence, and (4) multiple siblings. Families with these risk factors tend to have higher family stress levels that can affect a child’s safety and well–being. Some of these issues can be addressed with services such as programs providing aid to families living in poverty and services for domestic violence treatment. Many families with these risk factors are already receiving some of these services prior to CWS system contact.
Collection of Case–Level Data on Maltreatment Risk Factors
Extensive research has identified many parent, child, and family characteristics that increase the risk of child maltreatment. The state, however, does not collect and report data on risk factors present in CWS cases. The collection of data on certain maltreatment risk factors—such as family poverty, substance abuse, mental health issues, and domestic violence—at the individual case–level could be integrated in the state’s information system for CWS case management, the CWS–Case Management System (CWS–CMS), and used to evaluate CWS outcomes for children affected by these risk factors. The data would allow the CWS system to evaluate what risk factors are most prevalent in the system and would provide insight into what services are most needed by children and families involved in the CWS system. This information could help guide the allocation of resources in various health and human services programs in furtherance of a policy objective to reduce the risk of child maltreatment occurrences in the state. Given the relatively simple technology required to implement the data collection (through CWS–CMS), and the fact that CWS agencies already observe the information required to collect the data, we believe the data collection would be a relatively minor expense. Additionally, the existing CWS–CMS is in the process of being replaced and the new system could potentially incorporate the additional data capacity at little additional expense.
The CWS System
The Child Welfare Services (CWS) system works to protect children by investigating reports of child maltreatment, removing children from unsafe homes, providing services to children and families to safely reunify foster children with their families, and finding safe placement options for children that cannot be safely reunified with their families. The principal goals of the CWS system are to promote the safety, permanency (in family placements), and well–being of children affected by child maltreatment. The CWS system spans across federal, state, and county government agencies.
Federal Policy and Oversight
The federal government enacts child welfare laws and policies that require (or provide incentive funding for) state compliance. As will be discussed in Chapter 5, the federal government evaluates each state’s CWS program outcomes based on several performance measures. The federal government also audits state spending of federal CWS funds, sets policy priorities and requirements for using federal CWS funds, establishes program improvement goals for states that fail to reach federal performance targets, and issues funding penalties for noncompliance with federal policies and program performance targets.
State Policy and Oversight
The federal government gives states some flexibility in how they operate their CWS programs. Unlike many state CWS programs which are state administered, California’s CWS program is state supervised and county administered. The Department of Social Services (DSS) is the state agency responsible for oversight of the CWS program. The DSS develops program and fiscal policies for CWS, provides technical assistance and training to counties, receives federal CWS funding and distributes these funds to the counties, monitors county CWS program performance, and collaborates with counties to establish program improvement goals.
County Administration
Under the supervision of DSS, county welfare agencies provide the front–line administration of the CWS program, including: (1) investigating reports of child maltreatment, (2) removing children from unsafe homes, (3) finding placements for children in foster care, (4) providing services to families for reunification, and (5) finding permanent adoptive parents or guardians for children that cannot be safely reunified with their families. In addition to county welfare agencies, county probation agencies perform case management (including family reunification and placement services) for foster children who are also involved in the juvenile justice system. The state provides county CWS agencies with some flexibility in how they operate their local CWS program, and therefore there is some variation in administration and services offered among county CWS agencies.
Juvenile Dependency Court
In addition to county CWS agencies, juvenile dependency courts (a division within each county’s superior court) have jurisdiction over the removal, foster care placement, and permanent placement decisions for children involved in the CWS system. Juvenile dependency courts hold a series of hearings (described later in the chapter) that determine how a child moves through the CWS system.
The CWS agencies serve children in the CWS system when they are the subject of a maltreatment report and when children are placed in foster care. The CWS system serves these children through four main program components. Depending on a child’s or family’s situation, the CWS system may serve abused or neglected children in some or all of these four program components.
- Emergency Response (ER) is the initial contact component of the program. County social workers receive reports of child maltreatment through a reporting “hotline” and determine if an in–person investigation is necessary. For cases requiring an in–person investigation, social workers visit the subject child and family and make a determination if the child should be removed from the home, if voluntary supportive services should be provided, or if the case should be closed without further action. In other cases, the initial assessment determines that no investigation is necessary, most often because the reported maltreatment did not meet the statutory definition of maltreatment. The CWS agencies refer to these cases as being “evaluated out.”
- Family Maintenance (FM) provides time–limited support services to children and families to prevent child maltreatment while allowing the child to remain in the home. The CWS agencies provide FM services following a maltreatment report when there is concern about potential future harm to the child, but the county believes that the child can safely remain in his or her home with supportive services. Examples of FM services include counseling, parent training, temporary daycare, and mental health or substance abuse treatment.
- Family Reunification (FR) provides time–limited support services to the family, while the child is in temporary foster care, with the goal of safely reunifying the child and family. Examples of FR services include counseling, parent training, and mental health or substance abuse treatment. State policy is to return children to their families whenever safe and possible, and FR services are designed to address family issues that led to the child’s removal and provide an opportunity for the child’s safe return home.
- Permanent Placement (PP) provides case management and placement services to foster children who cannot be safely reunified with their families. Placement services include facilitating a child’s adoption, guardianship, or, in some cases, long–term foster care placement. When a child cannot be safely reunified with their family, state policy is to provide a child with a permanent adoptive parent or guardian as soon as possible (with placement preference with other members of the child’s family).
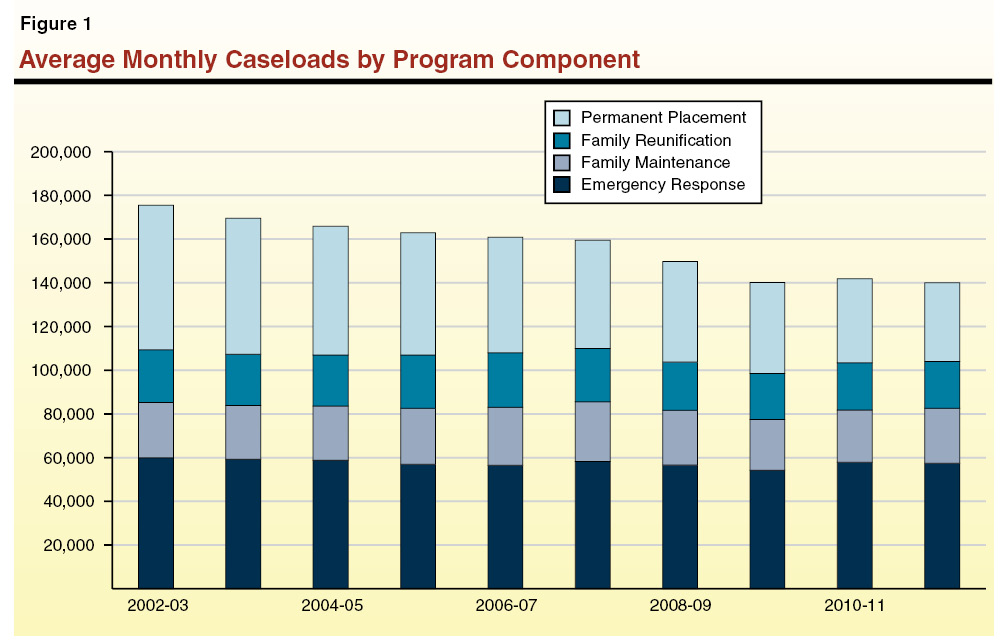
Declining Overall CWS Caseloads, Especially in PP Program Component
Total CWS caseloads have declined over the last decade, but have leveled off in recent years. As will be discussed in Chapter 3, CWS caseload declines are primarily the result of children spending less time in foster care and more children exiting than entering foster care each year. As shown in Figure 1, the largest decrease in CWS caseloads over the last decade occurred in the PP program component. From 2002–03 to 2011–12, PP caseloads declined by 54 percent.
Most CWS Cases Are Closed Shortly After Initial Evaluation. In contrast to declining overall caseloads, cases that were evaluated out increased by nearly 50 percent from 2002–03 to 2011–12. (These cases are a subset of the ER component.) This increase largely reflects the CWS system’s implementation of standardized risk–assessment tools that have been used to screen out a higher percentage of reports prior to investigation. These risk–assessment tools measure risk to the child based upon the information provided in a child maltreatment report, and evaluate whether an investigation is necessary. In many cases, CWS agencies receive reports of activities that either do not meet the definition of child maltreatment or the reports contain insufficient information to conduct an investigation. In recent years, nearly a third of new CWS cases have been closed without any in–person investigation, and the bulk of the remaining new cases have been closed shortly after investigation (or after the provision of short–term services to the child and family).
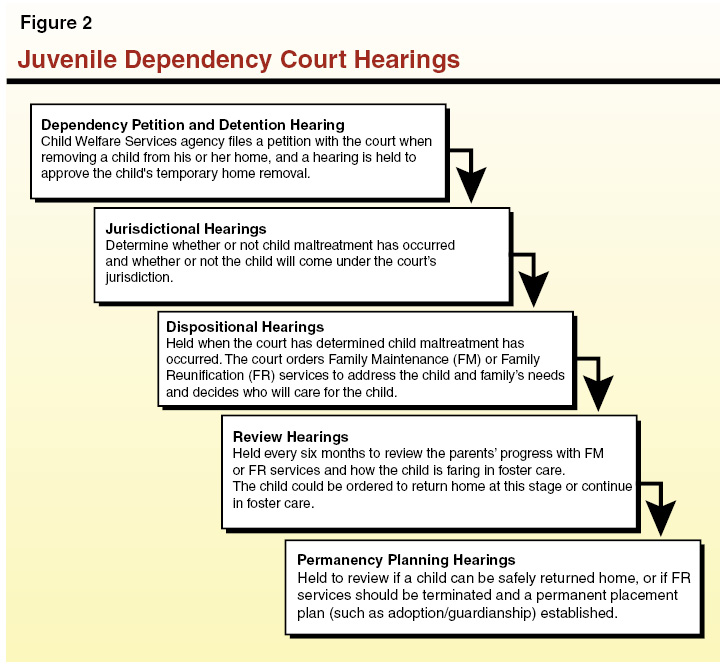
Juvenile dependency courts have jurisdiction over children in the CWS system and make the final decision for how these children are cared for in foster care. Through case review and a series of hearings, juvenile dependency courts decide: (1) if child maltreatment occurred as alleged by the county welfare agencies, (2) if children removed from their home due to maltreatment should be returned home or remain in foster care, (3) what services children and families receive, (4) where children in foster care are placed, (5) when or if parental rights are terminated, and (6) permanent placement plans for foster children where reunification is not possible. Figure 2 describes the major hearings held in juvenile dependency courts and how they affect a child’s movement through the CWS system.
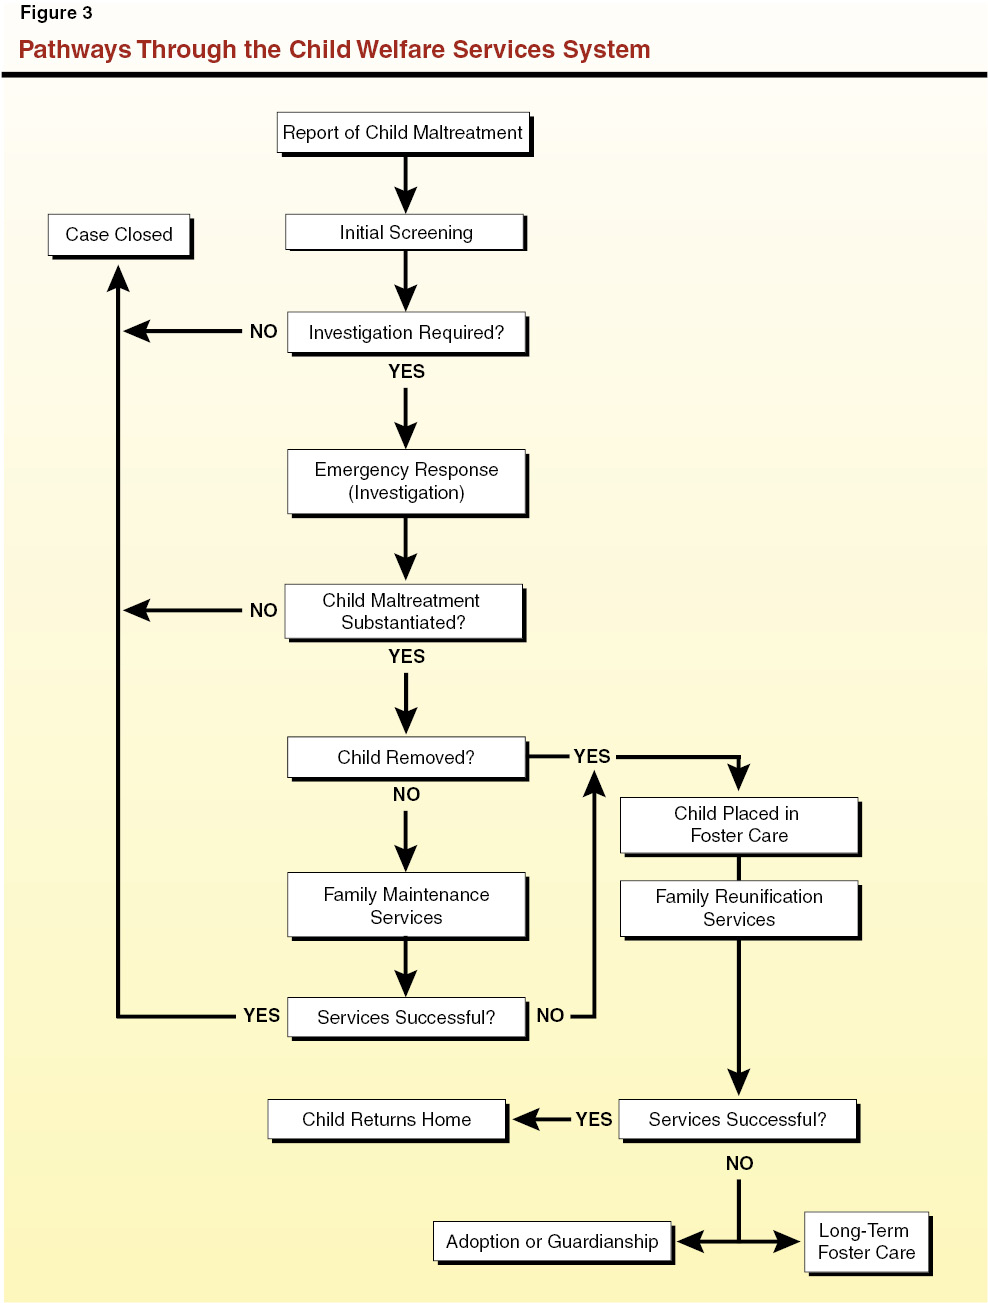
Children involved in the CWS system move through different stages of the system depending on the circumstances of their case. As illustrated in Figure 3, the CWS system responds to each child maltreatment report in different ways. Some cases require an in–person investigation, while others do not based upon the information in the maltreatment report. Some children are removed from their home based on imminent harm to the child’s safety, while other children remain in their home (potentially with referrals to services that help the child remain in the home). Each CWS case is different, and the ability of a parent to maintain custody of their child depends upon the CWS system’s assessment of future risk to the child in the home and the ability of parents to address issues resulting in child maltreatment.
The rate of child maltreatment allegations in the state has changed very little in the last several years. From 2002 to 2012, there was an average of 51 child maltreatment allegations per 1,000 children in the population. However, during this same time period, the rate of child maltreatment reports substantiated by the CWS system declined significantly (27 percent) and the rate of children entering foster care declined by 13 percent.
The relatively consistent rate of maltreatment allegations in recent years indicate a consistent rate in the “perception” of child maltreatment among individuals reporting maltreatment. However, the significant decline in substantiated child maltreatment and decline in foster care entry rates are in part the products of changes in how the CWS system has responded to child maltreatment. (Below, we provide further detail on what is driving the downward trend in substantiation and foster care entry rates.) As shown in Figure 4, there is also large variation in the decline in substantiated case rates by county. Many of the state’s largest counties have reduced the rate of cases they substantiate by over 40 percent over a ten–year period since 2002.
Multiple Causes of Reduced Substantiation and Foster Care Entry Rates
Some information appears to indicate that the cause of lower substantiated case rates is the result of certain changes made by the CWS system in how it responds to child maltreatment allegations. During the last decade, CWS agencies have implemented several practice changes, such as using risk assessment tools during ER and adopting community–based service responses to reports of child maltreatment (in lieu of a CWS response that could substantiate maltreatment). Additionally, in response to the 2007 legal settlement in Gomez v. Saenz, which related to due process in CWS investigations, CWS agency staff have taken training and have updated investigation protocols that may have lowered the rate of substantiated cases. Also, Chapter 842, Statutes of 2004 (SB 1313, Kuehl), raised the evidentiary threshold for substantiating child maltreatment from “credible evidence” to a “preponderance of evidence” that maltreatment occurred.
The direct cause(s) of reduced rates of foster care entries is somewhat less clear than the explanations for reduced substantiation rates. However, certain practices implemented in the CWS system in recent years, such as standardized risk assessment tools, may have reduced the number of children that CWS agencies placed in foster care. Additionally, since CWS agencies have to substantiate child maltreatment prior to placing children in foster care, the overall effect of lower substantiation rates may also have led to lower foster care entry rates.
The recent changes in how the CWS system responds to allegations of child maltreatment have not only lowered the substantiation and foster care entry rates, but have in effect more broadly resulted in a system that more significantly emphasizes family preservation (in addition to safety) as a goal during investigations. It is unclear what effect the CWS system’s greater focus on family preservation has had on families reported for child maltreatment, and whether child safety has been affected by the new investigation practices. The data appear to suggest that in the past the CWS system may have substantiated too many cases and placed too many children in foster care. Therefore, the current system trends may reflect a more appropriate level of CWS system response to reports of maltreatment.
County Variation
There is significant variation in child maltreatment allegation, substantiation, and foster care entry rates among the counties at any point in time. Various factors, including the prevalence of child maltreatment risk factors in a county population (such as poverty and substance abuse) and county administrative practices and policies can affect how often children are abused or neglected in a particular county and how often counties bring children into foster care. For illustrative purposes, we display the variation in county rates for 2012 in Figure 5.
Foster Care Caseload Trends and Demographics
When children are removed from their home due to maltreatment, Child Welfare Services (CWS) agencies place these children in one of several types of foster care “placements.” State law requires CWS agencies to place foster children in the least restrictive, most family–like setting possible (thus avoiding institutional/group care settings when possible). State law also requires CWS agencies to place foster children as close as possible to the home from which they were removed to facilitate reunification with their parents and maintain the children within their community and school. State law further requires CWS agencies to give placement preference to relative caretakers (including a noncustodial parent) and to place siblings together when possible.
Given the sometimes conflicting priorities of placing foster children and the availability of foster care placements in any given community, it is difficult to find an appropriate foster care placement for every child that meets all placement priorities. As an example, while state policy is to place foster children with relatives, a relative caretaker may not be within the immediate area of the home from which the child was removed. In this case, county social workers have to balance the benefits of placing a child with a relative caregiver against the ability of the child to reunify with their parent(s) over a longer placement distance and the benefits of maintaining the child in his or her community and school.
In order of the state’s placement priority, the following are the most common foster care placement types.
- Kinship care refers to when a foster child is placed with a relative for care and supervision. Kinship care is preferred over other foster care placement types.
- Foster Family Homes (FFHs) are county licensed foster homes where foster parents provide care and supervision for foster children in their home.
- Foster Family Agencies (FFAs) recruit foster parents to provide care and supervision of foster children in the parents’ home. The FFAs are licensed by the county (or state) and certify foster parents to operate an FFA home. These homes were designed as a placement option for foster children with elevated needs relative to those placed in FFHs. These children would otherwise be at–risk for group home placement. The FFAs provide more services to the foster parents and more frequent home visits than counties provide to FFHs.
- Group homes provide 24–hour care, supervision, and services to foster children with significant emotional or behavioral problems that require a more restrictive environment than a foster home. Group homes vary in size, services provided, and level of supervision provided by group home staff. Group homes are the most restrictive placement type (excluding foster children supervised by probation agencies).
As of January 2013, there were 61,000 children in foster care. Of the total, one–third were placed in kinship care and one–fourth were placed with FFA homes. About 10 percent of children were placed each with group homes and FFHs. The remaining children were placed in various other placement types (such as supervised independent living and certain legal guardian placements).
Payments to Foster Care Providers
Foster care providers receive monthly payments (per child) for the care and supervision of children. These rates vary by placement type and supplemental payments are available for certain children with special needs. State law establishes parameters for how the Department of Social Services (DSS) sets rates for foster care providers. Due to provider–initiated lawsuits, foster care provider rates are adjusted for inflation each year based upon the California Necessities Index.
Providers in foster homes and kinship care homes receive roughly equivalent monthly payments for care and supervision. The FFAs receive a payment for their administration and social work costs that are in addition to the care and supervision payment made to parents in FFA homes. Figure 1 displays an overview of foster care provider rates.
Figure 1
Monthly Foster Care Provider Rates
Rate Per Child, by Placement Type, 2012–13
|
Rate Type
|
Kinship Carea,b
|
FFHa
|
FFAa
|
Group Home
|
|
Care/supervision rate
|
$640 – $799
|
$640 – $799
|
$829 – $988
|
$2,223 – $9,419
|
|
Administration/social work rate
|
—
|
—
|
868 – 968
|
—
|
Group Home Rate Structure
Group home rates—due to the level of care, supervision, and social work activities required for children with serious emotional and behavioral issues—are significantly higher than other foster care provider rates. As displayed in Figure 1, there is a wide range of group home provider rates, which is a product of the state’s complex rate classification level (RCL) system for reimbursing group home providers. Implemented beginning in 1991, the RCL system established a monthly per child rate for each group home provider based upon a 14–level payment scale. Higher–level RCL providers receive higher reimbursement rates. To determine which level of payment a group home provider receives, DSS uses a complicated scoring system that calculates the number of staff hours that group home providers propose to provide to children placed in their facility. Group home providers receive additional “points” for staff with higher levels of experience and education. Group home providers receive a provisional rate initially and are audited periodically to determine if they meet the requirements of their RCL.
Since group home providers are given a monthly per child rate (based upon their RCL), they receive the same monthly payment for each child they have in their facility, without regard to differences in child needs. (There is an exception for RCL 13 and 14 group homes, which can only take seriously emotionally disturbed [SED] children.) Given the relatively high proportion of fixed costs in group homes (particularly with small providers), group home providers have a strong financial incentive to maintain high occupancy levels. Over time, there has been a general shift from smaller providers to larger ones, many of which operate several group homes across the state.
Consolidation of Group Home Providers at Higher End of RCL System. As shown in Figure 2, very few group home “beds” are operated by lower–level RCL providers. For 2012–13, out of nearly 8,000 total group home beds, only 6 percent were with RCL–1 to RCL–8 providers. The largest amount of group home beds (54 percent) was with RCL–12 providers. In general, a very large portion of the group home beds operated by group home providers are classified at the higher end of the RCL system. In fact, there are currently no group home beds operated by group homes at RCLs 1, 2, 3, 5, or 13. While there are over 700 group home beds that can serve SED children (that could be operated as either RCL 13 or 14), all of them are operated by RCL–14 group home providers.
Foster Children Are Often Placed With Relative Caregivers
Kinship care has consistently been the most frequently used foster care placement type in recent years, which aligns with state policy to place children with relatives when possible. As of January 2013, nearly 35 percent of foster children were placed with relative caregivers.
Subsidized Relative Guardianships. In addition to kinship care placements, relative caregivers are encouraged to become legal guardians for their relatives in foster care through the Kinship Guardianship Assistance Program (Kin–GAP) created in 2000. The Kin–GAP provides a monthly payment to the caregiver, equal to the FFH monthly rate, to support the child. When children enter Kin–GAP, they exit foster care. In 2012, nearly 1,200 children exited foster care through Kin–GAP. In 2011, the federal government began paying for a portion of newly eligible Kin–GAP cases under the Federal Guardianship Assistance Program. As shown in Figure 3, the Kin–GAP caseload peaked at about 14,700 cases in 2004–05 and has since declined to just over 13,000 cases.
Growth in FFA Placements
The second most frequent placement for foster children after kinship care is in FFA homes, which have increased as a percentage of all placements over the last decade. This increase appears to be largely attributed to the shortage of county licensed FFHs (which have declined as a percentage of all placements in recent years) and CWS agencies using FFA homes as a substitute for FFHs. Figure 4 shows the decline in the rate of FFH placements and the increase in FFA placements over time. The FFAs were originally designed to provide foster homes for children with elevated service needs as an alternative to group home placements. While it appears many higher needs children are placed with FFAs, CWS agencies have also placed children without higher service needs in FFA homes.
Varied Placement Distances in Foster Care
Due to the care, supervision, and services (such as counseling services) needed by foster children in a placement; the availability of placements that meet these needs; and the location of relative caregivers, children are not always placed within their immediate community. However, long distances between a child’s foster care placement and his or her family’s home makes family reunification more difficult, disrupts a child’s education when moving between schools, and removes a child from community and supportive family resources.
In January 2013, 82 percent of foster children overall were placed within their home county. Due to child–specific treatment needs and provider availability, however, only 68 percent of foster children placed in group homes were placed in their home county. Figure 5 provides information on the distances between where foster children are placed and the homes from which they were removed.
Sibling Placements in Foster Care
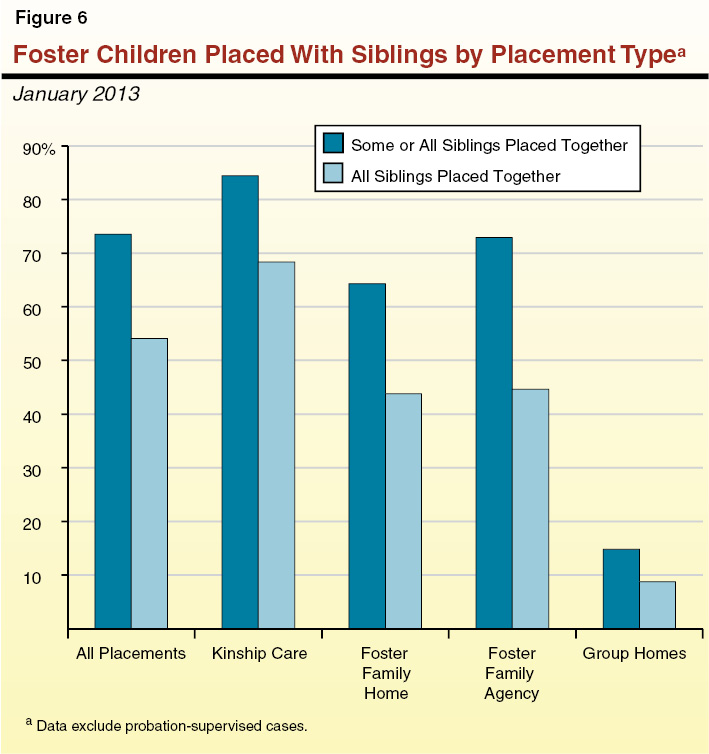
State law requires the CWS system to help children maintain family connections (including those with siblings) while in foster care in support of child well–being. When possible, the CWS system attempts to place siblings in the same foster care placement. However, given the challenges of finding appropriate placements for all foster children, and the variation in child service needs, many siblings in foster care live apart from each other. As displayed in Figure 6, the rate at which foster children are placed with their siblings varies significantly by placement type. In total, 54 percent of children in foster care are placed with all of their siblings and 74 percent are placed with either some or all of their siblings (excluding probation–supervised cases). Sibling placement rates are highest in kinship care, which demonstrates one of the benefits of kinship care as a priority placement option. The FFA and FFH placements have similar sibling placement rates (particularly for all siblings being placed together), with somewhat higher sibling placement rates in FFAs. Group homes, because of their nature of providing specialized care for children with serious emotional or behavioral issues, have very low sibling placement rates.
In 1999, there were approximately 117,000 children in foster care. By 2012, the number of foster children declined almost by half—to approximately 60,000. (Figure 7 displays the foster care caseload and the entry/exit trends over time.) Based upon the latest caseload information, it appears that the consistent decline in the foster care caseload may have ended and that caseloads have stabilized. In fact, the foster care caseload increased by about 1,800 children (3 percent) in January 2013 from the same time period a year earlier.
Multiple Factors Related to Foster Care Caseload Reduction
Part of the explanation of the substantial reduction in foster care caseloads is attributed to the state’s 2000 creation of Kin–GAP, which moved children out of the foster care system and into permanent relative guardianships. Also during the last decade, CWS agencies enacted a number of practice and program changes that have reduced the number of children that enter foster care and the amount of time children spend in care. For example, the previous chapter discussed some of the reasons why the CWS system has been substantiating lower rates of child maltreatment—a practice that results in lower foster care entries. In addition to these practice reforms and changes in law that have led to lower maltreatment substantiation rates, CWS agencies have made greater use of family preservation services (both CWS agency and community–based services) when maltreatment cases are substantiated. The CWS agencies have used these family preservation services to address child safety without removing children from their homes in lower–risk cases. The CWS system has also reduced the amount of time children spend in foster care waiting for adoptions and reunification, and has overall reduced the average amount of time children spend in foster care.
Neglect Is the Most Common Reason for Foster Care Entry
As shown in Figure 8, three–fourths of the children who entered foster care in 2012 were removed from their family home due to neglect. Child neglect has been the most frequent reason for child entry into foster care for many years, and has steadily increased as a percentage of total foster care entries since 2000. Children entering foster care due to neglect are less likely to reunify with their families than children entering foster care due to certain types of abuse. This finding may reflect what can be the persisting nature of neglect (especially as it relates to poverty and substance abuse). In contrast, incidents of abuse can be more one–time in nature or can be mitigated by removing the abusive adult from the child’s household.
Exits From Foster Care
Figure 9 displays the proportions of children who exit foster care by reason for exit. The majority (60 percent) of children who exit foster care do so by reunifying with their parent(s). After reunification, adoption is the next most frequent reason for a child’s exit from foster care and accounts for 18 percent of foster care exits. A number of children, approximately 2,700 in 2012, exit foster care without reunification, adoption, or guardianship. These children are the ones who “emancipate” from the system without any permanent placement. Foster youth emancipate from the system when they reach age 18 or, due to recent changes in law, when they reach age 21 should they elect to continue in foster care beyond age 18. A disproportionate amount of children who emancipate from foster care were in group homes at the time of emancipation. Foster children in group homes make up approximately 10 percent of the total foster care caseload, but make up 29 percent of foster care emancipations.
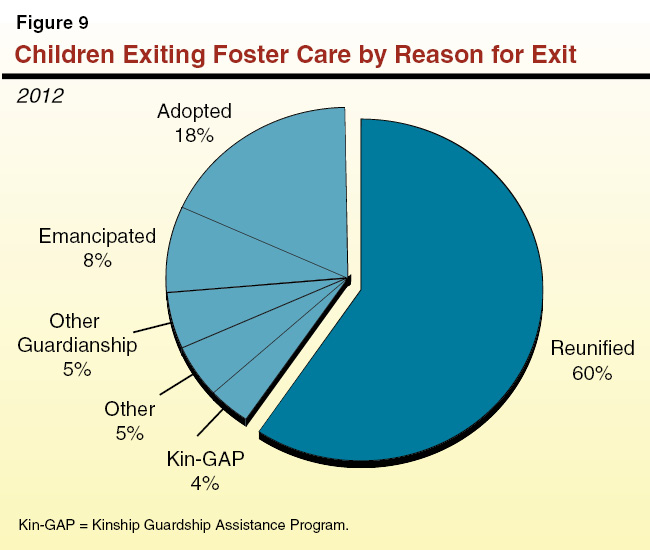
Figure 10 provides a breakdown of the foster care population by age, gender, and race/ethnicity.
Figure 10
Demographics of Foster Children
January 2013
|
Age
|
Foster Care Population
|
|
|
Less than 1
|
5.6%
|
|
|
1 to 5
|
26.6
|
|
|
6 to 10
|
19.4
|
|
|
11 to 15
|
22.5
|
|
|
16 to 17
|
15.9
|
|
|
18 to 20
|
10.1
|
|
|
Gender
|
Foster Care Population
|
|
|
Male
|
48%
|
|
|
Female
|
52
|
|
|
Race/Ethnicitya
|
Foster Care Population
|
California Population
|
|
Latino
|
47.6%
|
50.7%
|
|
White
|
24.4
|
27.9
|
|
African–American
|
23.4
|
5.7
|
|
Asian/Pacific Islander
|
2.5
|
11.0
|
|
Native American
|
1.5
|
0.4
|
Foster Care Population by Age and Gender. As shown in Figure 10, almost a third of all foster children are age five or less, and approximately 10 percent of foster children are non–minors between the ages of 18 and 20. Foster children are about evenly split between males and females, with a slightly higher population of females.
Foster Care Population by Race/Ethnicity. As shown in Figure 10, African–American and Native American children make up a disproportionately high amount of the foster care population relative to their share of the total state population (for those ages 20 or younger). The rates of African–Americans in foster care are four times that of the rates of African–Americans in the state’s total population, and similar disproportionality exists for Native Americans. Conversely, there are lower rates of Whites, Latinos, and Asian/Pacific Islanders in the foster care population as there are in the state’s total population. Most notably, Asian/Pacific Islanders make up approximately 11 percent of the state population but only 2.5 percent of the foster care population.
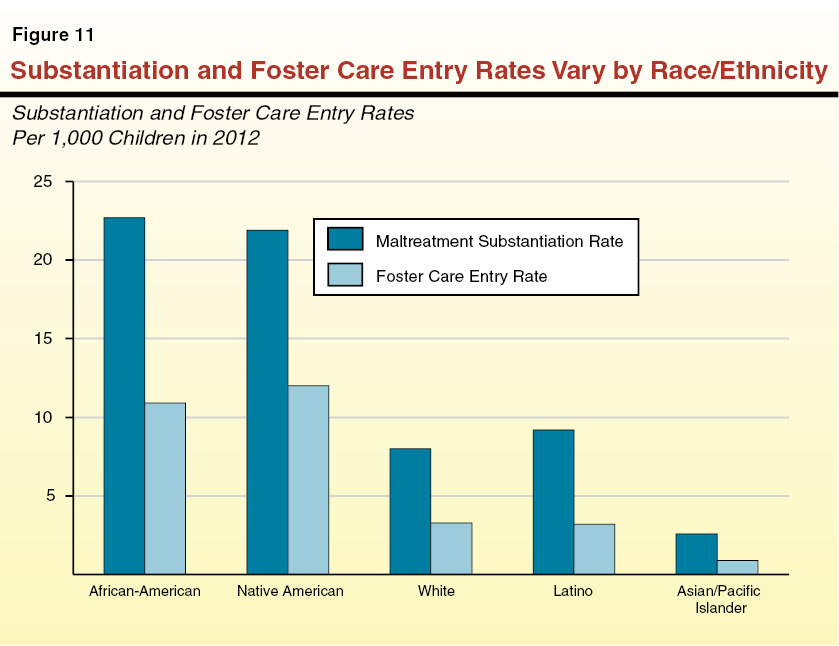
Foster Care Outcomes by Race/Ethnicity. There are also differences in foster care outcomes when comparing one race/ethnicity to another, some of which are displayed in Figure 11. As shown in the figure, African–American and Native American children are significantly more likely to be the subject of a substantiated maltreatment report and enter foster care as compared to White, Latino, or Asian/Pacific Islander children. Additionally, African–American children are more likely to emancipate from the system (staying in the system long enough to age–out without a permanent placement) than other children. In 2012, 13 percent of African–American children that exited foster care emancipated from the system as compared to only 9 percent of all foster children. African–American and Native American children are also less likely to reunify with their families than White, Latino, and Asian/Pacific Islander children. Further, African–American children have less stability in their foster care placements on average than children of all other races/ethnicities.
Reasons for Racial/Ethnic Differences in Foster Care Population and Outcomes
Several research studies have controlled for the underlying risk factors of CWS involvement (such as poverty) and found that it was the higher prevalence of CWS risk factors among certain racial/ethnic groups that contributed towards the disproportionate amount of children of certain races/ethnicities in foster care. For example, in one recent study using California birth record data and controlling for poverty and other risk factors, the researchers found that White children were actually more at risk of CWS involvement than African–American children. When evaluating differences in foster care outcomes among children of different races/ethnicities, recent research also suggests the need to consider the higher prevalence of CWS risk factors in the subject population.
Group Home Provider Rate Reform
The current group home rate structure, the RCL system, is a provider–centric reimbursement system that does not consider the individual needs of children entering group homes. As the RCL system currently operates, children with significantly different care, supervision, and social work needs could be placed in the same group home, and yet the provider would receive the same monthly payment for each child. Given the varied levels of care/supervision and social work services needed by children in group homes, we believe the state’s system of group home reimbursement could be revised to better reflect individual child needs.
Consider Child–Based Rate Structure
The Legislature could consider adopting a child–based group home rate structure that better links the individual needs of children in group homes (and the services provided to address those needs) with the group home provider payment. The new group home rate structure could establish a “base” rate for each child placed in group homes, with additional supplemental rates based upon individual child needs. These rates could be based on a standardized rating scale (with perhaps three to four supplemental rate levels). These rates could be based upon average provider costs and calculated using provider cost data. The CWS agencies could determine each child’s supplemental rate (as applicable). Further, providers could be given an opportunity to provide input into the CWS agencies’ supplemental rate determination.
Consider Fiscal Incentives for Improved Outcomes in New Rate System
In addition to linking group home payments with child needs, the Legislature could also consider providing fiscal incentives for improved outcomes in a new rate–setting system. The current system provides the same level of reimbursement to group home providers regardless of how long the child has been in their care and without regard to the child’s outcomes after he or she leaves the group home. The Legislature could consider providing higher rates of reimbursement when a child first enters a group home and lower rates when a child has remained in the group home for longer periods of time. This could encourage greater amounts of treatment in a child’s initial period in group home care and could result in children spending less time in group homes overall.
The Legislature could also consider paying higher reimbursements to group home providers that achieved certain outcomes for children in their care, such as higher permanent placement rates or greater placement stability after leaving the provider’s care. These incentives could be considered in the context of the provider’s overall outcome performance, as opposed to the outcomes of a single child.
Cost Considerations
In evaluating a new group home rate system, the costs of the new system will be a significant consideration. A new rate structure could be developed in a method that was relatively cost neutral, although there are many factors, such as changes in provider behavior, which would be difficult to model in a new rate structure. Additionally, to the extent that the Legislature adopted fiscal incentives that resulted in improved child outcomes, these incentives could result in overall foster care cost savings (due to shorter stays and less reliance on costly group home care).
Group Home Accreditation
Currently, there are only very minimal health, safety, and program requirements to operate a group home. There is no existing function in the CWS system to evaluate group home provider performance or determine if group homes are addressing child needs in an appropriate manner. While data are lacking to provide a complete picture of the issue, there is general evidence that group home quality varies by provider. For instance, a 2013 report from the state Foster Care Ombudsman’s office evaluated several dozen group homes across the state and identified significant disparities in group home quality by provider.
As a first step towards better evaluation of group home provider quality, the Legislature could consider requiring group home providers to become accredited from a national accrediting organization. There are currently several national organizations that operate accreditation programs for foster care providers, and many of the state’s existing providers are already accredited by these organizations. The accrediting process in the private accrediting organizations goes beyond basic health and safety standards (as performed by the state), and requires group home providers to establish and maintain more rigorous program quality standards. Provider accreditation is relatively inexpensive (the costs of which would be borne by the provider), has the potential to eliminate poor quality providers from the CWS system, and could improve the quality of all providers through a more rigorous group home operating requirement.
Clarifying the Role of FFAs in Foster Care Placements
Over time, FFAs have evolved from their originally intended role of providing foster homes for children that would otherwise be at risk of group home placement to also finding foster homes for children without higher–level needs. As discussed in this chapter, FFA placements have grown as a portion of total foster care placements over time. In some counties, very significant amounts of children are placed in FFA homes.
Given reports from counties about the shortage of foster homes in the locations needed across the state and the demonstrated ability of FFAs to recruit foster parents, the Legislature could consider amending current law to explicitly authorize FFAs to recruit foster parents for children of all levels of service needs. These amendments would modernize the law as it relates to FFAs and more fully reflect the role FFAs can reasonably play in foster parent recruitment. However, FFAs are currently paid to provide social work services to children in FFA homes (services that are not provided to children in county–licensed foster homes) because of the original presumption that FFAs would only serve children with higher–level service needs. The Legislature could consider establishing a separate rate for children that require social work services and a rate for those that do not to better align with the placement role of an FFA in any particular circumstance.
Child Welfare Funding
The Child Welfare Services (CWS) system is funded through a mix of federal, state, and county funding sources. Historically, the state and counties have shared funding responsibility for the nonfederal share of costs in the CWS system. (As discussed further below, 2011 Realignment significantly changed the state–local fiscal relationship in CWS. Under this realignment, the fiscal responsibility for the nonfederal share of costs shifted largely to the counties.) State and county funds have been used as a match for federal funds or to pay for costs in the system that cannot be paid with federal funds. The state receives federal funding directly and then passes this funding through to the counties. A summary of total CWS agency funding is provided in Figure 1.
Figure 1
Child Welfare Services (CWS) Funding in 2011–12
(In Millions)
|
|
Federal
|
State
|
County
|
Total
|
|
CWS administrationa
|
$1,630
|
$53
|
$1,148
|
$2,831
|
|
DSS state oversight
|
13
|
20
|
—
|
—
|
|
Foster care assistance payments
|
545
|
—
|
997
|
1,542
|
|
Adoption Assistance Program
|
359
|
—
|
507
|
866
|
|
Kin–GAP
|
—
|
45
|
12
|
57
|
|
Child abuse prevention
|
9
|
4
|
13
|
26
|
|
Totals
|
$2,557
|
$122
|
$2,676
|
$5,321
|
The CWS system requires funding for both the administrative costs of operating the system and for “assistance payments.” Administrative costs include those related to investigating child maltreatment, case management of children in the CWS system, placing children in foster care, finding permanent placements for foster children, child abuse prevention, and other activities. Assistance payments are monthly payments made to foster care providers for the care and supervision of children. Assistance payments also include payments made to parents who have adopted foster children through the state’s subsidized adoptions program, the Adoption Assistance Program (AAP), or for relative guardians of foster children who receive payments through the Kinship Guardianship Assistance Program (Kin–GAP).
Title IV–E Funding. The federal government provides several funding sources for CWS. The main dedicated source of federal funding for CWS administration and foster care costs is “Title IV–E” funding authorized under the Social Security Act. In 2012–13, Title IV–E funding was approximately 70 percent of all federal funding for CWS agencies in the state. Title IV–E funding is uncapped federal funding that requires nonfederal matching funds equal to 50 percent of total costs. Title IV–E funding is restricted to CWS administrative costs (such as case management) and foster care assistance payments, and it can also be used for assistance payments to caretakers who have adopted or assumed guardianship for foster children (through the AAP and Kin–GAP). Title IV–E funding cannot be used for service–related activities such as family preservation services, even though these services could reduce the number of children in foster care (and thus reduce the overall need for Title IV–E funding).
Title IV–B Funding. Title IV–B funding is a dedicated source of federal funding for CWS, requires nonfederal matching funds equal to 25 percent of total costs, and provides a capped funding allocation that can be used to provide a range of services for children in the CWS system. Title IV–B funding, while a comparatively small funding source (approximately $30 million annually), provides flexible funding that can be used on services such as counseling, parent training, and substance abuse treatment that are ineligible for funding under Title IV–E.
Non–Dedicated Federal Funding. There are other federal funding sources, such as the Social Services Block Grant, Temporary Assistance for Needy Families, and Medicaid, that provide funding for a variety of programs, including CWS. The state has discretion in using these funds for CWS, and in some cases has used these funds to offset General Fund costs in CWS.
Limitations of Federal Funding
Title IV–E “Waiver.” One of the biggest criticisms of how the federal government funds child welfare is the inflexible use of Title IV–E funds. Title IV–E funds can be used for CWS investigations, case management, and foster care provider payments, but not for direct services that could reduce the need to bring children into foster care in the first place or expedite a child’s safe return home from foster care. Since 2007, Los Angeles and Alameda Counties have been participating in a “Title IV–E waiver demonstration project,” referred to as the capped allocation project (CAP), which caps the amount of federal funding Los Angeles and Alameda receive under Title IV–E (in contrast to nonwaiver counties which have no cap on Title IV–E funds), but gives the waiver counties more funding flexibility. The purpose of this federal pilot project, which is operating in several states, is to evaluate the effect providing more flexible Title IV–E funds has on child welfare outcomes. As participants in the CAP, Los Angeles and Alameda Counties are able to direct more of their CWS activities towards reducing the number of children that come into foster care and the time that children spend in foster care.
The state is currently seeking approval from the federal government to participate in the second round of the CAP, which would begin in 2014–15 and end in 2018–19. In addition to Los Angeles and Alameda Counties, there are several other counties that have expressed interest in participating in the second CAP. While there are some financial risks involved with a capped allocation of Title IV–E funding (potential caseload increases without additional federal funding), more flexible Title IV–E funding could potentially improve child welfare outcomes by allowing Title IV–E dollars to be invested in services that reduce the number of children that need to come into foster care or reduce the amount of time foster children spend in the system.
Declining Title IV–E Eligibility. In order for the state to receive Title IV–E funds for children in the CWS system, foster children must meet certain federal eligibility requirements. One of the requirements is that the child’s parents (from the home of removal) would have been eligible under 1996 federal income guidelines for public assistance (“cash aid”) benefits. Due to household income increases since 1996, an increasing number of CWS cases are ineligible for Title IV–E funding. In 2000–01, 82 percent of CWS cases were eligible for federal funding, as opposed to an estimated 66 percent of cases in 2013–14. When cases are ineligible for Title IV–E funds, children still receive CWS agency services, but the costs of these services are paid through nonfederal sources (state/county funds). As a greater percentage of CWS cases have become ineligible for federal funding, the state and counties have assumed a larger share of total CWS costs.
Prior to 2011–12, the state and counties each shared a statutory percentage of the nonfederal costs for the CWS program. The state and county share of nonfederal costs varied by CWS funding component, such as CWS administration and foster care assistance payments. The state share of costs was paid by the General Fund, and counties used local funds to pay their share of costs. In 2011, the state enacted legislation known as 2011 Realignment, which transferred most of the nonfederal funding responsibilities for CWS and a dedicated portion of the state sales tax (in lieu of General Fund dollars) to the counties. Counties receive “growth” revenues when sales tax revenues increase year over year.
Certain components of CWS, such as Kin–GAP, were not realigned, and the state General Fund still has a share of these costs. Additionally, the state still has a share of CWS costs to implement new changes in state or federal laws and policies and the payment of federal penalties.
How Did Realignment Change the State/Local Funding Relationship?
Prior to 2011 Realignment, when CWS caseloads increased, the state and the counties would share in these increased costs. Under 2011 Realignment, counties bear the primary financial responsibility of increased caseloads, thereby placing greater financial pressure on the counties to contain CWS costs. 2011 Realignment funding will grow over time due to growth revenues, but not necessarily at the rate of growth in CWS costs for which counties are responsible. In the short term, counties will likely benefit from additional growth revenues that would not likely have been available through the General Fund allocation process prior to 2011 Realignment (Figure 2 shows the estimate of the 2011 Realignment revenues from 2012–13 to 2014–15). Over time, variability in annual sales tax revenues (realignment revenues) and CWS caseloads could cause an imbalance between realignment revenues and CWS costs.
Figure 2
2011 Realignment Funding for CWSa, b
(In Millions)
|
|
2012–13
|
2013–14
|
2014–15
|
|
Base funding
|
$1,640
|
$1,818
|
$1,971
|
|
Growth revenue
|
157
|
137
|
198
|
|
Totals
|
$1,798
|
$1,955
|
$2,169
|
Revising the Allocation of 2011 Realignment Growth Funding
The current methodology for allocating 2011 Realignment growth funding to individual counties is based largely upon historical funding allocations. As such, the allocation of new growth revenue does not provide a fiscal incentive for counties to improve CWS outcomes. The Legislature could consider modifying the current CWS–related growth funding allocation process to require that a small percentage of total growth funding (say, 10 percent to 15 percent) be based upon improved county outcomes. (We provide more detail on this option immediately below.) This would still allow all counties to receive additional growth funding over time, but would direct a small portion of total growth funding based on improved performance. The determination of which counties would receive incentive–based growth funding could be based upon a comparison of individual county performance against that county’s prior–year performance (as opposed to comparing relative performance among the counties).
Option for Incentive–Based Growth Funding Allocation Process
The Legislature could adopt an incentive–based growth funding process based on improved performance on a cross–section of existing CWS outcomes. There are many existing federal and state outcomes/performance indicators that relate to child safety, permanency, and well–being (as we discuss in detail in the next chapter). County performance on these outcome measures could be calculated in an index score, and certain outcome measures could be weighted more heavily than others. The relative weighting of each outcome measure in the overall allocation process could change over time and reflect legislative priorities for outcome improvements in CWS. The specific outcomes included in the incentive–based growth funding allocation process could be determined based upon input from the administration and the counties.
Child Welfare Outcomes
The Child Welfare Services (CWS) system measures performance in California through a combination of state and federal outcome measures and performance data indicators that have evolved over time. The federal government requires states to track performance on federal outcome measures and establishes national performance standards for these measures. The state has also developed performance indicators that provide CWS performance data beyond that provided by federal outcome measures.
This chapter focuses on the outcomes of children in the CWS system and how the federal, state, and county governments measure these outcomes through administrative data collection and standardized evaluation systems. This chapter also shows the trends in CWS program performance in recent years through an analysis of a cross–section of performance indicators.
As part of the implementation of the federal Adoption and Safe Families Act (AFSA) of 1997, the federal government created a series of child welfare outcome measures to evaluate the performance of each state CWS system. Prior efforts by the federal government to evaluate state CWS performance were focused on compliance with administrative processes and not on the outcomes of those processes. Through AFSA, the federal government adopted an outcomes–based approach to CWS program evaluation to improve national CWS outcomes, with an emphasis on continuous quality improvement.
Federal Outcomes: Safety, Permanency, and Well–Being
At the highest level, federal CWS outcomes relate to child safety, permanency (in a child’s living situation), and child and family well–being. The federal government has developed a series of outcome measures to evaluate performance on these high–level outcomes. The federal outcome measures form the basis of federal reviews of state performance, and the state uses these outcome measures to track state performance relative to national standards. The federal government’s outcomes for safety, permanency, and well–being are in the box below.
Federal Child Welfare Services Outcome Measures
Safety Outcomes
- Children are protected from maltreatment.
- Children are safely maintained in their homes whenever possible and appropriate.
Permanency Outcomes
- Children have permanency and stability in their living situations.
- Children’s family relationships and connections are preserved.
Well–Being Outcomes
- Families have enhanced capacity to provide for their children’s needs.
- Children receive appropriate services to meet their educational needs.
- Children receive appropriate services to meet their physical and mental health needs.
Child and Family Service Reviews
The federal government created the Child and Family Service Review (CFSR) process to standardize federal evaluation of state performance on the federal outcome measures. The federal government uses the CFSR process to periodically review each state’s performance on the federal outcome measures and sets performance improvement targets when a state fails to meet the national outcome standards. The CFSR process begins with the state’s self–assessment of CWS outcomes, where the state identifies areas needing improvement. Following state self–assessment, the federal government conducts a review of a small sample of the state child welfare cases (in a small sampling of counties) and determines if the state is in compliance with federal outcome standards. During the CFSR process, the federal government also evaluates state compliance with seven CWS system standards, which includes requirements for CWS system components such as a statewide information system for case management, a standardized case review process, foster/adoptive parent licensing and recruitment standards, and staff and foster care provider training.
Program Improvement Plans (PIP). If the federal government finds the state failed to meet the national standards on the federal outcome measures, the federal government assesses a financial penalty (based on the state’s level of noncompliance) and the state is required to develop a PIP that outlines the actions the state will take to improve performance. If the state meets its target performance during the timeframe established during the adopted PIP, the federal government waives federal penalties. Because of the high standards set by the federal government, states are likely to enter into a PIP for at least some of the federal outcome measures. In California, the state and counties share the financial obligation of federal PIP penalties.
County–Level Program Evaluation
Because California’s CWS system is county–administered, improving child welfare outcomes in the state requires program reforms and evaluation at the county level. The federal CFSR evaluates summary outcomes from the state’s entire CWS system, but does not directly evaluate CWS performance issues at the county level. To address the need for county–level program evaluation and supplement the federal CFSR process, Chapter 678, Statutes of 2001 (AB 636, Steinberg), created the California Child and Family Service Review (C–CFSR) process.
The C–CFSR. The state conducts the C–CFSR on a five–year cycle (staggered by county). Throughout the entire C–CFSR process, the Department of Social Services (DSS) sends quarterly data reports to the counties that summarize county performance on a series of outcome measures (a version of these and other related data are also available to the public online). The C–CFSR process begins with peer case review, where counties review cases from other counties to identify ways to improve CWS outcomes and share information on best practices. Following peer case review, each county performs a self–assessment of its performance and identifies areas that need improvement. The final stage of the C–CFSR is the system improvement plan process, where DSS and each county develop specific action steps and performance improvement targets to improve outcomes.
As displayed in Figure 1, the C–CFSR works in conjunction with the federal CFSR. The C–CFSR, through county self–assessment, helps the state conduct the state self–assessment required under the federal CFSR. The C–CFSR process, as a county–based performance improvement process, also helps the state meet performance goals set under the federal CFSR process.
State Performance on Federal Outcome Measures
The federal government has reviewed California in two CFSR “rounds,” completing federal review during CFSR round one in 2003 and round two in 2008. In both CFSR rounds, the state was required to enter into a PIP because the state did not meet the national standards on the federal outcomes during the CFSRs and was compliant with only a few of the CWS system standards. During both rounds of the CFSR, the state negotiated performance improvement targets that were lower than the national standards but higher than the state’s performance during federal review in the CFSR. The state and counties subsequently implemented a series of CWS program and practice changes to improve federal outcome measure performance during both PIP periods.
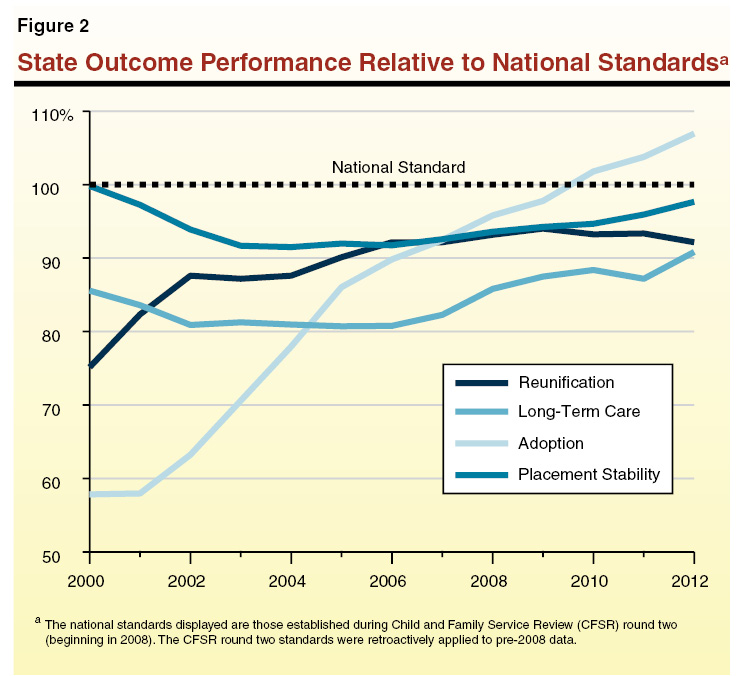
Improved State Performance
The state made progress in improving performance on the federal outcome measures during both CFSR rounds and was able to avoid paying any federal PIP penalties. In CFSR round two, the federal government used a series of “composite” outcome measures, which combined several outcome measures into a single composite score, to measure state performance. In Figure 2, we display the state’s performance on the composite scores relative to the national standards (as established in CFSR round two) for reunification, adoption, children in long–term foster care (“long–term care”), and stability in foster care placements (“placement stability”). While the state made progress on all of the composite measures, the most significant improvement occurred in the adoption composite. As shown in the figure, improvement in federal adoption outcome measures began in 2002, the same year that the state completed its statewide assessment during CFSR round one. While the CFSR process focused state and county efforts on improving certain outcomes, the state had already initiated a number of CWS reforms prior to the CFSR.
How Did the State Improve Performance on the Federal Outcome Measures?
Due to the significant number of CWS practice and program changes that were developed as part of the CFSR process as well as reforms that were developed to improve CWS practices prior to federal review in the first CFSR, it is difficult to identify a direct correlation between specific CWS practice/program changes and performance improvements. The practice reforms and program changes enacted during both CSFR periods included activities such as adopting standardized risk assessment tools; expanding the use of community–based services to children and families in the CWS system; and reform efforts to increase reunifications, adoptions, and guardianships for foster children (including expansion of the Kinship Guardianship Assistance Program and the Adoption Assistance Program). While it is difficult to determine the extent to which individual CWS practice/program changes led to the improved outcomes, state and county reform efforts overall appear to have had a positive effect in general on the state’s performance on the federal outcome measures.
Issues With Federal Outcome Evaluation
Many researchers have been critical of the federal government’s outcome measures and the national standards for these measures. Frequent criticisms about the federal outcome measures range from the appropriateness of equal weighting of states relative to the national standards (without regard to differences in state CWS populations, caseloads, or child welfare laws), concerns about the methodology used by the federal government to measure CWS outcomes, and issues related to data quality.
There is also a concern with the potential for increasing performance on some outcome measures at the expense of others. For example, there are national standards for the rate of foster children that are reunified within specified time periods. A state could improve reunification rates at the expense of the recurrence of child maltreatment (by unsafely returning children to their parent’s home), and therefore improvements in certain outcomes could lead to poor outcomes in other areas.
More Comprehensive Program Evaluation Through State Performance Indicators. Pursuant to Chapter 678, the state developed and tracks several CWS performance indicators that are in addition to, or supplement, the federal outcome measures. The state collects data through CWS–Case Management System (CWS–CMS)—the state’s CWS case management system—and produces quarterly reports on the performance indicators at the state and county level. As compared to the federal outcome measures alone, the state performance indicators provide more information on CWS performance, allow for more robust performance analysis, and address some of the methodological flaws in the federal outcome measures.
While the state has to meet the performance goals set by the federal government to avoid federal penalties, the entire focus of CWS performance in California should not be on the state’s performance on the federal outcome measures alone. The federal outcome measures are a work–in–progress, and the federal government is likely to modify the existing federal outcome measures in the coming years. While new federal outcome measures may be an improvement over the existing measures, the state can and should continue to develop its own performance indicators that advance CWS program quality improvements and are consistent with the state’s priorities for the CWS system. We discuss trends in CWS performance based on the state indicators in the next section.
As discussed in the previous section, a comprehensive analysis of the state’s performance in CWS requires more than an evaluation of the state’s performance on the federal outcome measures alone. This section evaluates CWS performance in recent years by analyzing a cross–section of state performance indicators in the areas of child safety, permanency, and well–being. As we will discuss, the performance data alone do not explain why CWS performance changes are occurring, but rather they provide an indicator of how effectively the CWS system addresses child safety, permanency, and well–being.
Child Safety
In some regards, child safety is the most important aspect of the CWS system in that it measures the CWS system’s ability to protect children from abuse and neglect—sometimes from very serious and recurring abuse from their caretakers. However, there are relatively few performance indicators related to child safety. Most of the performance data available on child safety relate to the recurrence of child maltreatment (following a previous episode of maltreatment), the rate of children abused in foster care, and certain process measures (such as the compliance rate of required social worker visits).
The CWS system works to prevent further child maltreatment once the system has received a report that child maltreatment has already occurred and a CWS agency has substantiated maltreatment. Therefore, state data on child safety relate to the system’s interaction with children that come to the attention of the CWS system through a maltreatment report. While it is likely that there are cases of child maltreatment that exist where no report is made to the CWS system or where the CWS system does not substantiate reported maltreatment that has actually occurred (due to reasons such as insufficient evidence or investigation errors), there is no way to know the number or severity of these cases.
Fairly Consistent Rates of Recurring Maltreatment Reports
Children who have been the victim in a substantiated maltreatment report are often reported as victims in subsequent maltreatment reports. Without addressing the underlying causes of child maltreatment in a family, cycles of maltreatment tend to continue. Over the last decade, a fairly consistent proportion (between 42 percent to 44 percent) of children who were the victim in a substantiated report of child maltreatment have been reported as victims in subsequent maltreatment reports. However, as shown in Figure 3, a decreasing amount of these recurring maltreatment reports have been substantiated over the last decade as more have been determined to be either unfounded or evaluated out.
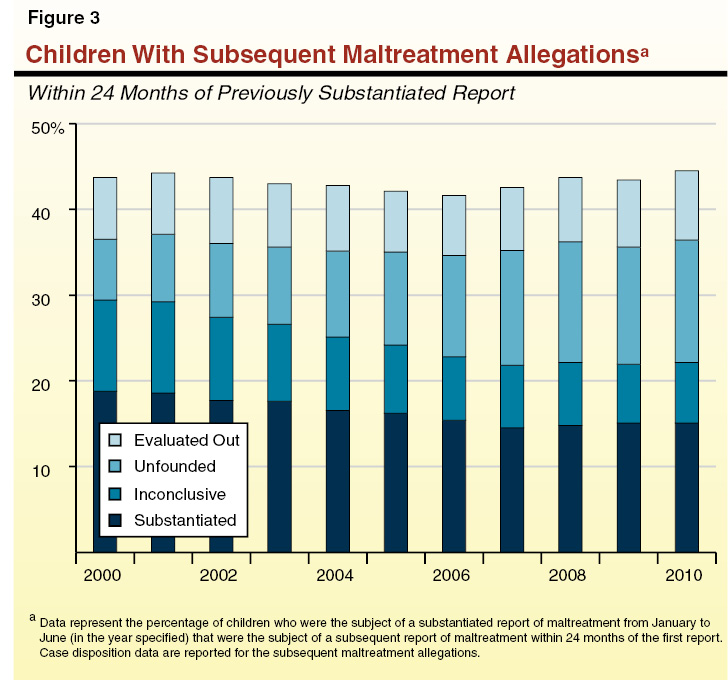
Higher Rates of Recurring Maltreatment for Children Reunified. For children exiting foster care, the recurrence of child maltreatment is significantly higher among children who are reunified with their parents than for children who exit foster care through guardianship. (We note there are no data available for children exiting foster care through adoption.) In 2010, approximately 11 percent of children who exited foster care through reunification were the subject of a substantiated CWS report of maltreatment within 18 months of leaving foster care—twice the rate of children who exited foster care through guardianship. While reunification is the statutorily preferred alternative for children exiting foster care and supports a child’s emotional need to stay connected with their families, it is not without the potential for increased risk to the child’s future safety.
More Timely CWS Investigations and Home Visits
State law requires CWS agencies to investigate reports of child maltreatment either immediately (within 24 hours) or within ten days, based upon the severity of the allegations and risk to the child. Federal and state law also require CWS agency social workers to visit foster children in their homes on a monthly basis. The state tracks county and statewide performance on the timeliness of CWS investigations and monthly home visits with foster children. (Figure 4 displays the state’s performance in these areas since 2000.) While these data do not provide information on the quality of these investigations and home visits, timely investigations and home visits can improve child safety through early and regular detection of risks to child safety.
As shown in Figure 4, over the last decade, there has consistently been greater CWS agency compliance with the immediate response investigations than with the ten–day investigations. The data appear to reflect a higher priority among CWS agencies to meet immediate response investigations deadlines as opposed to ten–day response investigation deadlines. This priority is appropriate given the higher risks to children in immediate response investigations. In 2000, approximately 93 percent of immediate response investigations were completed in a timely manner as opposed to only 80 percent of ten–day response investigations. In recent years, however, the state has made progress on compliance with ten–day response investigations. As of 2012, 94 percent of these investigations were completed within statutory timelines.
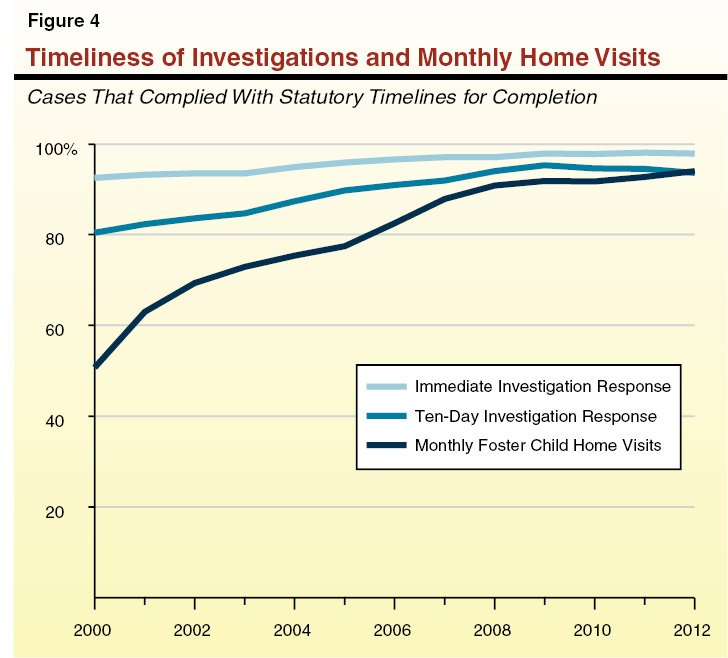
Increased Frequency of Monthly Foster Child Home Visits. As shown in Figure 4, in 2000, only half of the state’s foster children were visited on a monthly basis as required by statute. As also shown in the figure, the state significantly increased the frequency of home visits with foster children over the decade—by 2012, 94 percent of monthly home visits were completed within statutory timelines. The federal government evaluated the state’s rate of timely foster child home visits in both rounds of the CFSR, and this may help explain the CWS system’s efforts during this time period to increase home visit frequency.
Permanency
In general, the state’s permanency goal for foster children is to place children in permanent, safe, and nurturing homes as quickly as possible (with preference towards family placements). Measuring the state’s effectiveness in achieving positive permanency outcomes for children can be difficult because of the unique circumstances of each child in the CWS system. The CWS system does not establish the same permanency goal (such as reunification or adoption) for every child in the system. Therefore, the CWS system’s effectiveness in child permanency should be evaluated on a variety of components related to reunification, foster care reentry, adoptions/guardianships, and stability in foster care placements.
Shorter Stays in Foster Care
Over the last decade, the CWS system has decreased the amount of time that children spend in foster care by decreasing the time it takes for children to be reunified with their families, adopted, or placed with a permanent guardian. As previously discussed, multiple CWS practice and program reforms have led to improved outcomes (including those related to permanency), and the state’s shift to an outcomes–based system of CWS program evaluation also appears to have had a measurable effect on performance improvements.
Improved Permanency Outcomes. To evaluate the improvements in permanency outcomes for children in foster care over the last decade, we analyzed data for three cohorts of children entering foster care during the years 2000, 2005, and 2010. As shown in Figure 5, the state made significant progress in more quickly finding permanent homes for foster children through reunification, adoption, and guardianship from 2000 to 2010. For children entering foster care during 2000, 59 percent were reunified with their families, adopted, or entered guardianship within 24 months in foster care. For children entering foster care in 2010, the comparable number was nearly 70 percent—a significant improvement over the 2000 cohort. After 30 months in foster care, 24 percent of children in the 2000 cohort still remained in foster care as opposed to 17 percent of children in the 2010 cohort.
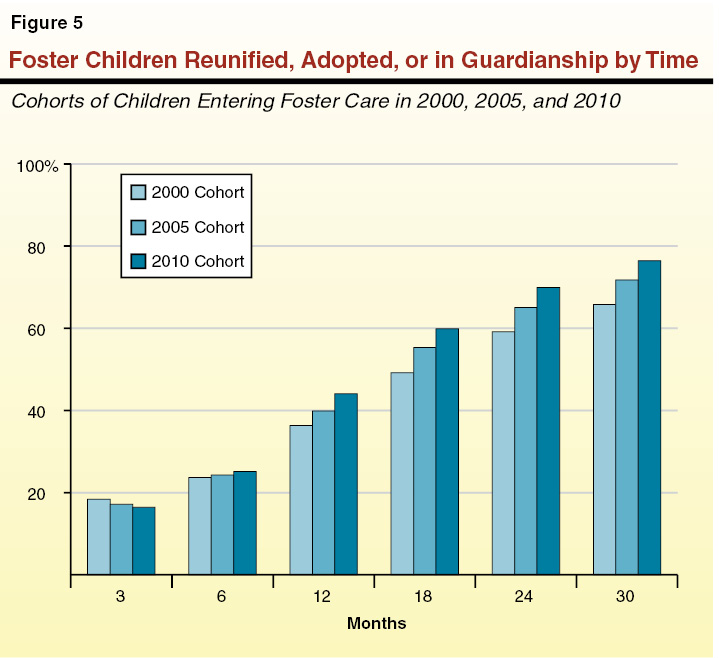
The CWS system’s improvements in permanency outcomes over the last decade have resulted in a foster care population that is smaller and spends on average less time in foster care. While system improvements are still needed and the state should continue its progress in improving permanency outcomes for children in the CWS system, the state has done a much better job of achieving permanency for children in foster care in recent years.
Faster Reunifications but Higher Reentry Rates for Children Reunified
As shown in Figure 6, over the last decade, the CWS system has reduced the time it takes for foster children to reunify with their families. However, as noted previously, CWS outcomes often interact with each other, and CWS practice changes that lead to positive outcomes in one area can sometimes lead to negative outcomes in another area. One example of this are the trends over the last decade of shorter reunification times and higher reunification rates that are counterbalanced with higher foster care reentry rates among children who reunified with their families. Specifically, the median time to reunification for foster children declined from a high of 13 months in 2000 to less than 9 months in 2010. During the same time period, however, the percentage of children who reentered foster care (within 24 months following reunification) increased by approximately 12 percent—from about 14 percent in 2000 to 16 percent in 2010.
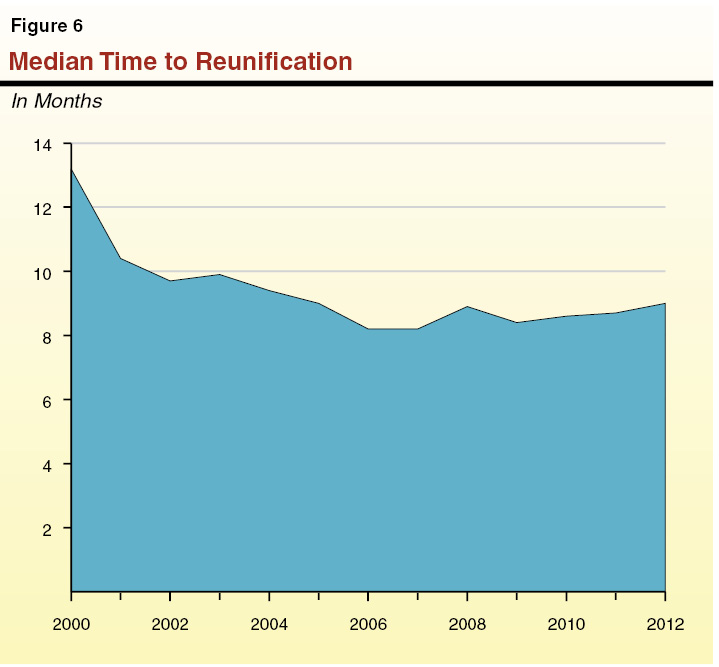
We note that CWS performance data alone do not provide sufficient information to determine if shorter reunification times and higher reunification rates in the CWS system have directly led to higher reentry rates following reunification. However, given the higher rates of recurring child maltreatment among children who are reunified with their families (as discussed earlier), it is likely that as the CWS system reunifies greater numbers of foster children, the overall foster care reentry rate will increase. There is a delicate balance in the CWS system between expediting reunification between foster children and their families and ensuring that children are not returned home before it is safe and in the child’s best interest to do so.
Increased Foster Care Placement Stability
Children in foster care are often moved from one foster care placement to the next, sometimes multiple times in a single year. These placement changes are sometimes in the child’s best interest and could be to move the child from a less family–like setting (such as a group home) to a foster or relative home. Additionally, sometimes CWS agencies locate relatives who are able to and willing to care for a foster child after a child has already been placed in another home. In such cases, a subsequent placement in the relative’s home may be appropriate as it could be in the child’s best interest. However, a major criticism of the CWS system is that foster children are often moved from one foster care placement to the next and are unable to maintain any stability in their living situation. Frequent foster care placement changes make it difficult for foster children to continue in their current school, thus affecting their educational outcomes. Frequent foster care placement changes also affect children’s ability to stay connected with their families and other supportive individuals and make it difficult for a child to identify with a “home.” The emotional effects and harm to a child’s educational performance resulting from frequent foster care placement changes can have long–lasting consequences for children who have already suffered childhood trauma due to maltreatment.
Increased Placement Stability Over the Last Decade. As shown in Figure 7, the CWS system has made significant progress in increasing placement stability for foster children over the last decade. For children taken into foster care in the first half of 2001, 28 percent of the children who were still in foster care 18 months later had been in five or more foster care placements. In 2011, this number decreased to 10 percent of children.
Well–Being
Child well–being in the CWS system generally relates to the physical/mental health and educational status of children in foster care. While well–being is an important outcome for children in the CWS system, performance indicators for well–being are generally lacking. This lack of well–being indicators makes it difficult to fully evaluate how well children’s physical/mental health and educational needs are met in the CWS system.
State Collects Some Information on Well–Being. The state collects and reports information on the timeliness of medical and dental exams for children in foster care, but does not have a performance indicator for actual foster child physical health status or how effectively physical health needs are addressed for children in foster care. Similarly, there are no performance indicators that evaluate foster child behavioral health, although the state does collect and report data for the number of children who have been approved for medications treating disorders such as depression, anxiety, and psychosis (referred to collectively as “psychotropic” medication). The state also collects and reports data that relate to outcomes for a sample of foster children who emancipate from foster care (such as education, employment, and housing status after leaving foster care).
More Timely Medical and Dental Exams
The state measures timeliness of medical/dental visits based upon an age–specific schedule of visits for medical exams and for annual dental exams for children age three or older. As shown in Figure 8, the state significantly increased the percentage of foster children who receive a timely medical or dental exam over the last decade. However, the rates of timely exams are significantly higher for medical as opposed to dental exams. In the first quarter of 2012, 91 percent of foster children received a timely medical exam as opposed to 76 percent of children who received a timely dental exam.
Limited Utility of Psychotropic Medication Performance Indicator
The state has a performance indicator that measures the number of foster children who are authorized for psychotropic medication. According to DSS, 13 percent of foster children (excluding probation–supervised children) were authorized for psychotropic medication in the first quarter of 2013. However, due to data quality issues, the rates of children authorized for psychotropic medication use reported in the performance indicator appear to significantly understate the number of children that were authorized for psychotropic medication use prior to 2008. Additionally, psychotropic medication claiming data from the Department of Health Care Services reflect a decline over the last decade in the rates of psychotropic medication among foster children—which conflicts with DSS’s performance indicator data which show an increase in psychotropic medication use over the last decade. This conflict likely results from the data quality issues with the performance indicator.
Even without the data quality issues, it is unclear what findings can be made from the psychotropic medication use data. Higher or lower rates of psychotropic medication use could indicate either positive or negative outcomes for foster children. For example, higher rates of psychotropic medication use in recent years could possibly indicate that foster children were not receiving psychotropic medication at high enough rates in prior years. On the other hand, higher use rates (in recent years) could alternatively indicate that foster children are receiving psychotropic medication too frequently as compared to prior years. Additionally, changes in pediatric practices could cause higher or lower rates of psychotropic medication use among foster children—a change occurring from outside the CWS system. The existing data on psychotropic medication use among foster children do little more than provide the rates of medication use at specified points in time. Without the development of additional performance indicators that better measure the mental well–being of foster children, the CWS system has little information on the mental health outcomes of foster children.
Limited Data on Exit Outcomes for Emancipated Foster Youth
The state collects some information about education, employment, housing, and other outcomes for children that emancipate from (“age out of”) foster care. Data are not available for all foster youth that emancipate from foster care, but available data represent a sample of emancipated foster youth (the summary data available are displayed in Figure 9). For the emancipated foster youth who exited foster care in 2010, 2011, and 2012 (where data were available), the vast majority of youth had a housing arrangement established, received services for independent living, and had a “permanency connection” (an adult who they could go to for support and guidance). However, only about 57 percent of these youth had completed high school or an equivalency, and only a quarter of these youth had obtained employment. Comparatively, the statewide high school graduation rate in 2011–12 was 79 percent for all students, 62 percent for English learners, and 61 percent for special education students. Educational (and by extension employment) outcomes for emancipated foster youth appear concerning based on the limited available data.
Figure 9
Exit Outcomes for Emancipated Foster Youtha
Youth Emancipating From Foster Care From 2010 to 2012
|
|
2010
|
2011
|
2012
|
|
Completed high school or equivalency
|
58%
|
57%
|
56%
|
|
Obtained employment
|
29
|
27
|
21
|
|
Housing arrangement established
|
92
|
91
|
91
|
|
Received independent living services
|
87
|
85
|
78
|
|
Permanency connection established
|
91
|
91
|
91
|
This chapter has thus far focused on state–level performance outcomes, but we note that there is significant variation in CWS outcomes at the county level. The reasons for this variation relate primarily to differences in: (1) county demographics and rates of individuals in the county population with risk factors for CWS involvement and (2) programs, services, and administrative policies at the county level. County populations have different levels of need for CWS involvement, stemming largely from the prevalence of risk factors in the local community (such as the prevalence of poverty and substance abuse). There are also differences in how local CWS agencies operate, with some counties utilizing certain programs and services that others do not. Both population and county administrative practices and policies can affect CWS outcomes at the county level. There also may be differences in county outcomes based upon the quality of services, staff, and leadership in certain counties, although the degree to which this is a major factor in the differences in county–based CWS outcomes is unknown and difficult to measure.
It is also difficult to compare the performance of small counties against larger counties because of the small sample of children involved with CWS in small counties. Changes in outcomes for a small number of foster children in a small county can have a large effect on the county’s overall outcomes. It is difficult to draw many conclusions about county outcome variation when dealing with the small sample sizes in small counties.
County–Level Outcome Variation—Examples
To provide an example of the variation in county–level outcomes, Figure 10 displays the percentage of children in the ten largest counties in 2011 who (1) were reunified within 12 months of entering foster care and (2) reentered foster care within 12 months of reunification. The range of reunification rates varied between 22 percent (Fresno County) and 48 percent (Santa Clara County), with the statewide average at 41 percent. There was also a wide range of foster care reentry rates among the ten largest counties in 2011. The smallest rate of children reentering foster care within 12 months of reunification was 6.2 percent (Fresno County) and the largest was 15 percent (Alameda County).
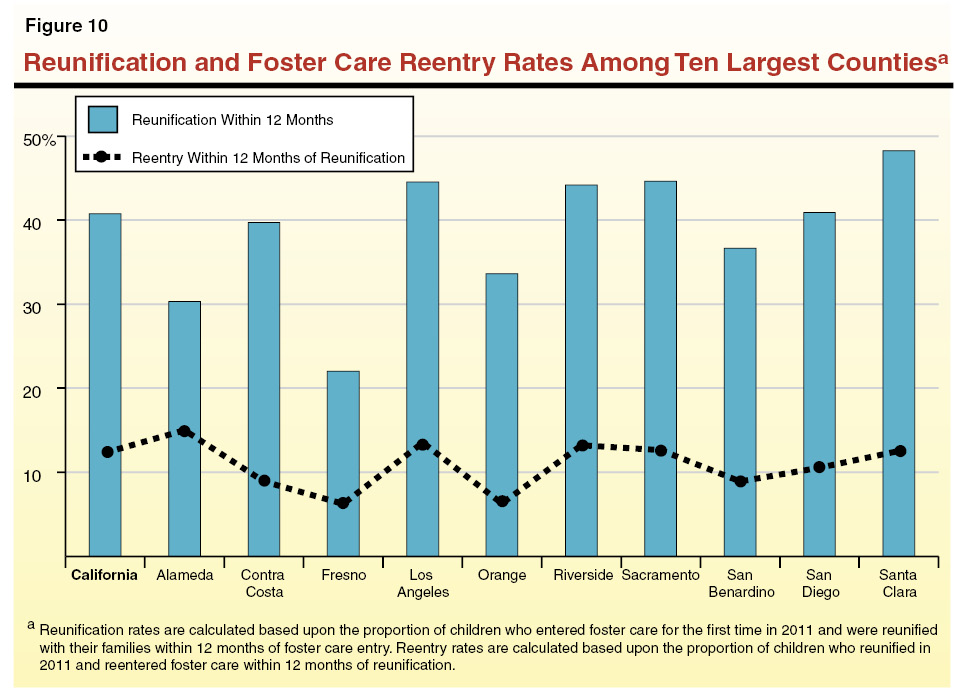
Reunification and foster care reentry rates are only two of many examples of the variance in CWS outcomes by county. As we discuss below, there are many reasons why CWS outcomes vary by county, and there are a number of factors that must be considered prior to making any conclusions about variation in county–level outcomes.
Exercise Caution When Making County–Level Performance Comparisons
It is difficult to compare one county’s performance against another’s due to the significant variation in both the prevalence of CWS risk factors and the administrative practices and policies among the counties. Certain counties have a population with higher–level service needs, which can contribute to poorer outcomes when compared to counties with less significant social and economic challenges. This is not to say that there are not valid reasons to look at other “higher performing” counties as an example of how to improve performance in a lower performing county. There are many things that counties can and do learn from each other when comparing county practices and policies. However, when comparing performance county by county, it should be done in a manner that considers the full range of factors that affect county–level CWS performance, and not just those related to the organization. Additionally, evaluating a county’s performance over time, as opposed to county–versus–county performance, may yield more relevant results for identifying factors that either increase or decrease CWS performance. Finally, county–level performance comparisons should include all relevant outcome measures because of the interaction certain outcome measures have with other measures.
Creating Capacity for Provider–Level Performance Evaluation
Currently, the CWS system does not collect and report foster care provider performance data. While there is a significant amount of information on county and state CWS outcomes, the state lacks a system for evaluating the effect individual foster care providers have on foster children. These performance data would be useful to the state and counties in evaluating provider performance and would better inform child placement decisions at the county level. Specifically, the state and counties could identify poorly performing providers and either work with these providers to improve performance or cease placing children with these providers. To address the need for provider–level performance data, the Legislature could consider adopting provider–level performance indicators that the CWS system would use to evaluate provider outcomes. Given that the state is currently in the process of replacing and upgrading CWS–CMS, these provider–level performance indicators could be incorporated in the new CWS–CMS, or the new system could be developed with capacity to incorporate these indicators in the future.
What Could Provider Performance Indicators Measure?
Provider–level performance indicators could largely mirror the existing state and county indicators in the areas of child safety, permanency, and well–being. However, certain provider–level performance indicators may be more valuable to foster care placement decision–making than others. For instance, child safety while in a provider’s care, and placement stability and timeliness of permanent placements following a stay in a provider’s care, would be particularly valuable to foster care placement decision–making. Without these provider–level data, state and counties have no systematic way of determining which providers facilitate the best outcomes for foster children.
Expanding Performance Indicators of Child Well–Being
While there are many performance indicators for permanency, and a sufficient number of indicators related to child safety, the state has few performance indicators of child well–being. As previously discussed, the well–being measures that do exist are primarily process–oriented performance indicators and, in the case of the performance indicator for psychotropic medication, provide very little information from which to evaluate child well–being. To address this issue, the Legislature could consider adopting a more comprehensive and effective set of child well–being performance indicators. These indicators could more effectively assess the physical/behavioral health and educational outcomes for children involved in the CWS system. While there may be many indicators that would be helpful in more fully understanding the well–being of children in foster care, there are data and cost constraints that the Legislature would need to consider when developing these performance indicators. Recognizing these constraints, the box below includes our suggestions for the development of child well–being measures in the areas of physical/behavioral health and education.
Balancing Priorities
While we provide an extensive list of well–being performance indicators, this list does not necessarily encompass the full scope of performance data that the CWS system would optimally have in order to fully evaluate child well–being. Additionally, depending upon the costs and challenges of collecting the information, the Legislature would need to set and balance its priorities from among the performance indicators.