Introduction
One of the basic functions of government is to provide the public infrastructure—land, streets and highways, buildings, and utility systems—that is integral to delivering public services, fostering economic growth, and enhancing the quality of life. The state and local governments in California have developed an immense inventory of public infrastructure. As shown in Figure 1, the state's infrastructure includes a diverse array of capital facilities associated with such programs as water resources, transportation, higher education, natural resources, criminal justice, health services, and general government services. In addition to the state government infrastructure investments shown in Figure 1, the state historically has provided some funding for local public infrastructure: K–12 schools, community colleges, local streets and roads, local parks, wastewater treatment, drinking water, flood control, and jails.
Figure 1
Major State Infrastructure
|
Transportation
|
- 50,000 lane miles of highways and 12,000 bridges
- 9 toll bridges
- 11 million square feet of Department of Transportation offices and shops
- 170 Department of Motor Vehicles offices
- 102 California Highway Patrol offices
|
|
Higher Education
|
- 10 University of California campuses
- 23 California State University campuses
|
|
Water Resources
|
- 34 reservoirs
- 25 dams
- 20 pumping plants
- 4 pumping–generating plants
- 5 hydroelectric power plants
- 701 miles of canals and pipelines—State Water Project
- 1,595 miles of levees and 55 flood control structures in the Central Valley
|
|
Natural Resources
|
- 278 park units containing 1.3 million acres, 4,000 miles of trails, and 3,000 historic buildings
- 226 forest fire stations, 39 conservation camps, and 13 air attack bases
- 16 agricultural inspection stations
|
|
Criminal Justice
|
- 33 prisons and 44 correctional conservation camps
- 5 youthful offender institutions
- 19 million square feet of judicial branch facility space
- 11 crime laboratories
|
|
Health Services
|
- 5 mental health hospitals
- 4 developmental centers
- 2 public health laboratory facilities
|
|
General State Office Space
|
- 224 state–owned office structures
- 2,370 leases for state office space
|
Infrastructure finance is an increasingly important issue. Much of the state's infrastructure is aging and needs to be renovated, adapted, or improved to meet current and future needs. Additionally, California will continue to need new infrastructure to accommodate population growth. This, in turn, will require additional resources for operations and maintenance. Over the last decade, the state took significant steps toward confronting this dual challenge of renovating and expanding infrastructure, most notably through the authorization by voters of approximately $92 billion in infrastructure–related general obligation bonds as well as the authorization of several large lease–revenue bond programs.
In this report, we summarize the state's infrastructure spending in order to provide a better understanding of how the state invests in infrastructure. (See the nearby box for a brief description of how we defined and calculated infrastructure spending.) Specifically, the report reviews the last decade to identify (1) the types of infrastructure in which the state has invested; (2) how the state financed these investments; (3) achievements and challenges in planning, funding, and implementing capital outlay projects; and (4) considerations for planning and funding future infrastructure. This first chapter provides an overview of the state's infrastructure spending as well as the state's infrastructure planning and financing process. Subsequent chapters discuss specific issues within the state's major capital outlay programs. In the final chapter, we summarize the major issues the Legislature will need to confront to effectively address statewide infrastructure issues.
What Is Infrastructure Spending?
In this report, we define infrastructure spending as state spending for acquiring, planning, designing, or constructing major physical assets. This includes spending for the major renovation or rehabilitation of an existing asset. Other costs associated with the state's infrastructure—such as facility leases, utilities, or routine annual maintenance—are not included. We exclude most of these other costs because they are operating expenses rather than investments in the state's infrastructure. One exception, however, is the state's lease costs. Ideally, lease costs should be included in our infrastructure spending totals because leasing private space is a substitute for building and maintaining state–owned space. We did not include lease costs because the state's method for budgeting rental payments makes it difficult to determine annual spending levels by program. As a result, our spending totals understate the state's total infrastructure spending by about $400 million to $500 million annually. (The Department of General Services estimates that the state's rent for leased space in 2010–11 was approximately $470 million.)
Even with the exclusion of lease costs, identifying the level of spending on infrastructure is not straightforward. State spending is typically classified as either state operations, local assistance, or capital outlay. While spending categorized in the budget as capital outlay is clearly for infrastructure, portions of state operations and local assistance budgets also fund the planning and construction of infrastructure. Many state departments, for example, use part of their state operations budgets to plan and oversee infrastructure projects. Similarly, many local agencies spend part of their state local assistance funds building infrastructure. Whenever possible, we identified the amount of infrastructure spending in each program, but in some cases we had to estimate the percentage of operating budgets or local assistance used for infrastructure purposes.
|
Major Drivers of Infrastructure Spending
The state spent $102 billion from state funds on infrastructure from 2000–01 through 2009–10. This spending was largely driven by the following factors:
- Maintaining Existing Infrastructure. Investment is needed to preserve and rehabilitate existing infrastructure as it ages. Much of the state's infrastructure was built more than 30 years ago and requires minor renovations or major upgrades to operate efficiently and safely.
- Building New Infrastructure to Accommodate Growth Demands. The state's population grew at a rate of about 400,000 persons annually over the last decade. Population growth increases demand for infrastructure, such as schools to accommodate higher student enrollments, additional roadways and transportation facilities to facilitate mobility, and water supply and water quality infrastructure to accommodate increased water demands.
- Responding to Legal Requirements. Investment is also needed to improve existing infrastructure to meet federal and state legal requirements put in place after the infrastructure was constructed. These requirements include environmental regulations, the Americans with Disabilities Act, and improvements to prison healthcare facilities under the control of the federal court–appointed Receiver.
- Fulfilling New Priorities and Voter Initiatives. In addition to the state's traditional infrastructure programs, the state has taken on new infrastructure responsibilities within the last decade. Some examples include the acquisition of additional land for local parks and the authorizations of general obligation bonds to support children's hospitals and high–speed rail.
Infrastructure Financing
The state's infrastructure spending relies on various financing approaches and funding sources. For example, fuel tax revenues fund a portion of transportation infrastructure, water fees collected from water users fund certain water projects, and the General Fund pays for other infrastructure. Some infrastructure has been funded through direct—or pay–as–you–go—spending from the General Fund and special funds. As shown in Figure 2, however, the majority of state infrastructure spending has been financed by borrowing through the use of long–term bonds. We discuss each of the major financing mechanisms below.
Figure 2
How Does the State Pay for Infrastructure?
2000–01 Through 2009–10 (Dollars in Billions)
|
|
|
|
|
Pay–As–You–Go
|
|
|
|
General Fund
|
$1.9
|
2%
|
|
Special fund
|
33.8
|
33
|
|
Subtotals
|
($35.7)
|
(35%)
|
|
Borrowing
|
|
|
|
General obligation bonds
|
$59.1
|
58%
|
|
Lease–revenue bonds
|
5.5
|
5
|
|
Traditional revenue bondsa
|
2.0
|
2
|
|
Subtotals
|
($66.6)
|
(65%)
|
|
Totals
|
$102.3
|
100%
|
Pay–As–You–Go. Under the pay–as–you–go approach, the state funds infrastructure up front through the direct appropriation of taxes and fees. Over the last decade, direct appropriations from General Fund sources represented a small portion of the state's infrastructure spending (2 percent). In contrast, pay–as–you–go spending from special funds—primarily transportation revenues—made up a significant share of the state's infrastructure spending (33 percent).
General Fund–Supported Bonds. The state traditionally has sold two types of bonds that are typically paid off from the state's General Fund: general obligation bonds and lease–revenue bonds. The process for authorizing, appropriating, issuing, and repaying bonds is summarized in Figure 3. The Legislature has a significant role in the earlier stages of the process, while the later stages of the process are mainly under the control of the administration.
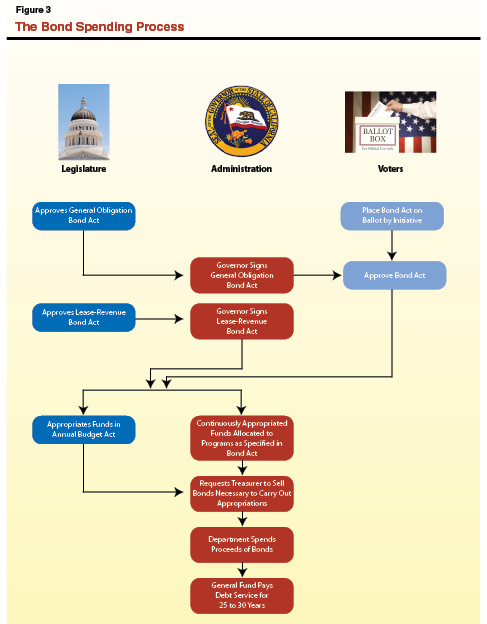
General obligation bonds accounted for almost three–fifths of the state's total infrastructure spending over the last decade. Passing a general obligation bond and placing it before the voters requires a two–thirds vote in the Legislature. Alternatively, proponents can gather signatures through the state's initiative process to place a general obligation bond before voters. In either case, general obligation bonds must be approved by a majority of voters in order to take effect. The debt service on most general obligation bonds is directly paid for by the General Fund, although some bonds are paid off from designated revenue streams.
Lease–revenue bonds, which accounted for 5 percent of the state's total infrastructure spending, are the second type of bond. These bonds do not require voter approval and instead can be authorized by the Legislature. During the last decade, the state spent $5.5 billion in lease–revenue bond proceeds. Lease–revenue bonds are paid off from payments (primarily financed by the General Fund) by the state agencies using the facilities they finance, but their payment is not guaranteed by the General Fund to the same extent as general obligation bonds. As a result, they typically have somewhat higher interest and issuance costs than general obligation bonds.
Traditional Revenue Bonds. The state also utilizes revenue bonds to finance infrastructure projects. Rather than being supported by the General Fund, these bonds are paid off from a designated revenue stream—usually generated by the projects they finance—such as bridge tolls or water contract payments. These bonds usually do not require voter approval. The State Water Project and university systems issue most of the state's revenue bonds.
Infrastructure Planning and Decision Making
Planning, prioritizing, and developing the state's infrastructure is a long–term, multistage process. As described below, the administration, Legislature, and voters each play distinct roles in this process.
Administration Leads Planning Process. The administration is responsible for identifying statewide infrastructure needs and developing proposals for their funding. Specifically, Chapter 606, Statutes of 1999 (AB 1473, Hertzberg), directs the Governor to annually submit a statewide five–year infrastructure plan and a proposal for its funding. The statewide plan is a consolidation of individual five–year plans developed by state agencies. Departments are expected to evaluate their infrastructure needs for the next five years and compare that with existing infrastructure to determine their net infrastructure need. The Department of Finance (DOF) then consolidates the departments' plans to provide a coordinated picture of the state's capital investment needs. The administration has not provided a statewide five–year infrastructure plan since the Governor's 2008–09 budget proposal.
Legislature Makes Infrastructure Investment Decisions. After the administration makes its infrastructure proposals, the Legislature is responsible for prioritizing infrastructure investments and authorizing funding in legislation and the annual budget act. The Legislature makes most infrastructure investment decisions by authorizing bond acts. As described above, the Legislature can authorize general obligation bonds to go before the voters or directly authorize lease–revenue bonds or special funds for infrastructure purposes. Through the process of passing bond acts, the Legislature has significant control over the amount and type of infrastructure the state funds. The statewide five–year infrastructure plan is meant to assist the Legislature in making these infrastructure decisions. For example, the 2006 five–year infrastructure plan (combined with the Governor's self–initiated Strategic Growth Plan) provided the Governor's vision for the 2006 bond package. Some elements from the plan were not included in the final bond package and the Legislature added some new programs, such as housing.
In addition to authorizing bond acts for a general type of infrastructure (for example, K–12 facilities, prisons, or water resources), the Legislature typically also further allocates funding to specific purposes within a bond act. For example, the most recent K–12 school bonds dedicated specific amounts to new schools, existing schools, overcrowded schools, charter schools, career technical facilities, and high–performance or "green" schools. In total, the $42.7 billion 2006 bond package included 67 pots of money spread across the five bond acts.
Annual Budget Further Directs Infrastructure Spending. After bonds are authorized, most bond programs still require future legislative action to appropriate funding in the annual budget act before state departments can begin spending or distributing the funds. Additionally, the Legislature can direct General Fund and special funds to infrastructure through appropriations in the budget act. As such, the budget act allows the Legislature to control when funds are spent and to maintain oversight over infrastructure spending. The Governor begins the process by including infrastructure proposals in his proposed budget that should correspond to departments' five–year plans. In some cases, the budget act appropriates funding for individual projects while in others the Legislature appropriates lump sum amounts for state agencies or commissions to disburse based on established criteria. Spending for a limited number of infrastructure programs is continuously appropriated, meaning that a legislative appropriation is not required before designated revenues or bond proceeds can be spent. In most cases, the Legislature has little or no control over continuously appropriated funds.
Administration Supervises Infrastructure Development and Sale of Bonds. After the Legislature appropriates infrastructure funds, the administration is responsible for carrying out the projects or distributing the funds to local governments. The DOF estimates departments' cash needs for carrying out authorized projects and—in conjunction with the Treasurer—determines the necessary amount of bonds to sell. Determining the size of bond sales and the distribution of bond funds to departments provides the administration some control over the pace of bond expenditures and projects. Once funds are provided, departments carry out the infrastructure spending with varying levels of oversight—including direct reports to the Legislature and DOF, periodic audits, and supplying information to the state's accountability website.
Voters Also Have a Role in Infrastructure Funding. In addition to considering general obligation bonds placed on the ballot by the Legislature, voters can authorize general obligation bonds without the Legislature's involvement through the initiative process. Initiative bond measures, however, are a relatively small part of the state's bond spending. Since 2000, voters have enacted $14 billion in initiative bond measures, compared with $82 billion in legislative general obligation bond measures. Recent bonds authorized through the initiative process include $980 million for children's hospitals (Proposition 3, 2008), $5.4 billion for environmental protection and natural resources (Proposition 84, 2006), and $3 billion for stem cell research (Proposition 71, 2004).
Infrastructure Spending by Program
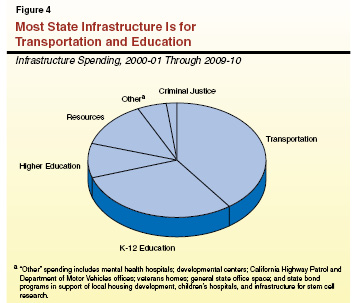
Most Infrastructure Spending Is for Transportation and Education. As shown in Figure 4, transportation projects make up the largest amount of state infrastructure spending. Education facilities (K–12 and higher education) also received a significant share of the state's infrastructure resources. While spending fluctuates from year to year depending upon the availability of funding and the timing of project expenditures, spending for transportation, resources and environmental protection, and criminal justice trended upwards over the decade. As discussed in later chapters, much of the increased spending in these programs came from the large bond measures approved since 2006.
More Than Half of Infrastructure Spending Is Local Assistance. Almost three–fifths of the state's total infrastructure spending over the last decade was distributed to and administered by local agencies. For example, nearly all of the state government's spending supporting infrastructure for K–12 schools and community colleges is local assistance. Approximately 43 percent of the state's transportation infrastructure resources are used by local agencies for local streets or transit, and 43 percent of state infrastructure spending for resources and environmental protection programs is distributed as grants to local agencies. In some cases, state support is contingent upon matching funds from local sources, while other grants have no matching requirements.
Additional Infrastructure Spending Planned. Current bond authorizations would result in increased expenditures for some programs over the next few years. For example, the Legislature has authorized substantial spending from lease–revenue bonds to support infrastructure for state prisons and trial court facilities, and voters have authorized $10 billion for the development of a high–speed rail system. To date, these programs have used only small amounts of this bond authority, but many projects are expected in the next five years. The Legislature also has authorized placing a general obligation bond measure totaling $11 billion before voters in 2012 to support the state's water infrastructure. Other programs—such as higher education—have essentially exhausted authorized bond funds and would require additional authorizations from the Legislature or voters to pursue more projects.
Budgetary Effects of Infrastructure Spending
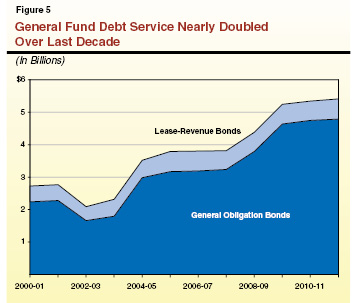
Debt–Service Costs Have Increased Substantially. The major budgetary effect of the state's infrastructure investments is the debt–service costs for principal and interest payments on the state's two types of General Fund bonds. We estimate that General Fund costs for debt service on these bonds will be about $5.5 billion in 2011–12 based upon anticipated bond sales. As shown in Figure 5, General Fund debt–service costs have almost doubled since 2000–01. As a result, the growth of the state's General Fund debt–service costs has outpaced spending growth in most other major state programs during the last decade. If viewed as a program, infrastructure debt service is one of the most rapidly growing costs of state government. This is partly the result of the state's increased use of bonds over the last decade as well as the slowing of expenditures in most other programs since 2007–08 due to the state's fiscal shortfall.
Infrastructure Investments Often Lead to Higher Operating Costs. Investments in new infrastructure typically result in ongoing increased operating costs for staffing, utilities, and maintenance of new facilities. For example, additional prison facilities require more prison guards, and the acquisition of park land requires additional park employees to supervise the land and possibly future infrastructure investments to develop the parks for the public. On the other hand, some infrastructure investments (such as renovations or replacements) can improve operational efficiency—for example, lowering energy costs or enhancing program delivery.
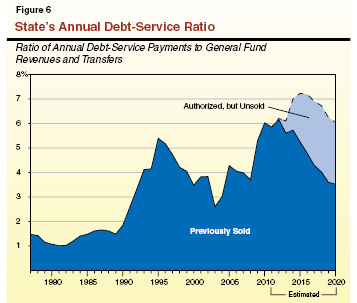
Debt Service Expected to Increase. In addition to the state's debt–service costs for bonds it has already issued, voters or the Legislature have authorized an additional $46 billion of infrastructure bonds that have not yet been sold. As these bonds are sold over the next few years, the state's debt–service costs will increase. One indicator of the state's debt–service burden is the debt–service ratio (DSR)—that is, the ratio of annual General Fund debt–service costs to annual General Fund revenues and transfers. As shown in Figure 6, California's DSR has historically been at or below 4 percent. The sharp, recent fall–off in General Fund revenues due to the recession as well as the sale of the large bond measures approved in the last decade have pushed the DSR to about 6 percent. In Figure 6, we forecast the DSR will peak at slightly above 7 percent. The actual DSR in the coming years, however, would be affected by a variety of factors:
- Pace of Sale of Authorized Bonds Could Vary. Our forecast assumes that the remaining $46 billion in authorized bond funds are sold over the next decade, with the majority sold in the next few years. To the extent the Legislature limited bond appropriations or the administration delayed bond sales, the DSR would not increase as much as forecast. For example, if no additional bonds were sold, then the DSR would start to decline.
- Additional Bonds Could Be Authorized. Our forecast assumes that no additional bonds are authorized. To the extent additional bonds are approved and sold in future years—such as the water bond proposed for the 2012 ballot—the state's debt–service costs would be higher than projected in Figure 6.
- Policy Changes Could Increase General Fund Costs. In recent years, the Legislature has diverted transportation special funds to cover debt service on transportation general obligation bonds that would otherwise be covered with General Fund revenues. Changes to this policy or others could affect the DSR.
- General Fund Revenues Could Grow at a Different Pace. General Fund revenues are a key component in determining the DSR. If, for instance, General Fund revenues are less than forecast, then debt service as a percentage of General Fund revenues would be greater.
- The State's Borrowing Costs Could Change. The interest rate on the state's bonds is a function of the supply and demand for government bonds and the state's credit rating. Interest rates on government securities are at historically low levels, but the state's low credit rating prevents California's bonds from receiving the lowest rates. (See nearby box for further discussion of the state's credit rating.) Changes in the bond market or the state's credit rating could affect the interest costs on the state's future bond sales.
What Is California's Credit Rating?
California's credit ratings for general obligation bonds currently are scored as A–, A1, and A–, respectively, by the nation's three major rating agencies—Standard & Poor's, Moody's Investors Service, and Fitch Ratings. There are ten investment–grade ratings, spanning from AAA (highest) to BBB (lowest). California's ratings are currently the lowest of all states. These low ratings are principally related to the state's ongoing structural deficit rather than the amount of debt outstanding. It would appear the main adverse effect of the low ratings has been the additional interest premium the state has had to pay on its new bond issues compared with what AAA–rated states pay. For example, according to the California State Treasurer's estimate in the 2010 Debt Affordability Report, the state's 30–year tax–exempt bonds sold at interest rates that were between 0.87 and 1.72 percentage points more than the AAA average in 2009 and 2010.
|
Debt Service Involves Budgetary Trade–Offs. There is no one "right" level for the DSR. It simply provides an indication of the relative priority of debt service and infrastructure compared to other spending from the General Fund—a higher DSR would appear to indicate an increased preference for infrastructure spending relative to other programs. This is because the higher the DSR is and more rapidly it rises, the more debt–service expenses limit the use of revenues for other programs. That is, for any given level of state revenues, each new dollar of debt service comes at the expense of a dollar that could be allocated to another program area, whether education, health, social services, or tax relief. The trade–offs have become more acute due to the state's ongoing budget shortfalls.
In addition to these General Fund impacts, debt–service costs also limit revenues available for special fund programs. For example, the state's trial courts have increased fees in recent years in order to raise revenue for debt service on new courthouse construction and the state uses vehicle weight fees to cover transportation debt service. Using these revenues for infrastructure debt service means that they are not available for other program purposes.
Cross–Cutting Infrastructure Issues
In the following chapters, we provide a look at major components of the state's infrastructure program: transportation, K–12, natural resources, higher education, and criminal justice. Each chapter focuses on some issues that are unique to that program, but also highlights issues that cut across all state infrastructure programs. We discuss some of these cross–cutting infrastructure issues below.
Infrastructure Data Are Limited. The state does not have a comprehensive inventory of its infrastructure. The level of available data varies significantly by program, but typically does not provide adequate information to evaluate facility conditions, calculate capacity, and analyze infrastructure spending. The lack of data makes prioritizing spending and measuring outcomes difficult.
Funding for Many Infrastructure Programs Lacks Stability. As mentioned above, the state has increasingly relied on general obligation bonds to fund infrastructure projects. This funding approach usually does not provide a stable funding source for state infrastructure projects. Instead of being funded on a relatively steady basis, infrastructure programs must wait to see if a bond authorization is placed on the ballot and voters approve the measure. This has led to a "boom–bust" experience.
Policy Changes Could Reduce Demand for Infrastructure. The new infrastructure proposed in most state plans generally assumes that programs and services are provided in the same manner as they are today. As we highlight throughout this report, spending requirements for new infrastructure can be reduced through various policy changes that decrease demand for state–funded infrastructure. Such demand management policies include better utilization of existing facilities and higher user fees. Altering or reducing the scope of state services also could reduce the need for new infrastructure investments.
Assignment of Funding Responsibilities Could Be Re–Examined. A basic consideration for the state is which specific infrastructure programs should be financed with state resources. Currently, the state pays for state–owned infrastructure, but also provides substantial infrastructure funding to local governments and the private sector. As noted above, a majority of the state's infrastructure spending supports local government infrastructure. The K–12 schools and local transportation programs receive the most state infrastructure funding, but state funds also support local projects for water quality, parks, and jails. Recent bond acts also have made funds available for projects that typically are funded with private resources such as certain water projects, housing developments, and hospitals. Under certain circumstances, it may be appropriate for the state to provide funding assistance to local governments and the private sector. In other cases, local governments or the private sector could be responsible for a greater share of the cost of infrastructure. In order to adequately address the state's infrastructure responsibilities within its limited resources, the Legislature may need to reconsider the division of financial responsibilities between state and local government and the public and private sectors.
Rehabilitation and Maintenance of Existing Infrastructure Is Inadequate. Despite investments over the last decade, the state faces a growing backlog of deferred maintenance and aging infrastructure due to several factors. Much of the infrastructure in California was built decades ago and is approaching the end of its useful life. The need for renovation has been exacerbated because of insufficient spending for routine maintenance and repair of facilities. Lastly, policy and spending decisions have tended to favor investments in new infrastructure rather than rehabilitation of existing systems.
Transportation
The state's transportation system—primarily highways, streets and roads, and transit operations—helps to move people and goods around and through the state. Development and maintenance of the highway system is primarily the state's responsibility, while streets, roads, and transit systems are primarily controlled and maintained by local entities. Historically, each of the systems have been funded from various federal, state, and local sources.
Funding Trends
The state spends more on transportation than it does on other types of infrastructure. Funding for transportation infrastructure, however, has changed over the past decade.
$81 Billion Spent in Last Decade. State spending on transportation infrastructure totaled about $81 billion during the past ten years. As shown in Figure 7, approximately half of these funds came from state sources, including about $33 billion from special funds (such as the excise tax on fuels) and $8 billion from bond funds. The remainder came from non–state sources, including $30 billion from federal funds. While the amount of funding has fluctuated from year to year, it has generally increased over time. Total funding has averaged about $10 billion annually over the last three years.
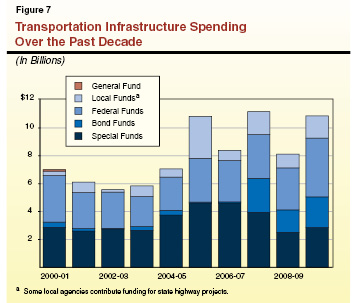
Various Factors Impact Special Fund Spending on Infrastructure. Various ongoing revenue sources—such as state taxes on fuels and vehicle weight fees—support transportation infrastructure. As shown in Figure 7, the infrastructure spending supported from these special fund revenue sources is at about the same level in 2009–10 as it had been ten years before. In 2007–08, the state began using special funds to help out the General Fund resulting in a decrease in infrastructure spending from this source. In addition, over the past decade, special fund spending for programs that we have not categorized as infrastructure have increased.
Increased Spending Provided Through Bonds. In recent years, a growing proportion of transportation funding has come from general obligation bonds passed by the voters. Funding from bonds has increased from an average of 3 percent of total transportation spending at the beginning of the decade to an average of 21 percent in the last three years. This increase is due mainly to Proposition 1B, a $20 billion transportation bond measure that was authorized by voters in 2006. In addition, in 2008, voters approved Proposition 1A to provide $10 billion in bonds for high–speed rail and local transit systems. The state's increased reliance on bond funds to finance transportation projects will put additional pressure on the state's General Fund as these bonds are sold. We estimate that annual debt service on transportation bonds will increase from roughly $700 million in 2010–11 to $2.3 billion in 2020–21 if the state moves forward with selling already authorized bonds at the projected rate. (Currently most of transportation's debt–service obligations are paid with special funds, reducing the effect on the General Fund.)
Transportation Funding Less Predictable. During the last ten years, there has been tension among state and local entities over the competing potential uses of revenues for state highway and local roads projects and public transportation. This tension arises because there is always more demand for transportation projects than there are revenues available for these purposes. In addition, due to the state's severe and ongoing fiscal problems, transportation funds have been used to help balance the state's General Fund budget. This competition for funds is evidenced by the series of legislation and voter–approved initiatives that have been enacted since 2000 which attempt to govern the use of specific pots of transportation funding. These abrupt shifts in funding have resulted in an inconsistent level of funding for transportation projects from year to year. Such instability makes it difficult for the state or other entities to plan and deliver projects, which in turn can lead to project delays that can often make projects more costly.
Major Elements Of Transportation Infrastructure Spending
The state allocates funding to four major types of transportation infrastructure. As shown in Figure 8, most state transportation infrastructure spending is for state highways and local streets and roads. In addition, the state invests in mass transportation infrastructure and California's proposed high–speed rail system. Below, we discuss spending trends in these areas.
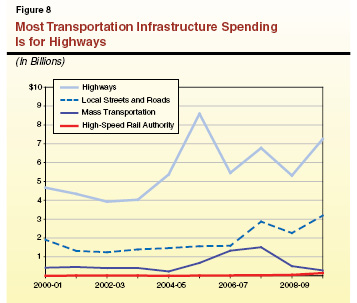
Most Spending Is for Highways. The state's highways carry 55 percent of all traffic in California (as measured in vehicle miles of travel). The state, therefore, directs the majority of its transportation funding to highway infrastructure projects. During the last ten years, the state has spent about $56 billion on highway infrastructure. This includes payments to contractors for construction work and staffing to design and oversee projects built as part of the state's highway system. This sum does not include spending by the California Department of Transportation (Caltrans) on routine maintenance of the state's highways. As shown in the figure, spending on highway projects has increased in recent years. This is mainly due to the infusion of bond funds described above, which has augmented traditional transportation funding.
Despite the significant investment in the state's highways, the most important indicators for measuring the outcome of highway expenditures have not shown improvement. For example, the capacity and congestion levels of the highway system have not improved. Traffic congestion on the state's highways increased 11 percent from 2000 to 2007. These investments also did not result in a notable increase in the overall capacity of the state's highways. This is likely due to various factors, including the planned highway system is close to being fully built out, a focus on operational improvements over the addition of new highway miles, and the relinquishment of some roadways to local agencies. Highway expansions are costly and often difficult to build due to limited available space in developed areas. Because of these factors, the state is no longer able to address traffic congestion through expansion projects alone. Caltrans has begun to use other approaches to relieving traffic congestion, such as various operational improvements.
Additionally, the condition of the state's highways appears to have degraded significantly over the past decade. Specifically, the estimated annual cost to replace extremely degraded portions of state highways has more than doubled from 2005 to 2009 to over $6 billion. Caltrans, however, is currently only spending roughly $1.5 billion annually for these purposes. In addition, Caltrans spends only about 10 percent of its budget on routine maintenance of its infrastructure investments. As a result, as of 2007, only 28 percent of the state's highways were rated in good condition by the Federal Highway Administration (based on an annual International Roughness Index survey). According to the same survey, 48 percent of the state's highways are in acceptable condition and 24 percent are in poor condition.
Funding for Local Streets and Roads Continues to Increase. A portion of state and federal transportation funds goes to cities and counties for local streets and roads infrastructure, which carry the remaining 45 percent of vehicle miles of travel in the state. Over the past ten years, about $19 billion has gone to local entities. During this time, annual state funding for local roads has increased. Despite these investments, local agencies report that they have substantial unmet road needs.
Mass Transportation Capital Expenditures Have Varied Over Time. The amount of annual state funds expended for mass transportation capital projects has varied from roughly $200 million to $1.5 billion over the past ten years. Over this time, the major source of funds has shifted from special funds to bond funds. However, it is likely that the use of bond funds for capital projects will decline over the next few years as the Proposition 1B resources diminish. As an alternative, transit operators may use a greater share of the funds provided by the State Transit Assistance (STA) program for capital projects. The STA is a state subsidy allocated by formula to transit operators throughout the state that can be used for capital outlay or operations. Recent legislative changes will provide increasing levels of funding for STA. While only about 20 percent of STA has been used for capital projects in the past, it is unclear whether local transit operators will use more of this funding for capital expenditures as the overall amount of STA increases and other sources of capital funding decrease.
Future Spending for High–Speed Rail Is Uncertain, but Potentially Significant. State spending for the high–speed rail system has been relatively minor over the past ten years compared with other types of transportation spending. Depending on the state's progress in implementing this large–scale project, high–speed rail expenditures could potentially become a significant portion of total transportation spending. The High–Speed Rail Authority (HSRA), which is responsible for implementing the project, expects spending to grow to several billion dollars annually over the next few years. Because all state funding for the project comes from bonds, debt–service costs paid from the General Fund could likewise grow significantly. At this time, however, HSRA is facing many obstacles in beginning construction of this project and the attainment of the funds needed to build the high–speed rail line is highly uncertain.
Issues for Legislative Consideration
Under the policies of the last decade, key measurements indicate that performance and conditions of the state highway system have deteriorated. At the same time, increased bond spending is expected to put additional pressure on the General Fund, special fund revenues available for infrastructure have decreased, and there continues to be more demand for transportation projects than there are available resources. The Legislature could consider the following issues.
Highway Spending Should Focus on Maintenance and Repair. Existing highway infrastructure is a valuable and necessary asset. However, as noted above, Caltrans spends only a small portion (10 percent) of its total budget on maintaining the state's transportation infrastructure. Poor maintenance appears to be contributing to the increasing need to completely rebuild portions of the state's highways, which is significantly more costly than making routine repairs. The Legislature could place a higher priority on routine highway maintenance and focus on eliminating the sizeable backlog of major road reconstruction projects. For example, some available transportation funding could be redirected from highway expansion projects to highway repairs.
Managing Demand Could Improve Performance of Existing Infrastructure. Better management of the state's transportation system could help to maximize the use of the existing system and potentially reduce the demand for limited funds. Generally, such an approach is referred to as "demand management." Specific strategies can range from "congestion pricing" to "intelligent transportation systems" (ITS) that use technology to smooth out traffic flows. Congestion pricing factors periods of heavy traffic flows into the cost of driving borne by a motorist. For example, the toll on a road may fluctuate depending on traffic conditions, going higher in peak periods or lower in other times. The ITS approach involves the use of ramp meters, traffic lights, and changeable message signs to ensure more efficient use of roadways. In addition to technological approaches, changes in land–use policies could also be used to manage demand for transportation. For example, current efforts to implement Chapter 728, Statutes of 2008 (SB 375, Steinberg), could encourage land–use patterns and transit–oriented development that could reduce future traffic demand.
Consider Different Sources of Revenue. In the long term, we think the Legislature should evaluate new strategies to ensure that more stable and adequate sources of transportation revenues are available. Advancements in technology have opened up new options for charging drivers for the benefit of using the state's roads. For example, motorists could be charged based on the number of miles they travel rather than the amount of fuel they purchase. In this way, charges would more closely match an individual's usage. Significant research is needed to determine if a mileage–based funding system is feasible for California, and if so, how such a system would best be implemented and its impact on individual motorists and the California economy.
Consider Taking Actions to Improve Successful Development of High–Speed Rail. As stated earlier, the dedication of billions of dollars over the next several years to begin construction of a new high–speed train system would add to the state's General Fund debt–service costs. Notwithstanding the potential merits of the project, the Legislature currently has the opportunity to make critical decisions relating to the project. If the project does move forward, a more effective governance structure could help to remedy some of the serious problems faced by the high–speed rail project and improve its chances for success. For more specific recommendations on high–speed rail, see our recent publication, High–Speed Rail Is at a Critical Juncture (May 2011).
K–12 Schools
The state provides bond funding for K–12 school facilities through the School Facility Program (SFP). Operated by the State Allocation Board (SAB) and Office of Public School Construction (OPSC), SFP provides funding for a variety of school facility projects. Most programs in SFP require matching funds from school districts. In this chapter, we discuss the funding provided from SFP and the requirements for participation in the program. We also discuss district demand for facilities and highlight major school facility issues for the Legislature to consider.
Funding Trends
Voters Have Approved $29 Billion in State Bonds Since 2000. As Figure 9 shows, bonds have provided about $18 billion to construct new schools and classrooms and nearly $9 billion to modernize school facilities. Most of the funding for new construction and modernization is provided on a first–come, first–serve basis to any eligible school district. In addition to funding for new construction and modernization, each of the ballot measures set aside funding for specific types of school facility construction, such as green schools and career technical education. These funds for specialized purposes can be used for new construction or renovation.
Figure 9
State Has Approved $29 Billion in K–12 Bonds Since 2000
(In Millions)
|
|
2002
|
2004
|
2006
|
Totals
|
|
General new construction
|
$6,250
|
$4,960
|
$1,900
|
$13,110a
|
|
Overcrowded schools
|
1,700
|
2,440
|
1,000
|
5,140
|
|
Subtotals, New Construction
|
($7,950)
|
($7,400)
|
($2,900)
|
($18,250)
|
|
Modernization
|
$3,300
|
$2,250
|
$3,300
|
$8,850
|
|
Charter schools
|
100
|
300
|
500
|
900
|
|
Career technical education
|
—
|
—
|
500
|
500
|
|
Joint use
|
50
|
50
|
29
|
129b
|
|
Green schools
|
—
|
—
|
100
|
100
|
|
Totals
|
$11,400
|
$10,000
|
$7,329
|
$28,729
|
Largest Program Is New Construction. The largest piece of spending in the SFP is for construction of new facilities. (In addition to the $13 billion authorized by voters for general new construction, the SAB has transferred $1.3 billion from other bond programs to meet the demand for new school facilities.) State funding is intended to cover 50 percent of project costs, with school districts responsible for funding the remaining costs. To qualify for new construction bond funding, school districts must demonstrate that existing classroom space is insufficient to house projected student enrollment over the next five years. State grants to school districts are made on a per–pupil basis—dependent on the number of unhoused students the new facility will accommodate. Per–pupil grants are annually adjusted for inflation using the California Construction Cost Index. As we discuss in the nearby box, demand for new construction funding is primarily driven by population growth in inland counties. In addition to funding general new construction, the state has provided $5 billion for the construction of new schools in districts experiencing overcrowding (as measured by the number of students per acre of space).
New Construction Demand Driven by Population Shifts
The demand for new school facilities in California exists despite relatively little overall growth in K–12 enrollment over the past ten years. (Average annual growth was less than 1 percent between 2000–01 and 2009–10.) The average overall growth rate, however, masks changes in population growth among the various regions of the state. Specifically, while many of the larger urban areas experienced significant declines in enrollment over the past ten years, several areas—primarily suburbs and inland counties—experienced significant population increases. This figure shows that enrollment growth trends across the state are expected to follow the same pattern into the next decade. These shifts in the population increase the demand for new facilities to accommodate the enrollment growth in certain areas of the state. 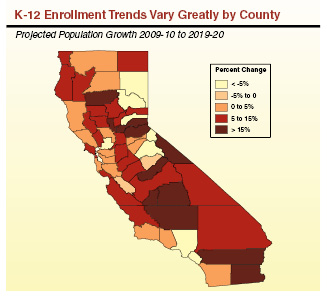
|
State Provides Larger Match for Modernization Projects. The second largest piece of state spending is for the modernization of existing schools. To provide a greater incentive for school districts to modernize rather than build new schools, the state provides a higher match for modernization projects (60 percent rather than 50 percent). School districts qualify for modernization funding if their facilities are more than 25 years old. As with new construction, the state provides per–pupil grants. The state aid per pupil is greater if the renovation is for a facility that is more than 50 years old.
State Also Provides Incentives to Undertake Specific Types of Facility Projects. Over the past ten years, state bonds for K–12 facilities also have set aside funding for specific types of school facility construction. The state has provided $900 million for the construction of new charter school facilities, $100 million for school districts to build environmentally friendly (or green) schools, $500 million for the construction of career–technical education facilities, and $130 million for joint–use facilities. With the exception of funding for green schools and joint–use facilities, participants receive per–pupil grants for each project. Participants in these programs are also subject to the same matching requirements that apply to other new construction and modernization projects.
Districts Rely on Local Bonds to Provide Matching Funds. Although school districts have a number of options for obtaining matching funds for facility projects, the majority of matching funds come from local general obligation bonds approved by voters in school districts. Approval of these bonds has become easier due to the passage of Proposition 39 in 2000, which reduced the threshold for the approval of K–12 and community college general obligation bonds from two–thirds to 55 percent. As Figure 10 shows, since 2000 voters statewide have approved about $61 billion in local general obligation bonds for school facilities.
Figure 10
Local General Obligation Bonds for School Facilities Since 2000
(In Millions)
|
|
School
District
|
School Facility
Improvement District
|
Total
|
|
2000
|
$2,464
|
—
|
$2,464
|
|
2001
|
2,275
|
—
|
2,275
|
|
2002
|
9,812
|
$260
|
10,072
|
|
2003
|
573
|
—
|
573
|
|
2004
|
7,757
|
49
|
7,805
|
|
2005
|
5,517
|
28
|
5,545
|
|
2006
|
6,707
|
249
|
6,956
|
|
2007
|
388
|
750
|
1,138
|
|
2008
|
20,937
|
592
|
21,529
|
|
2009
|
69
|
—
|
69
|
|
2010
|
4,323
|
35
|
4,358
|
|
Totals
|
$60,822
|
$1,963
|
$62,785
|
Some Districts Use Other Local Revenue Options. Local communities can also approve general obligation bonds for facilities using School Facility Improvement Districts (SFIDs). When school districts have facility needs in a portion of a school district's territory, the district can create an SFID consisting of the specific areas with facility needs. The voters in the SFID can then vote to approve a general obligation bond for facilities in that specific area. As Figure 10 shows, voters approved almost $2 billion in SFID general obligation bonds for facilities since 2000. (Local communities can also create a Mello–Roos district to issue bonds for infrastructure in the community. In the past ten years, however, no Mello–Roos bonds have been approved by voters for school facilities.) In addition to local general obligation bonds, some districts rely on other sources of revenue to provide a local match. Most notably, some districts—particularly those in areas with significant new residential development—rely heavily on developer fees as a source of facility revenue. On rare occasions, school districts also use parcel tax measures to raise funds for school facilities. School parcel taxes require approval by two–thirds of the district's voters. Since 2000, four school districts have approved parcel taxes dedicating some portion of the funds for modernization or expansion of school facilities.
Financial Hardship. School districts that are unable to provide a local match for the construction or modernization of a school facility can apply for financial hardship funding and receive up to 100 percent funding. In order to qualify for this funding, school districts must be audited by OPSC to verify that the district has insufficient funds to meet its full local match. As a condition of receiving financial hardship funds, projects are subject to strict budget constraints to prevent districts from enhancing projects.
Districts Use Operations Funding for Maintenance of Facilities. As part of the requirements of receiving state bond funding, districts typically must set aside 3 percent of their general fund expenditures annually for routine maintenance of their facilities. In acknowledgement of limited operating budgets, however, districts are required to set aside only 1 percent of their general fund expenditures from 2008–09 through 2014–15. For many years, the state also has provided roughly $300 million annually to pay for deferred maintenance. To receive deferred maintenance funds, school districts must provide matching local funds. The deferred maintenance requirements also have been modified from 2008–09 through 2014–15. During this period, school districts are not required to provide a local match and can use deferred maintenance funds for any educational purpose.
Williams Settlement Created Additional State Program. In 2004, the state settled the Williams v. California case, a class–action lawsuit filed on behalf of public school students. The lawsuit argued that the state was responsible for insufficient instructional materials, a lack of qualified teachers, and poor facility conditions in many schools across the state. In response to the settlement, the Legislature created the Emergency Repair Program (ERP), which provides grants for critical health and safety repairs in certain low–performing schools. The state is required to provide $800 million to ERP to meet the requirements of the settlement. The state has provided $343 million for the program so far.
Spending Trends
Most State Bond Funding Allocated, but Some Unspent Funds Remain. Demand from school districts for bond funding has been consistent over the past ten years, but some funds remain unspent in several program areas. As shown in Figure 11, as of June 2011, a total of $1.9 billion in bond authority remained unallocated by SAB. The programs with relatively high levels of unallocated funds are modernization, overcrowded schools, charter schools, and green schools. (As shown in Figure 11, SAB has awarded an additional $2.1 billion to approved school projects, but these allocations remain on hold until the state sells additional bonds to fully fund the projects.)
Figure 11
$1.9 Billion in State Bond Funding Still Available
(In Millions)
|
|
Allocated
|
Approved
Projects on Holda
|
Available
|
|
New construction
|
$13,615
|
$556
|
$503
|
|
Modernization
|
7,489
|
611
|
750
|
|
Overcrowded schools
|
2,781
|
376
|
425
|
|
Charter schools
|
258
|
509
|
133
|
|
Career technical education
|
377
|
91
|
33
|
|
Joint use
|
174
|
—
|
1
|
|
Green schools
|
21
|
6
|
73
|
|
Totals
|
$24,715
|
$2,148
|
$1,917
|
Difficult to Determine Future Need. Despite the significant investments in K–12 school facilities over the past decade, the lack of statewide data makes determining future need very difficult. The state has no comprehensive inventory of school facilities, their capacity, and unmet need. Reporting from school districts on existing capacity occurs only when districts apply for funding. As a result, it is not clear if state and local spending over the last decade on K–12 infrastructure has substantially reduced K–12 infrastructure needs. Based on the pace of recent expenditures, however, it appears many districts continue to seek and qualify for state facility funding. For example, at the close of 2007, $2.7 billion in state new construction bond funds remained unallocated. By the close of 2010—despite the state's severe economic downturn and the freezing of state bond funds—only $500 million of these funds remained unallocated, and $178 million in new construction projects were awaiting review by SAB.
Issues for Legislative Consideration
In the last decade, the state spent over $30 billion on K–12 school facilities. As described above, it is difficult to measure whether this spending has substantially addressed K–12 infrastructure needs in California or (as appears more likely) if facility needs remain high. Assuming significant need remains, the Legislature may want to reconsider California's school facilities funding model because the state's capacity to provide a similar level of bond support to K–12 schools over the next decade likely will be constrained due to the state's fiscal problems. Given that K–12 infrastructure spending accounted for almost 50 percent of the state's general obligation bond spending from 2000–01 through 2009–10, any effort to control the escalation of state debt–service costs likely will have to include some reduction in the pace of K–12 infrastructure spending. As a result, the Legislature may want to consider some of the options described below for prioritizing state K–12 infrastructure spending.
Whether the Legislature continues with the status quo or adopts some of these alternate policies, however, the state needs better data on K–12 facilities. The lack of a reliable estimate of the need for K–12 infrastructure and the associated costs makes it difficult to determine the best options for state funding. Without such data, policymakers and stakeholders cannot determine the proper size of future general obligation bond proposals or the specific amounts for various programs such as new construction or modernization. Some estimate of infrastructure demand and cost—such as a sampling of district needs—would provide better data than the state currently utilizes in making funding decisions. With some facility data, the state would have better information to project future needs and determine reasonable estimates for the amount of future general obligation bonds.
Reducing State Share of Cost. The Legislature could reconsider the share of costs it currently covers (50 percent for new construction, 60 percent for modernization). Contributing a smaller share to each project would allow limited state funds to support more projects. Given local support for school facility funding, a decrease in state spending could be offset by more local spending, thereby minimizing the impact on school districts. Local voters have been willing to approve local school facility bonds. Since the enactment of Proposition 39, 83 percent of school facility bonds requiring a 55 percent vote have been approved. The high approval rate has continued during the economic recession: 77 percent of school facilities bonds requiring a 55 percent vote were approved in 2009 and 2010. Realigning more funding responsibility to the local districts would also create incentives for districts to better maintain and manage existing facilities.
Develop a System for Prioritizing Funding. As stated above, the state generally offers its bond money on a first–come, first–served basis. This process worked adequately over the past decade when bond funds typically have been available to support all eligible projects submitted to SAB. If smaller bond amounts are available for K–12 schools over the next decade, however, school districts will likely exhaust the state's bond proceeds before all school projects have been funded. Under this scenario, a first–come, first–served system would not necessarily allocate construction aid to districts where the need is greatest. The Legislature instead could establish broad categories for awarding future bond allocations on a priority basis. For example, the first allocation of bond funds could be reserved for school districts with the oldest buildings, the most overcrowding, or the largest percentage of unhoused pupils. The state could also reserve funding for financially needy school districts that have insufficient local revenues to build essential facilities. In this way, state funding would support projects that otherwise would not have been built absent a state facility program. A broad prioritization system would ensure that limited bond funds are reserved for the most critical projects.
Explore Different Financing Tools for School Facilities. Given the problems inherent in evaluating and prioritizing the infrastructure demands of over 9,000 schools, the Legislature could take a different approach to facility financing. One such approach would be to provide equal per–pupil funding to all school districts. This approach would provide school districts with a predictable and stable funding source and more control over how these funds are used. In adopting this approach, the state probably would need to provide transition funding to districts with large unmet facility needs in order to bring district facility conditions to a level that could be accommodated within the ongoing per–pupil funding amount. In our 2001 report, A New Blueprint for School Facility Finance, we outline one way to transition from the current bond–funded program to a program funded on a per–pupil basis using ongoing General Fund appropriations.
Resources
Over the last decade, the state has provided more than $13 billion for state and local resources–related infrastructure. Most of this funding has come from bond funds. Infrastructure spending in the resources area covers a wide array of programs and projects. For example, funds were spent on land acquisition and restoration for resource conservation purposes, infrastructure to improve environmental quality, flood management and water supply projects, state park facilities, forest fire stations, and fish hatcheries.
Funding Trends
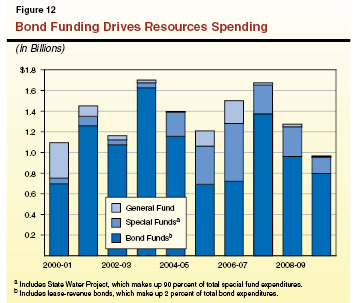
Major Reliance on General Obligation Bonds. As shown in Figure 12, about three–fourths of the $13 billion in spending over the last decade came from general obligation bond funds. Most of the remainder came from water user fee special fund revenues—the primary means of support for the State Water Project (SWP) operated by the Department of Water Resources (DWR).
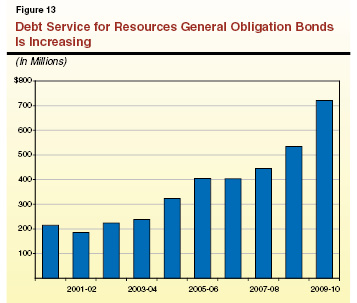
Significant Increases in Debt–Service Costs. Voters have authorized close to $20 billion in general obligation bonds for resources since 2000 (about one–third of these bonds remain unsold). Unlike bond measures issued in prior decades, recent bond measures have been larger (typically several billion dollars) and wider in scope (covering a broad array of resources issues in a single measure, such as parks, wildlife conservation, flood management, and water quality). The large bond measures have increased state debt–service expenditures considerably, as shown in Figure 13 (see next page). General obligation bond debt–service costs are now the largest single General Fund expenditure for resources, totaling over $700 million in 2009–10. These debt–service expenditures are estimated to increase to approximately $900 million in 2010–11—a four–fold increase in these expenditures since 2000–01.
Major Portion of Spending Is for Local Infrastructure. Over two–fifths of state spending on resources infrastructure over the last decade was for local assistance, with that amount funded almost entirely from general obligation bonds. These monies support a variety of program areas, including local park projects, land conservation activities, wastewater treatment and safe drinking water infrastructure, and flood management and other water management infrastructure. Reflecting largely the variability of available bond funds from year to year, the proportion of spending on state projects versus local assistance in any given year is also highly variable.
Spending Trends and Outcomes
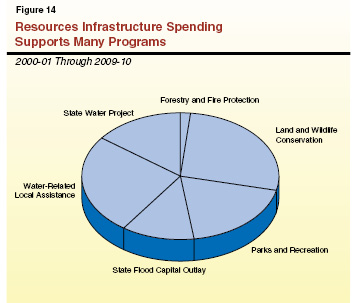
Infrastructure Spending Covered a Disparate Set of Programs. Figure 14 breaks down resources–related infrastructure spending over the last decade into six programmatic areas. As the figure shows, no one program area predominates.
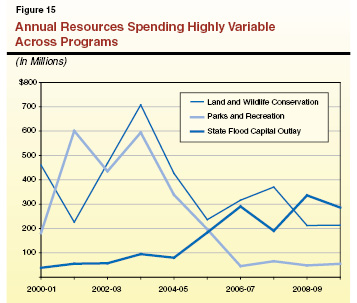
Spending Highly Variable Over Past Decade. The percentages spent on each programmatic area varied significantly year to year, again largely reflecting the availability of bond funds. As shown in Figure 15, for example, spending on parks and recreation was considerably less towards the end of the decade due to substantial depletion of available bond funds for that purpose, while spending on flood protection increased with the passage of flood prevention bonds in 2006.
What Has the State Received From Its Investments? The outcomes from the state's investments in resources–related infrastructure can be summarized as follows:
- Land Acquisition, Preservation, and Restoration. Over the last decade, resources departments have acquired a combined 1.5 million acres of land at a cost of $2.8 billion. Land acquisitions generally preserve or rehabilitate environmentally sensitive areas or habitats or expand state parks. Restoration primarily entails reconstruction of wildlife habitat, but may include the removal of pollution and other forms of rehabilitation of ecosystems. Departments with the largest total land acquisitions include the Wildlife Conservation Board (WCB), the Department of Parks and Recreation (DPR), and the State Coastal Conservancy. The WCB has also funded the restoration of 200,000 acres during this time period.
- Repair/Upgrades to Existing Infrastructure. Very few new resources facilities (levees, dams, fire stations, and state park structures) have been built during the last decade. The focus instead has been on the repair and replacement of existing infrastructure. In addition to the ongoing repair and upgrade program for SWP, DWR has repaired and upgraded 116 critical flood management sites and 117 non–critical sites, facilitated by a major influx of bond funds for flood control authorized in 2006. The DWR also operates a local levee assistance grant program. Similarly, since 1990, the California Department of Forestry and Fire Protection (CalFire) has substantially replaced about 60 of its 476 buildings and structures.
- Meeting Federal Requirements. Much of the water–related infrastructure spending has been in response to increasingly stringent federal environmental regulations. Key regulations relate to the local management or treatment of stormwater runoff and wastewater. The State Water Resources Control Board has funded 296 local wastewater treatment new facilities or upgrades and 62 non–point source treatment constructions or upgrades in the past ten years. The SWP has likewise made substantial repairs and upgrades to its dams and hydroelectric facilities to comply with Federal Energy Regulatory Commission licensing requirements.
Issues for Legislative Consideration
As noted above, the increased spending on resources infrastructure over the last decade has resulted in significant land acquisitions, repairs to existing infrastructure, and improved regulatory compliance. However, the state still faces a growing backlog of deferred maintenance and aging infrastructure. For example:
- CalFire estimates that $2.5 billion will be needed over the next five years and that roughly 20 projects need to be completed every year for the next 20 years in order to replace aging fire stations and other facilities.
- The Department of Fish and Game (DFG) operates 21 fish hatcheries that are 50 years old on average. There is also a growing backlog of deferred maintenance at DFG for maintaining the roads, parking lots, dams, water delivery systems, and buildings necessary to provide the public with access to its wildlife conservation sites.
- The local wastewater infrastructure in the state is similarly aging, requiring the state's local assistance to focus on repairs and upgrades to existing infrastructure.
- The state's aging levees require significant upgrades in the next few years to meet federal and state standards. Upgrades for six cities in the Central Valley alone are estimated to cost $5 billion.
- The DPR estimates a backlog of $1.3 billion in deferred maintenance projects that is projected to grow to $2 billion by 2020.
As noted earlier, recent resources bonds have been considerably larger compared with earlier measures. Based upon the above examples of infrastructure deficiencies, however, even if the state were to prioritize resources infrastructure investments and maintain the current pace of expenditures, it is likely demand would exceed available funds. Moreover, given the state's fiscal concerns and growing debt–service obligations, the Legislature may not wish to maintain the recent level of bond expenditures for resources programs in order to accommodate other budget priorities. In response to this challenge, we recommend that the Legislature consider the following options for prioritizing spending and identifying alternative financing tools for resources infrastructure.
Setting Priorities for Bond Expenditures. As noted above, resources–related infrastructure spending has relied heavily on general obligation bonds. In a constrained fiscal environment, proposals to spend the proceeds of state general obligation bonds warrant extra scrutiny by the Legislature. It will be important that the resources bond expenditures in the annual budget act be well justified, reflect a programmatic need, be an appropriate funding source for the activity in question, and reflect legislative priorities.
For example, the Legislature may wish to prioritize available funding to some of the renovation and deferred maintenance backlogs described above while redirecting spending from new land acquisitions and new construction. In this way, the state would address immediate and existing infrastructure demands rather than creating new infrastructure responsibilities for which there is no dedicated funding available to pay for ongoing operations and maintenance. Or the Legislature may want to prioritize available funding for projects which provide direct safety benefits, or for those that create opportunities for the state to generate additional revenues to help support state park operations.
Applying the "Beneficiary Pays" Funding Principle. On a number of occasions, the Legislature has stated its policy intent that the costs of a resources–related program or project should, to the extent possible, be paid by its direct beneficiaries. Expenditures with broad public benefits, on the other hand, are appropriately funded with state public funds (such as General Fund monies and general obligation bond funds). Where the benefits of an activity are shared between public and private beneficiaries, the application of the beneficiary pays funding principle would allocate the funding responsibility for its costs proportionally between these two sets of beneficiaries.
The funding of SWP projects offers a good example of the application of this funding principle. As referenced earlier, about 96 percent of SWP's costs have been paid from revenues raised from water users directly benefitting from the project. Outside of SWP, there are additional opportunities to apply the beneficiary pays principle to achieve substantial state savings. Revenues from beneficiaries could support direct infrastructure spending or provide an ongoing revenue source for debt–service obligations. For example, private beneficiaries have not been charged their share of costs for CALFED Bay–Delta Program projects, including some costs related to ecosystem restoration and conveyance. The Legislature could also review the way costs are split between the state and local governments for infrastructure that benefits local residents. For example, while many levees provide significant direct benefits to local populations—such as public safety and the facilitation of economic development—the state currently pays for up to 70 percent of the nonfederal share of construction costs for federally authorized flood control projects and up to 100 percent of the costs for Delta levee improvements. Recent bond acts also provide bond funding for local parks, which primarily benefit local residents.
State–Local Realignment of Some Functions. Some current resources–related state services provide primarily local rather than broad statewide public benefits. In such cases, the Legislature should evaluate the potential of realigning the responsibility for these functions from the state to local governments, thereby reducing the state's infrastructure responsibilities. For example, certain state parks predominantly serve local recreational needs rather than statewide needs and thus could be candidates for realignment to local entities.
Addressing Information Needs. California's levee system consists of state–run levees (about 15 percent of the system) and locally operated and maintained levees (about 85 percent of the system). As the Legislature considers how much the state should invest in flood control facilities, one major concern is the lack of information about the current condition of the levee system. These information gaps are problematic because the courts have found the state is potentially liable for failures of local—as well as state—operated and maintained levees. The DWR is developing an inventory of projects needed to maintain and repair state–run levees. This inventory should be completed in 2012. However, no such inventory is under way for local levees. The Legislature should consider how it can address this information gap.
Higher Education
California's public higher education system enrolls over 2 million students annually in three segments: the University of California (UC), California State University (CSU), and California Community Colleges (CCC). The three segments have approximately 150 million square feet of facility space, which include instructional space, faculty and administrative offices, and research space as well as dormitories, performance halls, athletic and recreational facilities, and other student support space. The specific mix of facilities differs by segment due to the distinct missions assigned to each. For example, UC has significant space dedicated to research because of its role as California's research university.
Funding Trends
From 2000–01 through 2009–10, we estimate the three segments spent about $41 billion on infrastructure. Support for higher education infrastructure comes from state and non–state sources. The state has traditionally provided infrastructure funding to support the segments' core academic missions. For CSU and CCC, this is mostly limited to instructional and administrative space, while the state supports those functions as well as research space at UC. The Legislature has direct control over state–funded projects because each is funded through an appropriation in the annual budget act. Through this process, the state spent $10.1 billion on higher education infrastructure in the last ten years. As shown in Figure 16, the spending varied by segment, with UC receiving the most support.
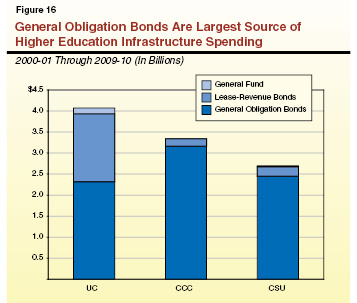
State Support Almost Entirely From Bonds. Almost all of the spending from state sources was provided from bonds—with 80 percent coming from general obligation bonds and an additional 19 percent from lease–revenue bonds. Bond spending on infrastructure has more than doubled higher education debt–service costs over the last ten years, from about $516 million in 2000–01 to an estimated $1.1 billion in 2010–11. Most of the general obligation bond spending was from bonds approved by voters in 1998, 2002, 2004, and 2006. In general, the state provides less funding to higher education projects when the balance of general obligation bonds is exhausted. In the case of UC and CSU, the state typically offsets some of this reduction by funding some projects with lease–revenue bonds. Community colleges, in contrast, have not pursued lease–revenue bonds in recent years because repayment counts toward their Proposition 98 funding allotment (and therefore comes at the expense of other CCC programs).
Local Bonds Provide Significant Amount of Community College Funding. Few community college projects are funded exclusively with state funds. Local community college districts typically contribute part of the cost for state–funded projects and pay for many projects without state support. For example, districts may choose to build instructional and administrative space without applying for state funds. Additionally, districts must pay for non–academic space (such as parking garages) with local funds because such projects are not eligible for state funding. The primary source of this local financing is voter–approved bonds. Prior to 2000, local bond measures for educational facilities required two–thirds voter approval. Passage of Proposition 39 in 2000 lowered the threshold for approval to 55 percent. Since that time, voters have approved 86 percent of local community college bond measures and at least one bond measure in 65 of the state's 72 community college districts. In total, these bond measures authorized $22.8 billion for community college infrastructure. (Because these bonds are administered locally, we do not have complete data on how much of this bond authority was spent over the last decade. While some districts quickly spend bond proceeds, others plan for each bond measure to support the district's capital outlay program for 10 to 15 years.) Based upon available information, we estimate that CCC districts spent about $12.6 billion in local funds on infrastructure from 2000–01 to 2009–10—more than three–times the amount spent from state funds on CCC infrastructure.
Non–State Funds Provide Significant Amount of University Funding. The universities rely on non–state funds to support certain types of non–academic infrastructure that the state does not typically support. Non–state sources include fees for residence halls, parking fees for parking garages, and medical center revenues for medical center space. Students also periodically vote to increase student fees in order to pay debt–service costs for the construction of student support space such as student unions and recreational facilities. Overhead fees from research grants and gifts are also used to fully finance projects or augment state–funded projects. Over the last decade, UC spent about $13 billion and CSU about $4.5 billion of non–state funds on infrastructure.
Spending Outcomes
Segments Have More Space… Each segment has more space than a decade ago—UC's academic and research space increased by approximately 25 percent, CSU's academic and administrative space by 15 percent, and CCC's academic and office space by 19 percent. As projects funded in the last few years are completed and put into operation, the segments will have more new space.
...But Is That Space Sufficient? As shown in Figure 17, the growth in space over the last decade has closely matched or outpaced enrollment growth. Each segment, however, indicates that its campuses are still operating above capacity and that the new space has not been able to accommodate new demands and address pre–existing space deficiencies. Even though minimal enrollment growth is expected in the next few years, the universities' five–year plans include projects to increase capacity for meeting "existing enrollment needs." Measuring whether the segments' amount of existing space is sufficient and appropriate is difficult. The segments measure capacity using space and utilization standards, which together determine the amount of academic space needed to meet programmatic demands. There is no consensus on the appropriateness and reliability of the standards for determining actual capacity. For example, CSU and CCC continue to use space standards that are over 30 years old, while UC uses more generous space standards developed in 1990, but never formally approved by the Legislature. Additionally, large amounts of space classified as nonstandard or "other space" are excluded from the capacity calculations. There are also some questions regarding the utilization standards, such as facility use during off–peak periods including evenings, weekends, and the summer term.
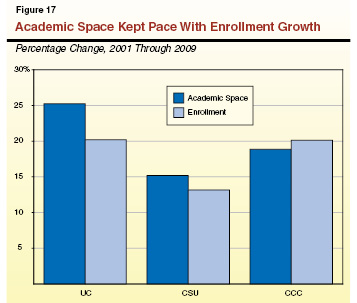
Investments in Existing Infrastructure Have Improved Some Facilities. Infrastructure spending on existing facilities has resulted in fewer seismically unsafe buildings at each segment as well as some updated facilities. For example, UC has retrofitted 74 percent of the space it identified as needing seismic upgrades since 1979. Renewal and replacement needs, however, are still significant. For example, CSU identifies 39 buildings requiring seismic retrofitting. Additionally, UC reports that over 50 percent of its state–funded facilities are more than 35 years old and CCC reports that 47 percent of its inventory is over 40 years old. As a result, the segments' facilities renewal needs are likely to increase as the systems in these buildings reach of the end of their useful life.
Identified "Needs" Continue to Grow. Despite the state's investment and the improvements described above, the segments' self–identified infrastructure needs are greater than ever. The segments' five–year plans identify state infrastructure spending exceeding $24 billion—in other words, the segment's five–year plans identify state spending that is more than double the amount spent over the last ten years. It is important to note, however, that the segments' plans include new initiatives to expand enrollment or create new programs and that many of the projects identified do not appear to be vital to the existing operation of the colleges and universities.
Issues for Legislative Consideration
Given other pressures on the state budget, the state likely will not have the resources to sustain the level of higher education infrastructure spending undertaken in the last decade, let alone the greater demand forecasted by the segments' five–year plans. In response to this challenge, the Legislature could consider other alternatives for addressing higher education's increasing infrastructure demand. Possible alternatives include reducing the demand for higher education facilities and targeting available resources to the greatest priorities.
Prioritize Spending to Most Critical Areas. The segments have identified infrastructure needs covering many purposes—including accommodating enrollment growth and initiating new programs. Given the state's limited resources, the Legislature could consider a more targeted funding approach that focuses on existing core academic facilities. Such an approach would be more cost–effective, stretching the state's spending further while encouraging the segments to use space more efficiently. Main elements of a prioritized spending approach could include:
- Focus on Renovation and Maintenance of Existing Facilities. The state could focus on ensuring that existing facilities are adequately maintained and fully utilized prior to constructing new facilities. As renovation needs alone will likely exceed the state's total resources for higher education infrastructure, the Legislature could consider significantly reducing—or eliminating—allocations for new space. Renovation projects typically cost less than new construction projects, and usually do not require additional ongoing resources for maintenance and operation.
- Reconsider Types of Space That Are State Supportable. The Legislature could also consider reducing the scope of space that the state supports. For example, state funding could focus exclusively on core instructional space—classrooms and limited faculty and administrative space. The Legislature could also require UC to take a greater responsibility for the funding of research space through the indirect cost reimbursements for facility expenses that are usually included in each research grant. The Legislature may also wish to reconsider state support of facilities for professional schools—such as business and law schools—which have a greater ability to raise outside funds. For example, the law school at UC Berkeley recently financed a $90 million addition entirely through donor gifts and student fees.
- Reconsider Level of State Support for Community College Infrastructure. As described above, the vote requirement for local bond measures was reduced to 55 percent and voters have already approved more than $22 billion in local bond measures for CCC infrastructure. In light of this improved funding capability by local districts, the state might want to reconsider the level of the state's responsibility to provide infrastructure funding for community colleges.
- Consider Policy Changes to Free Up Space for Critical Programs. The Legislature could also prioritize its programmatic support for higher education to create space for state priority programs. This could mean limiting support for professional schools or new initiatives in order to focus on undergraduate and graduate education. Or the Legislature could consider narrowing the core missions of the community colleges to exclude many physical education and other personal enrichment courses.
Segments Could Adopt Strategies to Reduce Infrastructure Demand. Adopting the above policies would represent a departure from current practices and encourage the segments to reconsider how they plan for and manage space. In our view, there are a number of reasons higher education's infrastructure demand could decrease. For example:
- Enrollment Pressure Expected to Ease. Demographic forecasts show a decline in the college–age population through the next decade. This should reduce enrollment driven pressure to expand higher education facilities. In addition, due to budget constraints, enrollment levels at CSU and CCC are well below peak levels from a few years ago. As a result, campuses have unused capacity to accommodate additional students as enrollment returns to previous levels.
- Utilization of Existing Facilities Could Improve. Each segment has unused capacity that could accommodate additional students. Virtually all campuses could accommodate more students during the summer term. As shown in Figure 18, during the summer each segment enrolls less than 30 percent of the students enrolled during the traditional academic terms. In addition, some campuses could make fuller use of their existing space and accommodate more students during the traditional academic year by scheduling more early morning, evening, and weekend classes.
- Distance Education Could Reduce Demand for New Space. Distance education—education delivered mainly over the internet or television—also could reduce infrastructure demand. By educating online those students who would have otherwise attended class in person, the segments could reduce the need to build new infrastructure.
- New Initiatives Could Be Curtailed. The segments could also limit new off–campus centers, schools, and programs. There are often alternatives that could meet the goals of the new programs more efficiently or at a lower cost, such as increasing enrollment in existing programs or using distance–education technology to allow programs to share resources across campuses. Alternatively, the Legislature could require the institutions that establish a new program to eliminate, consolidate, or reconfigure existing programs in order to create space for the new priority program.
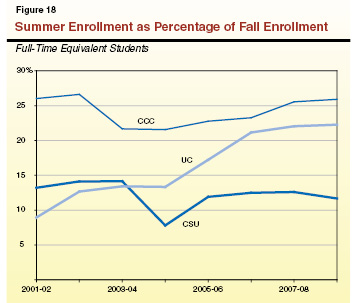
Criminal Justice
The primary goal of California's criminal justice system is to provide public safety by deterring and preventing crime, incarcerating individuals who commit crime, and reintegrating criminals back into the community. The major state judicial and criminal justice programs include the California Department of Corrections and Rehabilitation (CDCR) and the Department of Justice (DOJ), as well as the state court system. While DOJ maintains and operates 11 forensic laboratories throughout the state, most of the state's infrastructure spending on criminal justice facilities supports CDCR and the courts. While infrastructure spending for these two programs comprised less than 2 percent of total state infrastructure spending over the last decade, CDCR and the state court system have large infrastructure initiatives under way that could dramatically increase spending over the next five years.
CDCR
The CDCR is responsible for the incarceration, rehabilitation, and care of roughly 144,000 adult felons at 33 state prisons and 1,200 juvenile wards at five youth correctional facilities. The department also supervises and treats about 90,000 adult and 1,200 juvenile parolees from 205 parole offices throughout the state. In addition, CDCR operates 46 adult and juvenile conservation camps and contracts with private and public vendors for 14 adult prison facilities.
Major Drivers of CDCR Infrastructure Spending
As shown in Figure 19, CDCR spent a total of about $1.4 billion on infrastructure from 2000–01 through 2009–10. About two–thirds of this spending was supported with lease–revenue bonds, while the remainder was mostly from the General Fund. Spending on CDCR infrastructure has largely been driven by the following three factors:
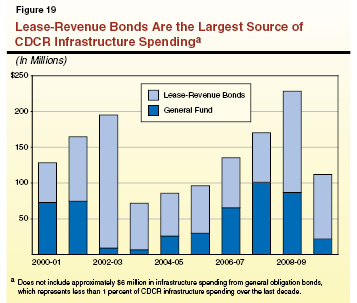
- Housing Needs. Increases in the inmate and ward population often result in the need for additional housing units, while reductions in the population can reduce housing needs. For example, a significant decline in the number of juvenile wards in recent years has allowed CDCR to close certain juvenile facilities. The state's prisons, however, have experienced significant overcrowding problems. On May 23, 2011, the U.S. Supreme Court upheld a federal three–judge panel ruling requiring the state to reduce overcrowding in its prisons to 137.5 percent of design capacity within two years.
- Program Space. In order to effectively provide rehabilitation and health care services to inmates and wards, CDCR's facilities generally require separate program space. In fact, various federal court orders have required the department to improve its delivery of these services by renovating existing or constructing new program space (such as for medical services and mental health care).
- Facility Operations. Given the age of some of CDCR's facilities, the department must periodically replace basic infrastructure systems at existing facilities (such as wastewater treatment systems). Regular maintenance of these systems can help delay the need for costly replacements. However, due to the prison overcrowding, budget reductions, and poor management practices, the department has struggled in recent years to properly maintain its roughly 40 million square feet of facility space.
AB 900 Will Significantly Increase Spending
In 2007, the Legislature enacted Chapter 7, Statutes of 2007 (AB 900, Solorio), in order to relieve the significant overcrowding problems facing state prisons and improve rehabilitation. Specifically, AB 900 authorized a total of $7.7 billion—$7.4 billion in lease–revenue bonds and $300 million in General Fund support—for a broad package of prison and jail construction initiatives, as follows:
- $2.4 billion to construct infill beds intended to replace so–called "temporary" housing in gymnasiums, day rooms, and other public spaces in prisons.
- $2.6 billion to construct "reentry facilities" primarily for inmates within one year of being released from custody.
- $1.1 billion to construct inmate health care facilities.
- $1.2 billion to help counties construct local jail facilities.
- $300 million to make various infrastructure improvements at existing prisons.
At this time, most of the funds authorized in AB 900 have not been spent. However, CDCR plans to begin construction on a number of AB 900 projects in the next five years. If these plans are implemented, spending on CDCR infrastructure will increase dramatically during this period. Most of this spending will be funded from the sale of lease–revenue bonds. We estimate that the annual debt service for the lease–revenue bonds used to construct all of the planned facilities would reach approximately $600 million. In addition, the added annual operating costs for these facilities would be about $1 billion when fully activated. Thus, when fully implemented, the facilities authorized under AB 900 could increase General Fund costs by $1.6 billion annually.
Issues for Legislative Consideration—CDCR
Reconsider Scope of AB 900 Construction Package. While AB 900 was enacted by the Legislature four years ago as an overall strategy to relieve overcrowding in prisons, the state now faces unprecedented circumstances that make the full implementation of AB 900 as initially envisioned a lower priority. Specifically, supporting the debt–service and annual operating costs of additional prison facilities would put further pressure on the General Fund. Moreover, the federal court ruling to reduce overcrowding in the state's prisons and recent state policy changes will significantly reduce the inmate population. For example, as part of the 2011–12 budget package, the Legislature approved legislation that, effective October 1, 2011, will shift responsibility for about 40,000 lower–level inmates and parole violators from the state to local governments. (For more information, please see our report
A Status Report: Reducing Prison Overcrowding in California.)
In view of the above, we believe it makes sense for the Legislature to hold off from moving forward with the infrastructure projects authorized under AB 900 with a few exceptions. In order to comply with federal court orders regarding inmate health care, certain health care projects should proceed as planned. However, the need and scope for some of these health care–related projects will likely change given that there will be significant reductions in the inmate population. Additionally, given that certain offenders will be shifted from state prison to county jails, the Legislature should proceed with the local jail construction authorized in AB 900.
Reconsider Need for State Youth Correctional Facilities. As previously mentioned, there has been a steep decline in the number of juvenile offenders housed in the state's youth correctional facilities from around 10,000 in 1995–96 to less than 1,200 today. This decline can be attributed to several factors, including a general downward trend in juvenile arrest rates and statutory changes to shift key juvenile offender program responsibilities to counties. As a result of this steady decline, CDCR has closed ten of its youth correctional facilities and camps since 2003. In addition, the remaining youth facilities and camps currently operate at only about 55 percent of design capacity. (Individual facilities range from a high of 93 percent to a low of about 12 percent of design capacity.) Given the high cost of maintaining and renovating the state's aging youth correctional facilities, the Legislature should consider closing additional facilities—particularly if the juvenile population continues to drop. The department recently announced plans to close the Southern Youth Reception Center and Clinic in Norwalk.
Improve Oversight of Facility Maintenance. Historically, CDCR has not completed various types of maintenance projects—including preventative maintenance—in a timely manner. Moreover, in the past, prison wardens have sometimes redirected funding earmarked for maintenance to other purposes. In order to address this problem, the Legislature could improve its oversight of CDCR's maintenance budget by including a separately scheduled item for maintenance to ensure that funding dedicated to this purpose is not redirected for other purposes. Focusing on routine repairs could pay off in the long term by avoiding the much higher cost of completely rebuilding deteriorating prison facilities. (Please see page D–119 in our Analysis of the 2007–08 Budget Bill for a more detailed discussion of the need to provide greater oversight of CDCR facility maintenance.)
Judicial Branch
The California Constitution vests the state's judicial power in the Supreme Court, the Courts of Appeal, and the Trial Courts. The Supreme Court and the six Courts of Appeals are entirely state–supported. The Trial Court Funding program provides state funds (above a fixed county share) for support of the state's 58 trial courts. The Judicial Council serves as the administrative body of the judicial system, with the Administrative Office of the Courts (AOC) as its staff. In total, the Judicial Branch is responsible for approximately 19 million square feet of facility space. The vast majority of this space is dedicated to the trial courts, which consist of 532 facilities throughout the state.
State Assumes Responsibility For Trial Court Facilities
Historically, counties funded the operation, maintenance, and construction of trial court facilities. However, beginning in 1997, the Legislature adopted a series of statutory changes that shifted the responsibility for trial court funding, employees, and facilities from counties to the state. Below, we discuss the two major pieces of legislation that were enacted related to trial court facilities.
Chapter 1082, Statutes of 2002 (SB 1732, Escutia). In 2002, the Legislature adopted Chapter 1082 (commonly referred to as the "Trial Court Facilities Act of 2002"), which authorized the transfer of title and all management responsibility for most court facilities from the counties to the state on a building–by–building basis. (This transfer was completed in December 2009.) The legislation also requires counties to make payments to the state for the maintenance of trial court facilities based on the amounts counties historically spent for this purpose. The Judicial Council was given the responsibility for the maintenance and renovation of the transferred trial court facilities, as well as for the design and construction of new facilities. Additionally, the legislation increases various criminal and civil fines and fees to finance the construction of $1.5 billion in trial court facility projects.
Chapter 311, Statutes of 2008 (SB 1407, Perata). In 2008, the Legislature approved another significant increase in spending on trial court facilities with the passage of Chapter 311. This particular legislation authorizes lease–revenue bonds to finance 41 "immediate and critical" trial court projects totaling roughly $5 billion. Rather than being supported with the General Fund, however, the legislation authorizes additional increases in criminal and civil fines and fees to provide revenue for the debt service on the lease–revenue bonds. The legislation provides the Judicial Council with substantial discretion to choose the list of projects that would be classified as immediate and critical and constructed. Subsequently, Chapter 10, Statutes of 2009 (SBX2 12, Steinberg), gives the Judicial Council further discretion by authorizing the continuous appropriation of funds for acquiring land and developing preliminary plans for the 41 projects. As part of the 2011–12 budget package, however, the Legislature transferred $310 million in court construction funds to the General Fund, which most likely will delay most of the projects authorized in Chapter 311 by up to a year.
Projected Increase in Spending on Courts Infrastructure. As a result of the two pieces of legislation discussed above, state spending on infrastructure for the courts is projected to significantly increase in the coming years. Assuming projects resume after the one–year delay, nearly all of the projects supported by Chapters 1082 and 311 are projected to be in the design or construction process in 2013–14. This would result in expenditures on court facilities of more than $2 billion at that time and completion of all projects by 2017–18. The annual debt service for the lease–revenue bonds used to construct the total package of projects will reach about $390 million.
Major Drivers of Court Infrastructure Spending
In general, court infrastructure spending is largely driven by the following factors:
- Security and Size. In order to ensure sufficient safety and security, the AOC prefers that court buildings have separate circulation areas that allow court staff, the public, and in–custody individuals appearing in court to remain separate from each other. However, many of the existing court facilities lack these separate circulation areas. In addition, increased space for public areas of courthouses (such as jury rooms) and for the offices of judges and court employees can also drive court construction needs.
- Seismic Safety and Age. Roughly 80 percent of the state's trial court facilities were built before the adoption of various seismic codes in 1988. As a result, some of these facilities do not meet current building standards and could prove to be a hazard in an earthquake. In addition, many court facilities are more than 30 years old and require significant repairs that go beyond routine maintenance work.
- Workload Changes and Program Improvements. Increases in the number of judgeships and related court staff resulting from additional workload can also drive court infrastructure needs. In addition, new programs sponsored by the courts can change the type of facilities courts need. For example, an increase in the number of self–represented litigants has increased the need for space for Self Help Centers in court facilities.
Issue for Legislative Consideration—Courts
Focus on Highest Priority Projects. The Judicial Council classifies projects as an "immediate need" (the highest ranking need–level) or "critical need" (the second highest ranking need–level). Based on the limited funds authorized in Chapter 311, the Judicial Council is planning to move forward on some of the immediate need projects and many critical need projects. In other words, the Judicial Council has chosen to hold off on a number of immediate need projects in order to proceed with lower–priority projects. Given the limited resources available for court construction, however, we believe it makes sense to prioritize the immediate need projects.
Consider Delaying Lower Priority Projects. Because some of the fine and fee revenue currently dedicated to court construction could be further redirected to help address the state's budget shortfall, the Legislature may wish to consider holding off on the critical need projects at this time. We estimate that funding only immediate need projects—including those not currently being pursued by the Judicial Council—would free up tens of millions of dollars in annual debt–service payments that could be used to offset General Fund costs in other areas based on legislative priorities.
Conclusion
Major Findings
In this report, we summarize the state's major infrastructure investments from the previous decade. Overall, we estimate that the state spent $102 billion on infrastructure from 2000–01 to 2009–10. Below is a summary of our key findings related to the state's infrastructure spending.
Over 70 Percent of the Spending Was for Transportation and K–12 Education Programs. The state spent approximately $41 billion on transportation infrastructure and $31 billion on K–12 school facilities. The other large infrastructure programs were natural resources ($13 billion) and higher education ($10 billion).
More Than Half of the Spending Was for Local Programs. The state provided local governments more than $59 billion to build, acquire, or improve infrastructure. Most of these funds were allocated to K–12 school districts to build schools. The state typically required local governments to provide a local funding match to qualify for these state funds. For example, the state generally required K–12 school districts to match at least 50 percent of projects costs.
State Initiated Many New Infrastructure Programs. During the last decade the state expanded its infrastructure funding responsibilities to provide support for programs that previously did not receive state support, such as high–speed rail, trial courts, children's hospitals, and stem cell research facilities.
Borrowing Through Bonds Financed Most Infrastructure Investments. General obligation bonds and lease–revenue bonds accounted for almost two–thirds of the state's infrastructure spending. Most of these bonds were placed on the ballot or authorized by the Legislature and Governor. Less than 15 percent of approved general obligation bonds stemmed from initiative bond measures (measures placed on the ballot directly by the voters). Because of the reliance on bond funding, state spending on many infrastructure programs fluctuates considerably over time. After a bond passes, programs typically experience temporary expenditure increases until the bond funds are exhausted.
Rehabilitation and Maintenance of Existing Infrastructure Is Inadequate. Much of the state's infrastructure was built decades ago. As a result, the state now faces major renovation demands. In some cases the need for renovation has increased because of insufficient ongoing spending on maintenance and repair.
Lack of Data Hinders Decision Making, but Information Suggests Infrastructure Demand Will Continue to be Substantial. The state has limited information on the condition of existing infrastructure, which makes prioritizing spending and measuring outcomes difficult. Information drawn from current facility conditions and available department plans, however, suggests that demand for state infrastructure funds will continue to be substantial absent change in current policies.
Infrastructure Spending Outlook
The above findings highlight some issues for the Legislature and Governor to consider in future infrastructure policy and spending decisions. Looking forward to the next decade of state infrastructure investment, the largest single issue for the Legislature to determine is the level of state spending to dedicate to this purpose. For any given level of state revenues, each dollar spent on infrastructure (or infrastructure debt service) decreases funds that could be spent on other programs. This trade–off between long–term infrastructure investment and program spending has become more challenging in recent years due to the state's constrained fiscal position. Accordingly, the Legislature will have to balance its interests in infrastructure improvements with competing priorities in the annual budget.
Because most infrastructure spending is from bonds, one simple measurement of infrastructure spending's impact on total state spending is the state's DSR—the percentage of state General Fund revenues dedicated to debt–service payments. For most of the last three decades, the DSR was under 5 percent. The state's annual DSR is currently at about 6 percent and growing. Below, we consider the effects that different levels of infrastructure spending in the future would have on this trade–off between debt service and other state spending.
Existing Bond Authorizations. The state currently has about $46 billion of infrastructure bonds that have been approved, but not yet sold. As shown in Figure 20, these bonds support a variety of programs, with the largest bond balances remaining for transportation, high–speed rail, resources and flood control, and corrections. In some cases—such as transportation, resources, and higher education—most of the remaining funds have already been appropriated or committed to specific projects. As a baseline, we assume the state issues these remaining authorized bonds. Figure 21 shows that this would increase debt–service costs from 6 percent to 7.2 percent by 2014–15.
Figure 20
Authorized but Unissued General Fund Bonds
(In Millions)
|
|
General Obligation Bonds
|
Lease–Revenue Bonds
|
Total
|
|
Children's hospitals
|
$535
|
$139
|
$674
|
|
Corrections
|
3
|
7,259
|
7,262
|
|
General government
|
78
|
209
|
287
|
|
Higher education
|
731
|
558
|
1,289
|
|
High–speed rail
|
9,540
|
—
|
9,540
|
|
Housing
|
1,430
|
—
|
1,430
|
|
K–12 facilities
|
4,660
|
—
|
4,660
|
|
Local libraries
|
33
|
—
|
33
|
|
Resources and flood control
|
6,384
|
799
|
7,183
|
|
Stem cells
|
1,924
|
—
|
1,924
|
|
Transportation
|
11,735
|
—
|
11,735
|
|
Totals
|
$37,053
|
$8,964
|
$46,017
|
Proposed Bond Authorizations. The Legislature and Governor approved a measure placing an $11 billion general obligation bond to support the state's water infrastructure before the state's voters in 2012. If approved by the voters and implemented according to plan, the proposed 2012 water bond would modestly increase the state's DSR.
New Bond Authorizations. The largest unknown in forecasting infrastructure spending is the extent to which the Legislature and voters will authorize new bonds for infrastructure. Some programs may not require new bonds, as existing and proposed bonds would provide substantial resources for many additional years. For example, prisons and high–speed rail have significant existing bond authority, and the proposed 2012 bond could provide substantial funds for water resources. Absent new bond authorizations, however, other state infrastructure programs that typically are funded with bonds would receive relatively low levels of funding. For example, the remaining bond authority for K–12 and higher education facilities is approximately $5.9 billion—much less than the amount spent on these infrastructure programs in the last decade ($40.7 billion). If the Legislature and voters wanted to maintain spending for K–12 and higher education infrastructure at levels similar to the previous decade, they would need to authorize large new bond acts. As shown in Figure 21, such new bond acts for education facilities would push the DSR to about 8.2 percent. Similar to education, other programs—such as transportation, parks and other resources programs, housing, and general government office space—also have relatively low levels of existing bond authority compared with recent spending levels. Authorizing new bonds for these programs would further increase the state's infrastructure debt beyond that shown in Figure 21. These forecast figures also assume the state does not use bond funds to initiate any new infrastructure programs.
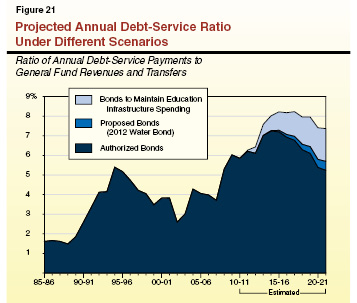
The above analysis shows that selling the stock of already authorized bonds would increase the percentage of the state's General Fund dedicated to infrastructure debt–service costs above current levels. Authorizing additional bonds to maintain the last decade's pace of infrastructure spending or provide state support for new infrastructure initiatives would push the DSR to unprecedented levels.
Policy Options
There is no one right level for annual state spending on infrastructure. The amount of infrastructure spending should reflect the state's priorities for infrastructure compared with other state spending. Continuing the levels of infrastructure spending from the last decade is one option. As shown above, this would result in a larger share of state spending devoted to infrastructure programs. As an alternative to dedicating an increasing share of the state budget to infrastructure, the Legislature could consider other options. Throughout this report, we highlighted other ways the state could manage infrastructure to reduce state costs. We discuss three such options below.
Reduce the Scope of Infrastructure Receiving State Support. One option is to prioritize the state's infrastructure investments to the most critical and appropriate programs. For example, the Legislature could reevaluate whether certain programs should be a state responsibility or consider shifting a greater share of cost to local governments, the private sector, or other beneficiaries. The Legislature could also consider whether existing bond authorizations—such as those for new prisons under AB 900—remain a priority. As described in the higher education chapter, the Legislature could redefine what types of space to support with state funds.
Adopt Strategies to Reduce Infrastructure Demand. Another alternative is to reduce infrastructure demand through policies that increase utilization, encourage less costly alternatives, or improve efficiency. Higher education policies could place a greater emphasis on distance education and improved use of facilities during the summer. A greater focus on repair and maintenance could prolong the life of existing infrastructure and avoid costly replacements. In transportation, congestion pricing or toll roads could reduce demand for new highway capacity.
Identify Additional Revenue to Support Infrastructure. Rather than relying on the state's general revenues to fund infrastructure, the Legislature could explore alternative revenue sources. The state already has shifted some infrastructure costs related to transportation and court programs to special fund revenues. Expanding the use of toll roads or other user fees could provide additional funding. Or the Legislature could consider new approaches like charging motorists based on the number of miles they travel. Opportunities also exist for resources programs to charge beneficiaries for a greater share of infrastructure costs.
In our view, a balanced approach that includes prioritization, demand management, and new revenues would be most effective for managing the state's infrastructure demands. Developing a comprehensive plan that incorporates each of the above strategies, however, is a complex task because infrastructure includes state programs spanning many different policy areas and requires difficult long–term policy choices regarding the scope of state services, revenues, and overall state development. In the following section, we recommend some improvements to the state's infrastructure planning process that would allow the Legislature and administration to better address the state's infrastructure needs.
Improving the Infrastructure Planning Process
To effectively assess the enormous variety and complexity of the state's infrastructure needs, the state needs a well–defined process for planning and financing projects. Unfortunately, the state currently lacks such a process. In order to better address the issue of infrastructure planning and financing, we believe it is time to alter the state's approach.
Infrastructure Funding Remains a Mostly Ad Hoc Decision Making Process. As described in the introduction, the state has implemented some infrastructure planning procedures, such as the statewide five–year infrastructure plan. Although the plan has improved some aspects of the state's infrastructure planning, the effectiveness of the process could be greatly improved. One of the Legislature's goals in requiring the Governor to annually submit a statewide five–year infrastructure plan was to provide a comprehensive plan from which the Legislature could develop a coordinated approach for capital outlay funding each year. In our view, this approach has broken down for two key reasons.
First, the administration has not consistently provided an annual five–year statewide infrastructure plan. The most recent five–year plan accompanied the Governor's 2008–09 budget proposal. While we have found some deficiencies with previous five–year plans (please see our previous publication,
A Review of the 2002 California Infrastructure Plan), the Governor's statewide plan is an important starting point in developing a coordinated infrastructure strategy. Similar to the Governor's January budget proposal, the five–year plan could provide a focus for policy hearings and annual budgetary decisions on infrastructure spending.
A second problem is that the Legislature's decision–making process remains fragmented. Most financing decisions occur through bond acts focused on specific program areas, and spending decisions occur through the budget process within individual budget subcommittees. In this way, proposals are reviewed and funded in isolation, and there is no examination of how competing proposals fit within the context of overall state infrastructure needs, priorities, and funding capabilities. The Legislature cannot effectively assess the trade–offs of funding different proposals without some perspective on the infrastructure demands across various capital outlay programs.
Each of these planning failures contributes to the other. Without a clear legislative process for debating and acting upon the statewide infrastructure plan, the administration has little incentive to prepare the plan for the Legislature. Without a comprehensive statewide plan to consider, the Legislature continues with the existing approach to infrastructure financing and spending.
Establish Legislative Committees to Focus on Statewide Infrastructure. The Legislature should consider changes to its infrastructure process. Given the importance and complexity of these issues, we have recommended in the past that the Legislature establish special policy and budget committees to develop and oversee statewide infrastructure policy. There are different ways that this could be accomplished. For example, the Legislature could establish a special joint policy committee to oversee infrastructure issues. The policy committee's membership could include the chairs of relevant policy and budget committees (transportation, education, et cetera) to ensure policies adopted by the committee are applied throughout different program areas. What is critical, however, is that the Legislature independently assesses the state's infrastructure needs, makes decisions regarding infrastructure investment priorities, and articulates its policies in statute or annual resolutions.
Some important considerations and decisions for the policy committee could include:
- Reviewing the administration's infrastructure plan and monitoring the state's progress in implementing the plan.
- Setting priorities for infrastructure spending across programs.
- Analyzing proposed bond acts to ensure they fit within priorities, plans, and funding capabilities.
- Determining which local or other non–state programs should receive funding.
- Assessing the state's infrastructure data and creating legislation to improve data collection when necessary.
- Developing institutional expertise in capital outlay topics such as financing, construction delivery methods, and cost escalation.
By accomplishing the above steps, the Legislature would establish the basic parameters for development of a coordinated statewide infrastructure strategy. Implementation of the statewide plan through approval of specific projects, however, would continue to be part of the annual budget process. For this, we recommend the Legislature establish separate infrastructure budget subcommittees in each house to consider all capital outlay budget proposals. This would allow for a more comprehensive review than the existing process because the subcommittee could compare spending across program areas and confirm that spending is focused on priorities. Such subcommittees also could uphold policies established by the infrastructure policy committee.
Other Potential Reforms for the State's Infrastructure Process. In our view, establishing infrastructure committees alone would be a significant step forward, as additional coordination and prioritization could greatly improve the state's infrastructure process. In addition to forming infrastructure policy and budget committees, however, the Legislature could consider other, smaller changes to improve efficiency and oversight. For example, it could:
- Require Biennial Updates to the Five–Year Infrastructure Plans. The workload associated with annually collecting information from departments and organizing a comprehensive five–year plan is substantial. Requiring the plan to be submitted to the Legislature biennially would reduce the workload and allow more time for oversight, data collection, needs assessments, and other planning. A biennial five–year infrastructure plan would align with legislative sessions and the general election cycle—an important consideration because general obligation bonds (the primary financing source for infrastructure) must be approved by voters.
- Limit Continuous Appropriations. Some infrastructure spending is not included in the annual budget bill, but is continuously appropriated pursuant to other statutes. In our view, continuous appropriations limit legislative oversight. Whenever possible, we recommend that the Legislature retain control of infrastructure appropriations so that it can ensure that state infrastructure investments align with state priorities.
California faces a significant challenge in addressing its infrastructure needs. It is simply too important an issue to continue making decisions on an ad hoc basis. Given the importance of state infrastructure investments to California's transportation network, educational programs, criminal justice system, and other programs, the state needs to have a decision–making process that allows it to consider how any proposal fits within statewide needs and priorities and how it affects the state's ability to finance those and other needs over time. Developing a coordinated approach to infrastructure planning and financing will be a considerable undertaking. Improving existing practices, however, will allow the administration and Legislature to be better informed and proactive in addressing the state's infrastructure needs.
Summary
Over the last decade, the Legislature, Governor, and voters have dedicated increased resources towards renovating and expanding California's public infrastructure. Despite making these considerable investments, the state faces ongoing infrastructure demands. If the state elects to maintain its current policies relating to infrastructure, the Legislature likely will need to shift a larger share of the state's budget to infrastructure. Alternatively, the state could adopt new policies to reduce demand or share costs with beneficiaries and local governments. Because any decisions on infrastructure policies or new spending span multiple policy areas and require long–term planning, we encourage the Legislature to consider a more coordinated approach for infrastructure financing decisions.