The In–Home Supportive Services (IHSS) program provides care for over 430,000 recipients, at an annual total cost of about $5.5 billion. The program, which is available to low–income elderly and disabled persons, provides various services to recipients in their own homes. Assistance is provided with tasks such as cleaning, meal preparation, bathing, grooming, and helping with medications. The IHSS caseload varies widely with regard to the number of hours of monthly service provided.
Benefits of the IHSS Program. For many recipients, the program allows individuals to live at home rather than in an institutional setting (typically, a nursing home). By preventing—or at least delaying—the move to a nursing home, the program can save money for the state. This is because, for a given individual, the annual public sector costs of providing IHSS services is considerably less than the costs of a nursing home. Many other recipients, however, do not face institutionalization in the absence of IHSS services. In these cases, the public sector realizes costs, but there are still benefits for recipients. The program can enhance the quality of life by making it easier to live at home, and it reduces the time and financial burden on family and friends.
Net Fiscal Impact on Public Sector. The net impact on the state and counties depends on the mix of the IHSS population—that is, what proportions of the caseload would be institutionalized and would not be institutionalized in the absence of the program. To explore this issue, we created a fiscal model that compares the cost of IHSS to the estimated cost of a long–term care system without IHSS. Our key findings are:
- Relative Risk for Institutionalization. Not surprisingly, our model estimates a much greater risk of entering a nursing home for those IHSS recipients who are the most elderly and using the greatest number of hours.
- Net Costs to State and Counties. After accounting for both costs and savings to the state and counties, IHSS probably results in net costs. This is because the savings (in the form of avoided nursing home costs) are probably more than offset by the costs (to provide IHSS and related services) for those recipients who would not be institutionalized in the absence of the program.
- Net Savings to the State. From the state’s perspective alone (not considering the counties), IHSS may well result in net savings. (This is because the state receives a greater share of savings than it incurs in IHSS costs compared to counties.)
Policy Implications. From a fiscal perspective, our findings indicate that the state maximizes its net fiscal impact by targeting IHSS services to those recipients who are most likely to enter a nursing home in the absence of the program. This is the approach that the state took in 2009–10 budget actions affecting the program. The state reduced services to those who are least likely to require institutionalization. Given the state’s continuing fiscal problems, we offer additional options for the Legislature to consider that can achieve state savings through increased targeting. We note that the Governor’s 2010–11 budget proposes to eliminate IHSS for all but the most impaired (13 percent of the caseload).
The IHSS program provides in–home care for persons who cannot safely remain in their own homes without such assistance. In order to qualify for IHSS, a recipient must be aged, blind, or disabled and in most cases have income at or below the level necessary to qualify for the Supplemental Security Income/State Supplementary Program (SSI/SSP). County social workers perform an assessment to determine the number of hours and type of services to authorize an IHSS recipient. The recipient is responsible for hiring and supervising a provider. Based on the submittal of timesheets, the providers are paid with a combination of state, federal, and county funds.
Why Was IHSS Created?
The IHSS program was established as a way to provide in–home domestic and personal care services to recipients who may otherwise be at risk of nursing home placement. Another benefit of the IHSS program is that it makes living at home easier for recipients, and reduces the time and financial burdens on their friends and family members. The rationale for providing IHSS was that in–home care, rather than institutional care, would increase the quality of life for program recipients and could potentially result in cost avoidance for the state. However, as we will discuss later in this analysis, quantifying the extent to which IHSS has actually resulted in net state savings is challenging.
Considering the Cost–Effectiveness of IHSS
Due to the increasing cost and demand for the IHSS program, one major ongoing legislative concern has been whether the IHSS program has saved the state money by reducing institutional placement costs. This issue of whether IHSS results in a net fiscal benefit to the public sector is one of cost–effectiveness. Overall, the program would be considered cost–effective if the aggregate amount the state spends on IHSS is equal to or less than the amount the state would spend on institutional placement and other services in the absence of IHSS. As we noted in our Analysis of the 2006–07 Budget Bill, the per–person, per–year cost of IHSS was $10,000 (at the time), while the per–person, per–year cost of institutional care was about $55,000. This simple comparison of the annual cost of these two types of care is misleading, however, because it does not take into account some key factors we will discuss later in this report. This report provides an analytical framework to consider the likelihood that individual IHSS recipients will enter a skilled nursing facility (SNF) if they lose IHSS, to compare the costs of these different types of care, and to analyze the cost–effectiveness of IHSS with respect to state government. To this end, we created a fiscal model that compares the cost of IHSS to the cost of a world without IHSS.
History of IHSS
Some version of the IHSS program has been present in California since the 1950s. Until 1993, IHSS was funded through a combination of state, federal Title XX (Social Services Block Grant funds), and county funds. In 1993, Chapter 939, Statutes of 1992 (AB 1773, Moore), directed the Department of Health Care Services (DHCS) to submit a state plan amendment (SPA) to the federal Centers for Medicaid and Medicare Services (CMS) to include a portion of the IHSS program as a service eligible for federal Medicaid funds (known as Medi–Cal in California). As a result of this SPA, some IHSS recipients became eligible for federal Medicaid funding through what is referred to as the Personal Care Services Program (PCSP). In 2004, DHCS and the Department of Social Services (DSS) submitted a waiver application to the CMS to make most of the remaining recipients eligible for federal funding. Approval of this waiver, now known as the IHSS Plus Option (IPO), was granted in August 2004.
Currently, IHSS consists of three components—PCSP (about 92 percent of the caseload), IPO (about 7 percent of the caseload), and Residual (about 1 percent of the caseload). Thus, about 99 percent of the caseload is eligible for federal Medicaid funding.
How IHSS Works
IHSS Program Funding. The IHSS program is funded through a combination of state, county, and federal Medicaid funds. For almost all IHSS recipients, 50 percent of program costs are paid by the federal government, about 32.5 percent by the state, and 17.5 percent by the county. Only about 1 percent of IHSS recipients are not eligible for federal Medicaid funding. Program costs for these recipients are shared 65 percent by the state and 35 percent by the counties. The IHSS program administration costs are shared 50 percent by the federal government, 35 percent by the state, and 15 percent by the counties.
The amount of the federal share in the IHSS program (50 percent) is determined by a federal formula known as the federal medical assistance percentage (FMAP). The American Recovery and Reinvestment Act of 2009 temporarily increased the FMAP from 50 percent to 61.6 percent from October 2008 through December 2010.
Eligibility. To be eligible for IHSS, a person must be aged, blind, or disabled and usually have income at or below the SSI/SSP grant level ($845 per month for individuals as of October 2009). Those individuals with income in excess of this grant level may still be eligible for IHSS with a share of cost (SOC). An IHSS recipient with a SOC must make an out–of–pocket monthly payment towards the receipt of IHSS services before the IHSS program pays the remainder of the cost of their services. Eligibility for IHSS is generally limited to individuals with no more than $2,000 in assets and couples with no more than $3,000 in assets (with certain exclusions for such assets as homes and vehicles).
Application and Social Worker Assessment. When a potential IHSS recipient applies for the program at a county office, the determination of their eligibility is a two–step process that takes into account the applicant’s income and need for services.
Once a county worker verifies that an individual is financially eligible for IHSS, a county social worker visits the home of the recipient to determine whether there is a need for services. To perform this assessment, the social worker uses a uniform assessment tool to determine the number of hours for each type of IHSS service for which a recipient qualifies in order to remain safely in his/her own home. Figure 1 provides a list of the types of services an IHSS recipient may be eligible to receive.
Figure 1
Examples of Services Available to In–Home Supportive Services Recipients
|
Tasks
|
Examples
|
|
Domestic Services
|
Cleaning, dusting, picking up, changing linens, changing light bulbs, wheelchair maintenance, and taking out garbage.
|
|
Laundry
|
Sorting, washing, hanging, folding, mending, and ironing.
|
|
Shopping and Errands
|
Purchasing groceries and putting them away, picking up prescriptions, and buying clothing.
|
|
Meal Preparation
|
Planning menus, preparing food, and setting the table.
|
|
Meal Cleanup
|
Washing dishes and putting them away.
|
|
Feeding
|
Feeding.
|
|
Ambulation
|
Assisting recipient with walking or moving in home or to car.
|
|
Bathing, Oral Hygiene, Grooming
|
Bathing recipient, getting in or out of the shower, hair care, shaving, and grooming.
|
|
Routine Bed Baths
|
Sponge bathing the body.
|
|
Dressing
|
Putting on/taking off clothing.
|
|
Medications and Assistance with Prosthetic Devices
|
Medication administration assistance; taking off/putting on, maintaining, and cleaning prosthetic devices.
|
|
Bowel and Bladder
|
Bedpan/ bedside commode care, application of diapers, assisting with getting on/off commode or toilet.
|
|
Menstrual Care
|
External application of sanitary napkins.
|
|
Transfer
|
Assistance with standing/ sitting.
|
|
Repositioning/ Rubbing Skin
|
Circulation promotion and skin care.
|
|
Respiration
|
Assistance with oxygen and oxygen equipment.
|
|
Protective Supervision
|
Ensuring recipient is not harming themselves.
|
|
|
The uniform assessment tool, known as the hourly task guidelines (HTGs), assists the social worker in ranking the recipient’s impairment level on a five–point scale known as the functional index (FI) ranking. Figure 2 shows each of the potential FI rankings that may be assessed by a social worker, and what they mean for the impairment level of the recipient. Each FI ranking corresponds to an established range of service hours for a particular task. For example, a recipient who receives an FI ranking of 2 on the “feeding” task may be authorized to receive between 0.7 hours and 2.3 hours of feeding per week. The corresponding range of hours varies depending on the particular task being assessed. For example, meal preparation services range from three to seven hours. Also, if an individual is assessed as having an FI ranking of 1 for any given task, he or she will not receive any authorized hours for that task. The weighted average of the FI rankings for each task is used to create a total FI score. Although the HTGs provide a standard tool, the assessment process is individualized. Social workers may, with written justification, authorize hours above or below the range established by the HTGs.
Figure 2
Functional Index Rating Scale
|
Functional Index
|
Impairment Implications
|
|
1
|
Able to perform function without human assistance—independent.
|
|
2
|
Able to perform a function, but needs verbal assistance (reminding, encouraging).
|
|
3
|
Able to perform a function with some human, physical assistance.
|
|
4
|
Able to perform a function with substantial human assistance.
|
|
5
|
Cannot perform the function with or without human assistance.
|
|
|
Assignment of Hours. Once a social worker has determined the number of hours to authorize for a recipient, the recipient is notified of the number of hours they have been authorized for each task. Using the HTGs, social workers may authorize between 1 and 283 total hours per month of IHSS services. Currently, recipients receive an average of about 85 hours of IHSS per month. Recipients who receive over 195 hours of service each month are considered to be severely impaired.
All Eligible Recipients Receive Services. Once it has been determined that a recipient meets the eligibility criteria for IHSS, that individual is granted those IHSS services. As a result, there is no waiting list or cap on program enrollment.
State Participation in Wages. County wages and benefits to IHSS workers range from $8.00 per hour to $14.99 per hour. Currently, the state has a share in the cost of IHSS wages up to $9.50 per hour and, for benefits, up to $0.60 per hour. Counties with wages and benefits above $10.10 split the additional cost with the federal government. Prior to the 2009–10 February budget, state participation in IHSS provider wages and benefits was $12.10 per hour. Although the state participation in wages has recently been lowered to $10.10 per hour, a federal judge issued an injunction to stop the decrease in state participation. As a result, despite current law, the state is still participating in combined wages and benefits of up to $12.10 per hour.
As noted above, IHSS wages and benefit levels vary across counties. Within a particular county, however, IHSS workers are paid—with very few exceptions—the same hourly wage regardless of their training, the type of services they are providing, and their qualifications.
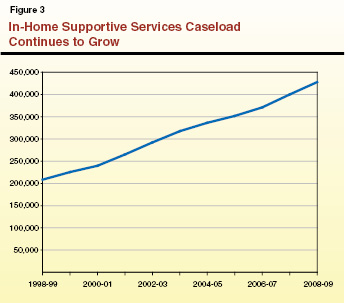
The IHSS Program Is Growing
The IHSS program is the fastest growing major social services program in California. Between 1998–99 and 2008–09, IHSS General Fund expenditures grew at an average annual rate of about 13 percent. This growth was due to the combined effect of an increase in the cost per case and an increase in the IHSS caseload. In comparison, statewide General Fund spending increased by 4.8 percent annually over the same time period.
Growth in the IHSS Population. Figure 3 shows that the IHSS caseload has grown from 208,400 in 1998–99 to about 430,000 in 2008–09. While the IHSS caseload has grown by about 105 percent over this time period, the total population in California has only increased by about 16 percent.
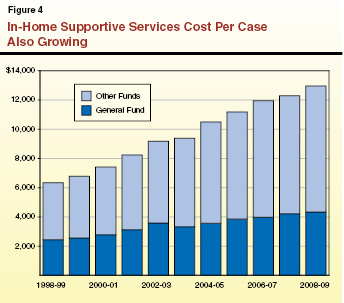
Growth in the Cost Per Case. As shown in Figure 4, in addition to the growth in the caseload, the IHSS annual cost per case has increased from about $6,300 per case from all fund sources in 1998–99 ($2,400 from the General Fund) to about $13,000 per case in 2008–09 ($4,200 from the General Fund). The increase in the cost per case is primarily due to increasing wages for IHSS providers and an increase in the average number of authorized IHSS hours per case.
Figure 4 illustrates that the growth of the General Fund portion of the IHSS cost per case slowed from 2003–04 through 2004–05. This was due primarily to the previously mentioned 2004 federal waiver approval that made most individuals in the Residual program eligible for federal Medicaid funds, thereby offsetting some General Fund costs. Since 2005–06, the average rate of General Fund growth in the cost per case has been about 4.1 percent.
A Closer Look at IHSS Recipients
The IHSS caseload is very diverse. There are some very frail recipients who receive the maximum amount of hours, and some recipients with less severe disabilities and fewer hours. As a result, some IHSS recipients rely more heavily on IHSS services than other recipients. Below, we highlight some of the characteristics that contribute to the diversity of the IHSS caseload.
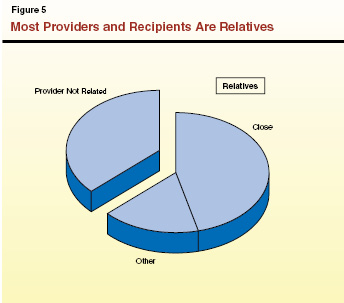
Recipient and Provider Relationship. Currently, there are about 376,000 IHSS individual providers statewide. As shown in Figure 5, almost two–thirds of IHSS recipients receive care from a provider who is related to them. Moreover, about 46 percent of IHSS recipients receive care from either their own parent, spouse, or adult child (defined as a “close relative” for purposes of this report). In about half of cases, IHSS providers live in the same home as the IHSS recipient.
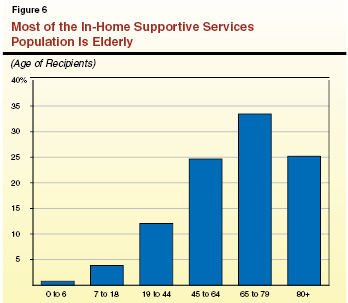
Age of IHSS Recipients. Although the IHSS program serves a wide age range of recipients, as shown in Figure 6, the majority of recipients are elderly. While almost 60 percent of IHSS recipients are over the age of 65, only about 5 percent of the total IHSS population is under the age of 18.
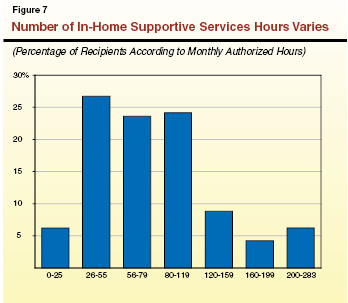
Authorized Service Hours. Within the IHSS caseload, some recipients have high impairment levels and a high number of authorized hours, and others have low impairment levels and a low number of hours. Although recipients may receive up to 283 hours, only a small percentage of recipients actually receive more than 200 hours of care each month (see Figure 7). Moreover, nearly 60 percent of IHSS recipients receive less than 80 hours of care each month (about 18 hours of care per week).
Some IHSS Recipients are Developmentally Disabled. About 35,000 (nearly 9 percent) of IHSS recipients are developmentally disabled. A developmental disability is defined as a disability attributable to mental or physical impairment that originates before an individual is 18 years old, and that is expected to continue indefinitely. Developmental disabilities include, but are not limited to, mental retardation, cerebral palsy, epilepsy, autism, and other disabling conditions related to mental retardation. Within the IHSS population, developmental disabilities are most common among the young recipients with high hours.
Community services for the developmentally disabled population are overseen by the Department of Developmental Services (DDS). These services are provided through 21 regional centers (RCs) located throughout the state. The RCs are responsible for eligibility determinations and client assessments, the development of an individual program plan, and case management. In general, RCs only pay for services after individuals have maximized their access to so–called “generic” services (those services provided at the local level by counties, cities, school districts, and other agencies), such as IHSS.
Diverse Caseload Results in Diverse Services. As demonstrated by the above data, the IHSS caseload is not uniform. The program serves over 430,000 different recipients with varying service authorizations and needs. Some recipients rely more heavily on the program than others.
Is IHSS Cost–Effective to State Government? As we discuss below, a simple comparison of the lower yearly costs of IHSS to the higher yearly cost of a SNF does not take into account other factors which may contribute to the overall cost of IHSS. Below we discuss how the costs of these two types of long–term care compare.
How the Costs of IHSS and Institutional Care Compare
California currently administers a continuum of long–term care programs available to seniors and those with disabilities. As shown in Figure 8, the IHSS program is part of California’s long–term care continuum. Most long–term care programs may be classified as either community–based or institutional programs.
Figure 8
Program Costs Vary in California’s Long–Term Care Continuum
2007–08 Total Costs
|
Program
|
Average Annual Cost Per Participant
|
|
Community–Based Care
|
|
|
Linkagesa
|
$2,012
|
|
Multipurpose SeniorServices Program
|
3,454
|
|
Alzheimer’s Day Care Resource Centera
|
5,043
|
|
Adult Day Health Care
|
10,482
|
|
In–Home Supportive Services
|
12,287
|
|
Institutional Care
|
|
|
Skilled Nursing Facilities
|
$51,100
|
Differences in Average Yearly Cost of Care. The average annual cost per person of institutional care is higher than the average annual cost per person of community–based programs. Specifically, in 2007–08, the average yearly cost of a SNF was over $50,000 per person while the average cost of IHSS was about $12,000 per person. However, these comparisons in many cases understate the true cost of keeping someone in the community. Some IHSS recipients, for example, may be receiving multiple services, such as a home–delivered meals or case management services, that add to the overall cost of their community–based care.
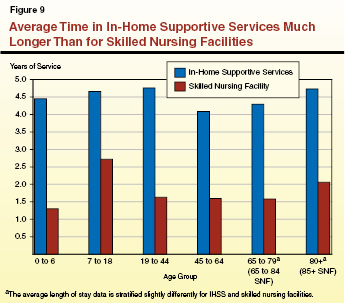
Differences in Average Time in Care. Another key factor to consider in comparing the costs of institutional care and community–based care is the time an individual spends in each type of care. On average, individuals in institutional care settings are there for shorter periods of time. As seen in Figure 9, for all age groups, the average time in care is longer on IHSS than in a SNF. As a result, the length of time recipients spend in IHSS should be considered when comparing the total cost of providing care for a recipient in the community rather than in a SNF.
Other Factors Affecting Relative Costs
Not All IHSS Recipients Would Otherwise Enter a SNF. In the absence of IHSS, what would happen to program recipients? Some clearly would be placed in a SNF. However, our analysis indicates that, given the diversity in the caseload, it is likely that a significant portion of recipients would not otherwise require institutional care. Although some IHSS recipients currently meet the eligibility criteria for SNF placement, and are therefore deemed SNF–certified, meeting this threshold is not an eligibility requirement for IHSS program participation. Moreover, no current data is available on the percentage of IHSS recipients who meet the eligibility criteria for SNF placement. Notably, exit data indicate that each year about 5,500 IHSS recipients (or about 1.3 percent of the total number of IHSS recipients) enter SNFs directly from IHSS. (This number, however, understates the actual number of recipients who eventually end up in a SNF after IHSS because some recipients first enter a hospital, or some other facility, before entering a SNF.)
Recipients May Enroll in Multiple Programs. Recipients who receive IHSS are usually receiving assistance through other state programs, such as a cash grant through the SSI/SSP Program. Comparing only the costs of IHSS and nursing home care understates to some degree the cost of providing care for the individual in the community.
Whether IHSS results in overall state savings on long–term care is difficult to determine. Such an analysis requires a combination of data collection, development of key assumptions, and fiscal modeling. Below, we provide an analytical framework for considering whether the operation of the IHSS program results in a net fiscal benefit for the state. We describe the purpose of our fiscal model, our key data sources, our main assumptions, and our methodology. (We also discuss research related to this subject in the box on the next page.)
|
The research we reviewed as part of our analysis of the cost–effectiveness of community–based care is limited and offers mixed findings.
Some studies, such as one performed by researchers at the University of California, San Francisco, consider the per year cost of the community–based program and the SSI/SSP grant and compare those costs to the costs of institutional care programs. On this basis they conclude that community–based programs cost less per person annually than institutionalization. However, these studies do not estimate the number of recipients who would enter a skilled nursing facility (SNF) in the absence of community–based services, and therefore do not determine whether in–home care results in overall governmental savings.
Another study, sponsored by the U.S. Department of Health and Human Services, points out that recipients of home and community–based care services may never have entered a SNF even in the absence of alternatives. Rather than reducing costs, these recipients added to the overall cost of providing long–term care in the community.
A common theme among the research is the importance of targeting community–based care to those most likely to enter an institution in order to increase the cost–effectiveness of in–home care programs. Another common theme of the research is that providing care in the community often increases the quality of life for elderly clients. |
Purpose of the Model
Developing a Fiscal Model. In the absence of IHSS, as we noted earlier, some program recipients would likely end up in institutional care, while others would not. However, it is difficult to estimate the number of recipients that would be most likely to enter a SNF if the IHSS program did not exist. This is a key factor in evaluating the cost–effectiveness of the program.
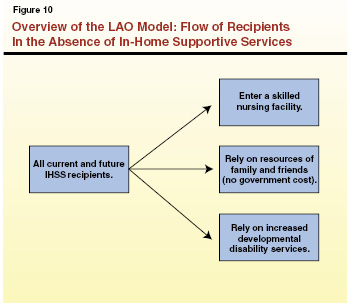
To address this question, we created a model that, based on certain assumptions, estimates the potential cost of nursing home care in the absence of IHSS. As shown in Figure 10, the model assumes that, over time, all current and future IHSS recipients would otherwise (1) enter a SNF, (2) receive care from friends and family at no government cost, or (3) receive (if eligible to do so) an increased level of care from DDS. Since the exact percentage of recipients who would shift to SNF care is unknown, the model allows us to test various assumptions as to the percentage of recipients who would enter a SNF in the absence of IHSS. The model estimates the General Fund cost of the long–term care system for any given assumption concerning the percentage of recipients entering a SNF in the absence of IHSS. This cost estimate can then be compared to our forecast of the “business as usual” cost of continuing the IHSS program without changes to determine the net cost–effectiveness of the IHSS program. Although this model compares costs based on different assumptions of SNF entry rates in the absence of IHSS, it does not predict or estimate the actual SNF entry rate in the absence of IHSS. This is because data are not available to predict the behavioral response to the elimination of IHSS.
LAO Hypothesis: Factors Increasing Likelihood of SNF Entry. Given the difficulty in predicting which recipients would be likely to enter a SNF in the absence of IHSS, we created a working hypothesis of which IHSS recipients would be most likely to enter a SNF in the absence of IHSS. Our hypothesis was based on information provided by state and county officials; experiences accompanying social workers on IHSS recipient assessments and reassessments; and public testimony at legislative hearings by program recipients, providers, advocates, and county representatives. Essentially, we concluded that the recipients most likely to enter a SNF in the absence of IHSS would be those who were (1) older, (2) received high levels of authorized IHSS care, and (3) received services from a provider who was not a close relative.
Key Data Sources
We collected data in a form that allowed for the testing of our hypothesis from DSS and DHCS. Below, we describe the main data sources.
Stratifying the Current IHSS Caseload. To better understand the differences among IHSS recipients and how they differ in their use of the program, we obtained data that gave us a “snapshot” of the current composition of the IHSS caseload. The caseload was stratified by age, the relationship of the provider to the recipient, and the number of authorized IHSS hours.
Current IHSS “Exits.” Some recipients exit IHSS because they enter an institution, because they die, or because they no longer meet eligibility requirements. A DSS computer system documents where recipients “went” upon exiting IHSS. We obtained this IHSS data for a six–month period. These data were stratified by age, provider type, and the number of authorized IHSS hours. We specifically considered the characteristics of the IHSS recipients who died, entered a SNF, or were admitted to a hospital over this six–month period. This allowed us to determine which types of IHSS recipients were most likely to enter a SNF. We concluded that these recipients were the most frail among the IHSS caseload.
SNF Data From the DHCS. The DHCS provided data on the average length of stay and average cost of SNF placements by the age of the recipient. From this data, we were able to better understand differences in the average length of stay and cost of SNF care based on the age of the recipient.
Key Features of the Model
Below, we describe the assumptions we made related to the length of time a recipient would remain in the SNF, the characteristics of the recipients at the highest risk of SNF placement, and the costs and growth over time.
Time in Care. This analysis assumes that those who would enter a nursing home in the absence of IHSS will stay there for the current average length of stay in a SNF. In other words, if the model is testing the cost–effectiveness of IHSS based on a scenario that assumes that 50 percent of IHSS recipients would enter a SNF in the absence of IHSS, all 50 percent that enter a SNF are assumed to have stayed for the average length of stay for each age group.
Relative Propensity to Enter a SNF. The exit data was used to determine the characteristics of IHSS recipients who were most likely to enter a SNF relative to other recipients. Figure 11 shows the relative propensity of an IHSS recipient to enter a SNF based on two factors: age and number of IHSS authorized hours. The darkest shading in Figure 11 indicates that older recipients with a high number of authorized hours are the most likely to enter a SNF.
The exit data was used to inform and build the model. Under any scenario, the model assumes that a higher percentage of the more frail recipients will enter a SNF in the absence of IHSS. For example, if the model is testing a scenario where 50 percent of recipients would enter a SNF in the absence of IHSS, those who were frail would enter SNFs at a higher rate than 50 percent, while the less frail would enter at a rate lower than 50 percent.
Comparing Costs at Equilibrium. For purposes of this analysis, we focused on the cost–effectiveness of IHSS in the longer term—once the model has reached equilibrium in about seven years. Under the model, the costs of SNF placement for the current IHSS caseload would be high in the early years. However, for purposes of this analysis, we believe it is more appropriate to compare the long–term costs of a world without IHSS to the long–term costs of IHSS as it operates today.
Base–Year Costs and Growth. In general, the costs in our model for IHSS and SNF care are based on 2007–08 General Fund and county expenditures. In the out–years of the analysis, the costs were kept constant and only adjusted for caseload growth.
Additional Costs and Savings Included in the Model
Treatment of the Developmentally Disabled Population. Our model assumes that, in the absence of the availability of IHSS services, all IHSS recipients who are developmentally disabled would incur increased DDS costs, rather than enter a SNF. We assumed that each hour of lost IHSS services would be replaced with an hour of services purchased through the RCs at an increased cost to the state.
Costs for Accidents. We recognize that, in the absence of IHSS, recipients may not immediately enter a SNF. Some recipients may instead have an accident or other episode that eventually results in their placement in a SNF. As a result, potential costs for accident–related injuries for some recipients are factored into the analysis.
SSI/SSP Savings. About 86 percent of IHSS recipients receive a monthly SSI/SSP grant payment. When IHSS recipients enter institutional care, their SSI/SSP grant is significantly reduced. The model accounts for these savings in SSI/SSP.
Some Factors Not Accounted For in the Model
As previously noted, because this model is a simplification of the real world, it is based on many assumptions. As a result, it is important to acknowledge several factors that we were unable to build into our analysis. These include such factors as the impact of the program on the quality of life of recipients. For more details about the factors that were excluded from our analysis, please see the box on the next page.
|
The model discussed in this report has limitations and it does not account for all of the potential costs and benefits of In–Home Supportive Services (IHSS). Below, we provide examples of some of the factors that were not accounted for in our model.
- Quality of Life for Recipients. Although we recognize that one of the primary benefits of the IHSS program is that it may increase the quality of life for program recipients and their families, we are unable to quantify this benefit in the model. As a result, this analysis is only focused on the fiscal costs and benefits of IHSS.
- Potential Costs in Other Programs for IHSS Recipients. Some IHSS recipients receive other services in the community that add to the cost of their care, such as housing benefits, home–delivered meals, and case–management services. Due to data limitations, we are not able to quantify the extent to which these other programs are utilized by IHSS recipients and the related costs.
- Cost–Effectiveness of IHSS for the Federal Government. Our analysis measures the cost–effectiveness of IHSS from the standpoint of the state. It does not measure whether the IHSS program is cost–effective for the federal government or society as a whole.
- A Change in the Average Length of Stay in a Skilled Nursing Facility (SNF). This analysis assumes that recipients would have the same average length of stay in a SNF in the absence of IHSS as they have in the current long–term care system where IHSS exists. To the extent that the existence of IHSS has an impact on the average length of stay in a SNF, the impact is not recognized in this analysis. Nevertheless, we used our model to test the effects of a 10 percent increase in the average length of stay. This change had a minimal impact on the results and did not impact our final conclusion.
- The Impact of the American Recovery and Reinvestment Act (ARRA) on the Federal Medical Assistance Percentage. As noted earlier, the federal share in the cost of IHSS and SNFs has been temporarily increased pursuant to the federal ARRA. This report does not account for this temporary reduction in the state’s cost in these programs. This is because this analysis considers the long–term cost–effectiveness of IHSS, while the General Fund relief from ARRA is temporary.
- The Most Recent IHSS Program Reductions and Proposals. In recent months, the Legislature has taken action to reduce the costs in the IHSS program (we provide more information on the IHSS reductions included in the 2009–10 Budget Act later in this report). In general, the actions aim to maintain IHSS for the most impaired recipients, and eliminate, or reduce, services for the least disabled. The potential savings associated with these proposals are not included in this analysis.
|
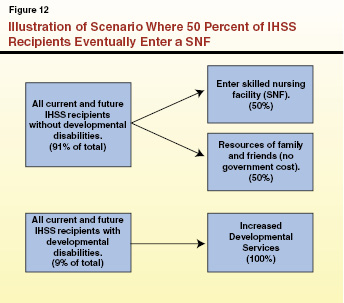
As explained above, to test the cost–effectiveness of IHSS, we used our model to estimate the cost of nursing home placement versus the cost of IHSS under various scenarios. Figure 12 shows how IHSS cases (including cases of recipients with and without developmental disabilities) flow through the model. As explained earlier, under our model, all IHSS recipients who are developmentally disabled (about 9 percent of the total IHSS population) would receive increased developmental services, rather than enter institutional care. The percentage of IHSS recipients who do not have developmental disabilities and who enter a SNF depends on the particular scenario. For example, Figure 12 shows a scenario where it is assumed that 50 percent of the non–developmentally disabled IHSS recipients would eventually enter a SNF if IHSS did not exist.
Below, we present the results of our analysis under different potential scenarios.
Results of the Modeling
Whether IHSS is cost–effective in the aggregate depends on the percentage of recipients who would likely enter a SNF in the absence of IHSS. Because the state and counties both have a share in the cost of the program, we looked at both cost–effectiveness from the perspectives of (1) the state and county funds combined and (2) the state General Fund alone. Below, we present the results of our model from both perspectives under several different scenarios.
Scenario Analysis From the Combined State and County Perspective. After accounting for both costs and savings to the state and counties, our model showed that the break–even point for IHSS cost–effectiveness occurs when 58 percent of the non–developmentally disabled population enters a SNF in the absence of IHSS. In this “break–even” scenario each dollar of combined state General Fund and county funds invested in IHSS saves one dollar of state General Fund SNF costs. There are no corresponding county savings because, while counties have a share of cost in IHSS, they do not have a share of cost in SNFs. In other words, if less than 58 percent of IHSS recipients enter a SNF in the absence of IHSS, the program would not result in a net fiscal benefit to the state and counties combined.
In addition to the 58 percent break–even scenario, Figure 13 shows the fiscal effects for nursing home entry rates under alternative scenarios—in which the SNF entry rate for IHSS recipients who are not developmentally disabled is either 38 percent or 78 percent (20 percentage points above and below the estimated break–even point). These percentages do not include the developmentally disabled recipients, who would receive increased developmental disability benefits rather than enter a SNF. The figure also summarizes the net fiscal impact under each scenario in year seven.
Figure 13
Summary of Model Results for Different Scenarios
(General Fund and County Funds, in Millions)
|
|
Percent Shifted to SNFa
|
|
|
38%
|
58%
|
78%
|
|
Total SNF and developmental disability costs with no IHSS.
|
$2,880
|
$3,822
|
$4,787
|
|
Baseline costs of IHSS.
|
3,822
|
3,822
|
3,822
|
|
Net Cost (–)/Savings (+)
|
–$924
|
—
|
$965
|
Scenario Analysis From the Perspective of the State Alone. When only considering the state General Fund costs of IHSS, the break–even point for cost–effectiveness is significantly lower than for the state and county combined. Our model shows that for the state General Fund, the break–even point for IHSS cost–effectiveness occurs when 32 percent of the non–developmentally disabled population enters a SNF in the absence of IHSS.
Figure 14 is similar to Figure, 13 except it shows the fiscal effects for nursing home entry rates from the perspective of the state General Fund alone under alternative scenarios—in which the SNF entry rate for IHSS recipients who are not developmentally disabled is 16 percent, 32 percent, or 48 percent. (A 50 percent increase and decrease compared to the estimated break–even point.)
Figure 14
Summary of Model Results for Different Scenarios
(General Fund, in Millions)
|
|
Percent Shifted to SNFa
|
|
|
16%
|
32%
|
48%
|
|
Total SNF and developmental disability costs with no IHSS.
|
$1,184
|
$2573
|
$3,356
|
|
Baseline costs of IHSS.
|
2,573
|
2,573
|
2,573
|
|
Net Cost (–)/Savings (+)
|
–$732
|
—
|
$783
|
What Do the Break–Even Points Imply With Respect to SNF Entry Rates?
Because there is no way to know how individuals and state programs would actually behave in a world without IHSS, it is difficult to determine whether IHSS is cost–effective for state government. The key question presented by our model is whether the IHSS program prevents at least 58 percent (or 32 percent from the perspective of the state alone) of the recipients who are not developmentally disabled from entering a SNF, on average.
To evaluate this question, we compared the percentage of certain subgroups that shifted from IHSS to a SNF under our model to what we assumed would shift under our working hypothesis. In other words, we subjected our model to a sort of “reality check” to see if it was reasonable. Below, we describe the aspects of our model that helped to inform this perspective.
The Implications of a Cost–Effective Scenario for the State and Counties. Under a state/county break–even scenario, 58 percent of the total caseload that is not developmentally disabled would enter a SNF facility in the absence of IHSS.
A scenario with overall SNF entry rates at 58 percent means different entry rates for the various subgroups within the IHSS caseload. This is because the exit data we collected indicates that certain recipients are more likely to enter a SNF than others. For example, this break–even scenario would mean that 100 percent of the non–developmentally disabled recipients over the age of 65 with over 200 hours of IHSS services would enter a SNF in the absence of the program. Additionally, it means that 12 percent of recipients under age six with under 80 hours of authorized services would enter a SNF in the absence of IHSS. Moreover, this means that 81 percent of all recipients over the age of 80, and 22 percent of those under the age of six would enter a SNF in the absence of IHSS. Lastly, if 58 percent of recipients enter a SNF in the absence of IHSS, our model estimates that about 43 percent (91,000) of recipients with under 2.5 hours of IHSS service per day (80 hours per month) would enter a SNF.
The Implications of a Cost–Effective Scenario for the State Alone. Under a state–only break–even scenario, 32 percent of the total caseload that is not developmentally disabled would enter a SNF.
This break–even scenario means that 63 percent of the non–developmentally disabled recipients over the age of 80 with over 200 hours of IHSS services would enter a SNF in the absence of IHSS. Looking at the other end of the age and hour spectrum, 6 percent of recipients under the age of six with fewer than 80 hours of services would enter a SNF in the absence of IHSS. In this scenario, 44 percent of recipients over the age of 80, and 12 percent of recipients under the age of six would enter a SNF. Finally, if 32 percent of recipients enter a SNF in the absence of IHSS, our model estimates that about one–quarter (about 49,000) of recipients with less than 2.5 hours of service each day would enter a SNF.
Model Results Are Generally Consistent With Our Hypothesis. The model results are generally consistent with our initial hypothesis. In other words, under all scenarios, older recipients with a high number of hours have higher SNF entry rates than younger recipients with fewer hours. Although generally consistent with our hypothesis, some elements of the results are somewhat different than we would have expected. For example, we expected that recipients with relative providers would enter SNF at a lower rate than recipients with other providers. However, the results did not seem to demonstrate a significant difference between the SNF entry rates of those with close relative providers and those with other providers.
Whether IHSS results in a net fiscal benefit or is cost–effective to the state depends on whether the costs and benefits are counted from the perspective of the state and counties combined or for the state General Fund alone. Below, we describe our findings related to the cost–effectiveness of IHSS from these two different perspectives.
IHSS Is Probably Not Cost–Effective For State and Counties Combined
When considering state and county costs combined, we find that IHSS is probably not cost–effective in the aggregate. This is because, based on our reality check of the model results, we find it unlikely that in the absence of IHSS, 58 percent or more of the non–developmentally disabled IHSS recipients would enter a SNF.
However, IHSS May Well Be Cost–Effective for the State General Fund
When only considering the effect on the state General Fund, it is very possible that IHSS is cost–effective in the aggregate. Our reality check of the model results confirms that it is reasonable to believe that, in the absence of IHSS, 32 percent or more of non–developmentally disabled IHSS recipients would enter a SNF. This finding is based on our best judgment and program knowledge of IHSS. We recognize that others could reasonably arrive at a different conclusion regarding the cost–effectiveness.
IHSS May Not Be Cost–Effective For All Recipients
The IHSS program serves a diverse set of recipients with different needs. For those at the greatest risk of institutional placement, IHSS is usually cost–effective. For some current IHSS recipients, however, the evidence suggests that the provision of IHSS services is not likely to be the difference between living in the community or living in a SNF. These are the recipients with a low likelihood of entering a SNF even in the absence of IHSS. Providing IHSS services to those recipients is not a cost–effective practice, from the state’s perspective. Each dollar invested in IHSS for recipients who would never have entered a SNF in the absence of the program adds to the overall cost of long–term care, without avoiding costs for SNF care. Although the provision of these services may increase the quality of life for those recipients, it adds to the overall cost of providing care in the community.
The exception to this is the developmentally disabled caseload. Although developmentally disabled recipients may not enter a SNF as a result of the loss of IHSS services, the increased cost of the developmental disability services they would instead obtain from RCs would exceed the state’s savings from the elimination of IHSS. In other words, even if a developmentally disabled recipient is not likely to enter a SNF absent the IHSS program, it is more cost–effective to provide that recipient with IHSS services rather than an increase to the level of developmental disability services that they were already recieving.
Cost–Effectiveness Is Not the Sole Purpose of IHSS
As we have noted throughout this report, the existence of IHSS serves several purposes. In some cases it may delay or prevent SNF placements, and in other cases it may make the lives of program recipients easier and reduce the caretaking responsibilities of friends and relatives. As a result, whether IHSS is cost–effective to state government should not be the sole basis for evaluating the merits of the program. Instead, the Legislature should consider both the cost–avoidance potential of IHSS and the enhanced quality of life for all recipients, including those who may be at minimal risk of SNF placement in the absence of the program.
In examining the issue of the IHSS program’s cost–effectiveness, we have dealt with spending in the aggregate. Our findings also indicate that, regardless of the program’s cost–effectiveness, on average, the state can take incremental steps to increase the program’s relative cost–effectiveness. For instance, targeting any service reductions to those recipients with the lowest chance of entering a SNF (younger recipients and those with fewer hours of care) would increase the overall cost–effectiveness of IHSS. To this end, the reductions included in the 2009–10 budget (discussed in the nearby box) move toward a more targeted approach to providing IHSS.
|
The 2009–10 Budget Act includes several significant changes to In–Home Supportive Services (IHSS). Specifically, the budget eliminates domestic and related services for recipients with functional index (FI) rankings of less than 4 for domestic and related tasks. Additionally, the budget eliminates all IHSS services for recipients with FI scores (the average of all of the individual FI ranks) of less than 2. We note that for both of these FI reductions, the Legislature included exceptions for individuals who may have had low ranks or scores but had overall hours of over 120 per month or who received certain services. Finally, the enacted budget includes several anti–fraud activities that are estimated to result in significant savings. These changes have not been incorporated into the scenario analysis results shown in Figures 13 and 14. This is because the caseload dynamic and cost data are not available at this time to update this analysis to reflect these recent policy changes. Additionally, at the time of this analysis, a federal judge had issued injunctions that have prevented the state from implementing both of the FI reductions. Although there is significant uncertainty about the impacts of these proposed changes to IHSS, we believe that the changes would make IHSS more cost–effective.
The Governor’s 2010–11 budget includes a proposal to eliminate all IHSS services for recipients with FI scores of less than 4. This would discontinue IHSS for about 87 percent of IHSS recipients and is estimated to result in state savings of $650 million General Fund. |
Below, we discuss further approaches which target IHSS services to those who are most likely to enter a SNF in the absence of IHSS. We note that these targeting strategies are subject to federal approval and may require federal law changes and/or additional waivers. Additionally, some proposed changes could create an incentive for recipients to request reassessments and file appeals, potentially offsetting some of their fiscal benefit. Lastly, we note that because IHSS may be enhancing the quality of life and alleviating caretaking responsibilities for recipients and families, the loss of services for those recipients who do not enter a SNF may result in additional hardships for families.
Increase Minimum Threshold for Qualifying for IHSS Services
One option the Legislature could consider to better target the program would be to raise the minimum threshold for qualifying for IHSS services. For example, each task could have a different minimum FI ranking that would be required to receive the particular task. Recipients could be required to have a FI ranking of at least 4 to receive authorization for dressing assistance, but only a 3 to receive authorization for bathing assistance. By increasing the minimum ranking for qualification, services would be targeted to those with the highest impairment levels for those particular tasks. We note that the use of FI rankings and scores as a method for targeting IHSS services is currently being challenged in court. However, there are other ways to target services, such as making certain services only available to recipients who are authorized to receive a certain minimum number of hours, or requiring SNF certification to qualify for particular services.
A New Service Delivery Approach
The Legislature could alter the delivery of IHSS services based on the level of recipient need. As noted earlier, the IHSS program consists of a diverse caseload with varying levels of need. As a result, it may make sense to construct a program that recognizes the variation in the needs of different segments of the caseload, and provides different types of services accordingly to each segment. For example, under this approach, the more frail recipients could continue receiving IHSS, while other recipients could instead receive funds to purchase goods and services to assist them in remaining in their own homes.
As shown in Figure 15, a new service delivery approach to IHSS could establish different tiers of available services based on the recipient’s overall level of need. Recipients in the first tier would be the most frail recipients (in this example, the severely impaired with over 195 authorized hours per month) for whom services would remain unchanged. The middle tier of recipients could receive a variation on cash and counseling services, with authorization to spend a set allocation of funds on the purchase of goods and services, such as in–home care or home modifications, such as a wheelchair ramp, to assist them in remaining in their own home. (The text box provides more information about the cash and counseling approach.) Tier two recipients would also receive increased case management and other assistance from their IHSS social worker. The third tier of recipients would receive no IHSS services and no allocation of funds. Instead, these recipients would receive quarterly visits from a social worker who would monitor the condition of the recipient and provide case–management services. The intent of monitoring this group would be to transfer them to tier one or two if their condition met the qualification levels of those tiers.
|
Some states have implemented a cash and counseling model of self–directed, in–home care. The cash and counseling program provides recipients with a monthly sum of available funds, based on the cost of the hours of in–home services that they would otherwise have been authorized to receive. Recipients have more flexibility in the use of these funds than they would in a program like In–Home Supportive Services (IHSS). They can use these monthly sums to set wage levels and hire a provider, install wheelchair ramps, and purchase goods that make it easier to remain at home—expenditures not permitted now under IHSS. Cash and counseling recipients work directly with county officials to craft spending plans, write checks, and handle payroll taxes. |
Figure 15
Example of a New Tiered Approach toDelivering In–Home Supportive Services
|
|
Affected Recipients
|
IHSS Policy Change
|
|
Severely–impaired recipients (195+ hours of care per month).
|
Tier One—Recipients with at least 195 authorized hours per month.
|
No change.
|
|
Non–severely impaired recipients (less than 195 hours of care per month).
|
Tier Two—Recipients with between 80 and 194 authorized hours per month.
|
Provide (1) cash for purchase of goods and services and (2) increased case management.
|
|
|
Tier Three—Recipients with between 1 and 79 authorized hours per month.
|
No IHSS or cash assistance. Increased social worker case management.
|
Although our example bases the tiers on the number of authorized hours, the Legislature could consider basing the tiers on other factors related to the level of recipient need—such as the recipient’s FI score or whether they receive developmental disability services or are certified for SNF placement. Additionally, for purposes of illustration, our example includes three tiers. The Legislature could consider creating additional service tiers.
Such a major reform to the IHSS program which would require legislative input on many details, and likely require significant changes to the current Medicaid State Plan and waiver agreements with the federal government. However, we believe that a tiered approach to service delivery would effectively target resources to those with the highest risk of SNF placement.
Potential Savings
These types of targeting strategies would likely result in long–term savings to the state. The options discussed above may be implemented individually or in combination. The amount of savings that could be achieved under each policy, or combination of policies, would vary depending upon implementation, but could range from the low millions of dollars to about $400 million annually. However, our analysis indicates that there is a limit to this approach. If these reductions are taken so far as to shift a significant number of recipients from IHSS to SNFs, the potential savings could be more than offset by larger SNF costs.
The IHSS program is the fastest–growing major social services program. Evaluating the cost–effectiveness of IHSS is a complicated task that raises many issues. As we have pointed out in this report, whether IHSS may result in a net fiscal benefit to the state depends on which cost and benefit perspective is being considered—the state and counties combined or the state General Fund alone. Additionally, there are other non–fiscal benefits that are not captured in this fiscal cost–effectiveness analysis.
Although our model demonstrates that the program may well be cost–effective to the state General Fund in the aggregate, there are some IHSS recipients for whom the investment in IHSS may have no effect on the state’s SNF costs. In this report, we have identified some ways that the Legislature could target IHSS services to those most likely to enter a SNF in the absence of the program. Given the state’s severe fiscal difficulties, we recommend that the Legislature consider targeting IHSS program services to those with the highest risk of SNF placement in order to achieve significant additional state savings.