Analysis of the 2008-09 Budget Bill: Perspectives and Issues
Both the U.S. and California experienced continued economic expansion with modest inflation in 2007. For the year as a whole, though, economic growth was slower than in recent years and less than previously forecast. The pace of growth also varied considerably within the year, making it difficult at times to discern exactly where the economy was heading. The year’s fourth quarter was quite soft, however, making it clear the economy had fallen into a pronounced slow–growth mode and its performance in 2008 was likely to be very subdued.
Like most economists at this time, for 2008 we forecast that growth will continue but be very modest for the nation and California. For the year as a whole, 2008 growth will average well below its 2007 pace, but with the first half of the year especially weak. Later in the year, things should start to strengthen a bit as the housing sector begins to stabilize. However, significant improvement will likely not occur until 2009. We expect that the state’s performance will generally be similar to the nation’s, although somewhat weaker in those areas most directly affected by the housing market’s problems.
The current economic expansion has now lasted over six years and, thus, is comparatively old by historical standards. Although most economists were still predicting slow growth but not an outright recession as of the start of 2008, continued negative economic reports caused concerns to spread that a downturn could very easily develop. By February, some economists had shifted to predicting a mild recession. Thus, the economy clearly faces downside risks. Reflecting this concern, federal policy makers adopted in February an economic stimulus package containing tax rebates and investment incentives to provide support to the economy.
Real gross domestic product (GDP) in the fourth quarter of 2007 grew at an annual pace of only 0.6 percent, but still rose 2.5 percent compared to the fourth quarter of 2006. Figure 1 shows that most major GDP sectors expanded in real (inflation–adjusted) terms during the year. The one exception involved residential construction—primarily housing—which fell sharply. Specifically:
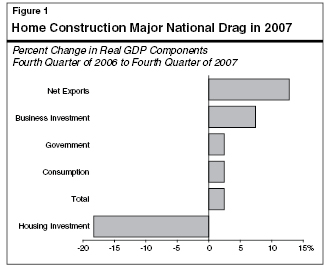
- Net exports—which equals exports minus imports—had the greatest percentage improvement and accounted for more than one–fourth of GDP growth. Although net exports themselves remain negative, reflecting the nation’s large annual merchandise trade deficit of around $700 billion, they became less negative in 2007 than in 2006. This was because the rate of growth in our exports significantly exceeded the rate of growth in our imports, due to the combination of healthy economic growth abroad (which increases foreign demand for our domestically produced exports) and a declining dollar (which also stimulates our exports and discourages imports).The decline in our trade deficit was stimulative because it created less of a drag on our economy.
- Business spending—the next–fastest–growing output category—involves expenditures by firms on things like computers, software, networks, other equipment, and new facilities (this is referred to as nonresidential investment). This category increased by a healthy 7.4 percent in real terms on a fourth–quarter to fourth–quarter basis.
- Government spending rose 2.5 percent, reflecting a 1.7 percent increase at the federal level and 3 percent increase at the state and local level.
- Consumer spending—which accounts for over two–thirds of total GDP—also increased 2.5 percent during the year. However, this component’s growth slowed throughout 2007 from an annual rate of 3.7 percent in the first quarter to only 2.0 percent in the fourth quarter. This reflected such factors as moderating hiring and wage gains, high levels of consumer credit, reduced home–equity wealth from softening housing prices, tighter borrowing standards, and less consumption spending related to the building and sales of homes.
- On the downside, home construction (technically referred to as residential investment) fell by 18 percent, reflecting major declines in single–family home construction and moderate declines in construction of apartments.
The most striking and negative economic developments during the year involved the deepening crisis involving housing and the run–up in crude oil prices.
As 2007 progressed, the problems relating to the housing sector continued to deepen and took on new dimensions. Residential building activity in the U.S. contracted further, home sales weakened, housing prices continued to soften, and mortgage delinquencies and foreclosures rose. In addition, financial market problems not only intensified in the narrowly defined subprime mortgage market, but also increasingly spilled over into certain portions of the home–equity loan market, non–subprime mortgage market, equities markets involving financial firms who invested in various mortgage–backed securities, and international investors. The latter include some major foreign governments, like China, who have purchased billions of dollars of such securities. As of early 2008, lenders and investors had already written off some $120 billion of uncollectable mortgage loans.
More housing market deterioration is expected in the near future. Although certain steps such as loan modification programs have been recently taken, a large volume of subprime mortgages are scheduled to reset to higher interest rates during 2008. This will bring the threat of even more delinquencies and foreclosures. Thus, the ongoing problems relating to the housing sector are a major uncertainty and negative factor in the economic outlook for 2008 and 2009.
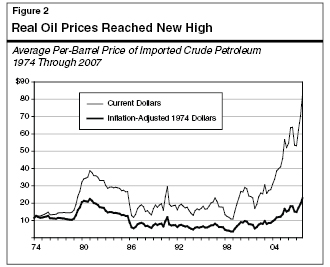
Oil prices experienced a sharp rise in 2007 and recently reached record highs. As shown in Figure 2, the average price of imported oil (which applies to most of the oil we consume) stood at about $30 per barrel as recently as early 2004, rose sharply in 2006 when it peaked at $68 in August, and then fell to near $53 as of the close of 2006. Prices then dropped further during the first three weeks of January 2007, to $50, but then moved back up significantly throughout 2007. In the fourth quarter of 2007, Figure 2 shows that the real price of oil surpassed its all–time quarterly peak that was reached more than 25 years ago. In early January, its price even briefly topped $100 on the futures market, but since then has bounced around and retreated a bit into the low $90s as of late January. The high oil prices experienced in 2007, while not causing a major downturn or recession, have been one of the factors contributing to the sluggish economy by adversely affecting consumption spending, business investment, corporate profits, and our trade balance.
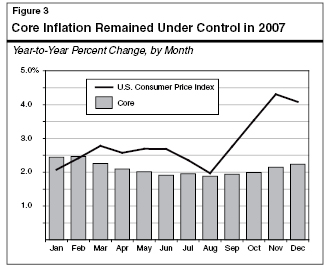
One of the major concerns over the past couple of years has been that continued economic expansion and rising energy prices might result in a significant increase in inflation. One reason is that higher energy prices directly affect such items as gasoline prices. A second is that higher energy costs can spill over into the rest of the economy as businesses, no longer able to absorb such costs, start to pass them along to consumers by raising the prices of their products and services.
Figure 3 shows that during 2007, the Consumer Price Index (CPI) trended up significantly toward the end of the year, largely reflecting the direct effects of sharply increased energy–related prices. For example, the December 2007 CPI stood 4.1 percent above one year earlier. The good news, however, is that “core” inflation (as measured by the GDP consumption deflator excluding food and energy costs) remained fairly stable over the year, suggesting that prices at large generally remained under control. Factors contributing to this were relatively good productivity gains and only modest increases in unit labor costs. As 2008 starts, the general outlook for inflation is favorable. However, a key challenge will be to see if a “balancing act” can be maintained by policymakers between providing necessary stimulus to the economy through tax incentives and reduced interest rates without triggering additional inflation, especially given the inflationary threat that high energy prices continue to pose.
U.S. after–tax profits soared by 35 percent in 2004 and 32 percent in 2005, followed by a modest but still healthy increase of 14 percent in 2006. These gains, which reflected significant increases across a wide variety of industries, reflected such factors as major increases in oil–related profits and the ongoing benefits of high productivity and sales growth on businesses’ bottom–line earnings.
In 2007, however, national profit growth slowed markedly, to less than 5 percent. Although profits in many industries continued to be relatively good for the year, earnings were soft or negative in several areas, including for many financial firms caught up in the subprime mortgage market’s problems and companies related directly and indirectly to housing–related activities. In addition, as noted in “Part III” of this volume, California profits appear to be somewhat less robust than what the national figures would indicate, possibly reflecting the greater negative impact that the housing downturn and its related developments are having in our state.
Real GDP growth appears to have decelerated sharply and dropped to less than 1 percent in the fourth quarter of 2007, well below its pace in the preceding two quarters. Quarterly job growth also continued to be soft, the number of unemployed in December had risen to 7.7 million (up 13 percent in one year), and housing activity plummeted. Preliminary data for the month of January showed an actual modest decline in employment. Given this, the prospects for near–term growth are weak. Most economists were concerned that the economy was vulnerable to a downturn—especially if hit with a strong shock, such as from further oil price hikes. Although some were predicting an outright recession, the general view was that even if a recession did occur, it would likely be fairly mild by historical standards. This was due to the lack of major imbalances involving such things as excessive inventories. Also, amidst the negative news, some good things were reported, such as a decent jump in late January involving durable goods orders. In addition, the nation’s monetary authorities reduced interest rates in two steps by 1.25 percentage points in January. A federal economic stimulus package containing tax rebates and investment incentives was adopted in February to provide further support for the economy. Thus, the consensus view as of early 2008 was for subdued, but continued, national economic growth for the year as a whole.
Like the nation, California saw continued economic expansion in 2007. However, it too experienced considerable economic slowing compared to 2006 and ended the year on a soft note. Job growth, for example, slowed to a crawl at year–end and was under 1 percent for the year as a whole. Like the nation, the biggest drags for the state were from the housing downturn and higher energy costs.
The adverse impacts of the housing downturn on overall economic growth have been particularly severe for California, given its well–above–average dramatic run–up in housing prices and large volume of real estate activity that occurred between 2001 and 2005. In retrospect, much of this above–average activity related to subprime lending transactions and other types of speculative real estate behavior. This speculative bubble has now popped and the housing market is currently in the painful process of deflating. Based on past experience with real estate bubbles of this sort in the state, the full process of adjustment can take a number of years until housing prices return to sustainable levels and excessive housing inventories are worked off. Thus, the state’s housing market will likely remain weak for some time.
How Far Have Home Prices Dropped? Figure 4 shows the upward trend in median California housing prices that occurred since 2000 and what has happened to them during the housing downturn. It indicates that the statewide median price rose from about $227,000 at the start of 2000 to a peak of over $598,000 in April 2007. Since then, however, the median price has dropped by over 20 percent, to roughly $475,000. Despite this substantial reduction, the current median price is still equal to about what it was at the start of 2005 and more than double that of 2000. As Figure 5 indicates, however, the recent price drops have varied significantly by geographic area, with some seeing declines of more than 25 percent and others well under 10 percent. Given that the housing market is still correcting, further price declines are likely, at least in many areas of the state. It also is the case that despite the recent price declines, housing affordability remains a major problem in California.
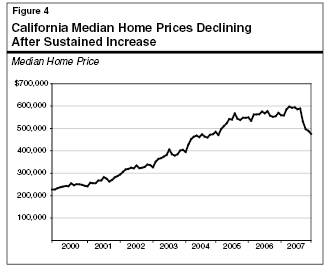
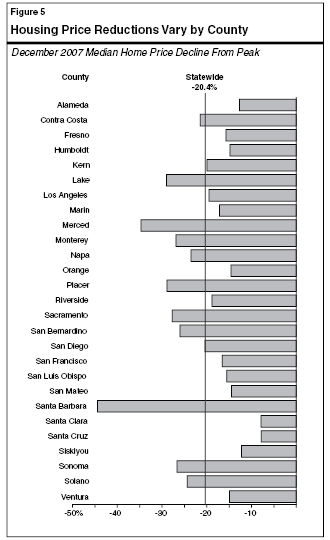
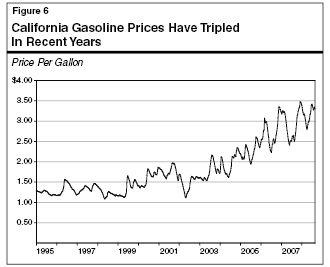
Figure 6 shows that California’s average gasoline prices, largely reflecting the record level of crude oil prices experienced in 2007, trended up during the year and, at one point, reached a new record of nearly $3.50 per gallon. As a result, gasoline prices have nearly tripled in recent years. The fact that gasoline consumption, despite some softening, has thus far proved fairly resistant to these higher prices means that they have had the effect of putting increasing pressure on consumers’ pocketbooks and their spending on other types of goods and services.
The housing downturn and high energy prices caused weaknesses during the year to spill over into a number of different industries. For example, retail spending on automobiles, home furnishings, and a number of other durable goods was soft, as were finance–related activities associated with real estate generally and home sales specifically. However, many of the economy’s other sectors performed relatively well. For example:
- Continued growth occurred in California’s high–tech and related professional services industry. This high–paid sector includes software development, computer systems and design, biotechnology, and pharmaceuticals.
- Continued strength also was present in information–related industries (including motion pictures, broadcasting, sound recordings, publishing, and Internet service providers).
- Solid growth occurred in international trade, which is benefiting California manufacturers and farmers that sell abroad, as well as transportation, warehousing, and distribution activities associated with trade activity passing through California’s ports.
- Nonresidential construction, though having slowed from 2006, was still doing relatively well at year–end 2007.
These positive factors suggest that, despite its housing downturn and other problem areas, the state’s overall economy is still in decent shape and likely to continue growing in 2008, though at a subdued pace.
The budget’s economic forecast for the remainder of 2007–08 and 2008–09 is for modest growth and inflation. Both the national and California economies are expected to experience slower growth in 2008 than in 2007—especially in the earlier parts of 2008—followed by somewhat better but still modest growth in 2009. As was true in 2007, continuing problems in the housing sector and high energy prices are seen as the main forces holding down growth.
Figure 7 displays the administration’s economic forecast. It shows that for the nation, U.S. GDP growth on an annual average basis is projected to decline from an estimated 2.1 percent in 2007 to 1.9 percent in 2008, before rebounding to 2.9 percent in 2009. Quarterly growth is expected to bottom out at a 0.7 percent annual rate in the first quarter of 2008, then trend back up to 2.9 percent by the fourth quarter. In terms of job growth, it is projected to bottom out at 0.8 percent in 2008, while inflation is forecast to remain modest. The administration’s forecast assumes that California’s economy will generally grow in line with the rest of the nation, though just a little slower. It projects that personal income—the broadest single measure readily available of state–level economic activity—will slow from a growth rate of 5.6 percent in 2007 to 4.8 percent in 2008 and then rise some to 5.2 percent in 2009. Job growth is forecast to drop to 0.7 percent in 2008 before firming up a bit to 1 percent in 2009. Housing activity is expected to be very weak, with new residential building permits of only 95,000 in 2008. This compares to an annual average of 160,000 over the past ten years.
|
|
|
Figure 7
Summary of the Budget�s Economic Outlook |
|
|
|
Estimate |
|
Forecast |
|
|
2006 |
2007 |
|
2008 |
2009 |
|
U.S. Forecast |
|
|
|
|
|
|
Percent change in: |
|
|
|
|
|
|
Real gross domestic product |
2.9% |
2.1% |
|
1.9% |
2.9% |
|
Personal income |
6.6 |
6.5 |
|
4.9 |
5.0 |
|
Wage and salary employment |
1.9 |
1.3 |
|
0.8 |
1.2 |
|
Consumer Price Index |
3.2 |
2.8 |
|
2.2 |
2.0 |
|
Unemployment rate (%) |
4.6 |
4.6 |
|
5.0 |
5.0 |
|
Housing starts (000) |
1,812 |
1,346 |
|
1,021 |
1,295 |
|
California Forecast |
|
|
|
|
|
|
Percent change in: |
|
|
|
|
|
|
Personal income |
6.5% |
5.6% |
|
4.8% |
5.2% |
|
Employment: |
|
|
|
|
|
|
Payroll survey |
1.7 |
0.8 |
|
0.7 |
1.0 |
|
Household survey |
1.5 |
1.2 |
|
1.0 |
1.5 |
|
Taxable sales |
4.0 |
0.9 |
|
3.4 |
4.6 |
|
Consumer Price Index |
3.9 |
3.3 |
|
2.6 |
2.7 |
|
Unemployment rate (%) |
4.9 |
5.3 |
|
5.7 |
5.6 |
|
Housing permits (000) |
163 |
117 |
|
95 |
104 |
|
|
We also expect the national and state economies to continue to experience growth over the forecast period, but at a bit slower pace than does the administration. We also share the view that the economy will be weakest in the first half of 2008, and then start to firm up as the year progresses. Our forecast incorporates more up–to–date information than the administration’s forecast could take into account, given that the budget’s figures had to be prepared a couple of months ago.
As shown in Figure 8, we forecast that real GDP growth will ease from 2.2 percent in 2007 to 1.6 percent in 2008, before strengthening to 2.7 percent in 2009 and 2.9 percent in 2010. This compares to an average of a bit over 3.1 percent for the past decade. The 2008 slowdown reflects substantial weakness in housing activity as well as a slightly slower pace for consumer spending and nonresidential investment activity. Specifically:
- Housing–related investment, after declining by 17 percent in 2007, is projected to fall by even more—over 20 percent—in 2008, before stabilizing and turning up modestly by 5 percent from this low base in 2009. On a quarterly basis, this sector has been in decline since late 2005, and is expected to continue declining through the end of 2008.
- Real consumer spending is expected to slow from 2.9 percent in 2007 to about 1.7 percent in 2008, before rising to 2.4 percent in 2009. The 2008 figure is well below the projected growth in real disposable income, reflecting declines in consumer confidence, vehicle sales, and other durable goods purchases.
- Business–related fixed investment growth is expected to ease, from 4.5 percent in 2007 to only 2.6 percent in 2008 and 2.5 per
cent in 2009. This reflects steady growth in business spending on equipment and software—especially information processing and computers—but weaker spending on structures. The ongoing spending on information technology (IT) equipment is a positive force in California’s outlook, because many high–tech products are designed in California.
- The trade deficit is projected to decline through 2009, with export growth significantly outpacing growth in imports. This reflects the positive impacts of a weaker dollar on exports and lower (though still high) prices for oil imports. (Nevertheless, despite this improvement, the trade deficit still will remain in excess of $600 billion by 2010, suggesting that there will be further downward pressures on the dollar.)
|
|
|
Figure 8
Summary of the LAO's Economic Outlook |
|
|
Estimate |
|
Forecast |
|
|
2007 |
|
2008 |
2009 |
2010 |
|
U.S. Forecast |
|
|
|
|
|
|
Percent change in: |
|
|
|
|
|
|
Real gross domestic product |
2.2% |
|
1.6% |
2.7% |
2.9% |
|
Personal income |
6.2 |
|
4.7 |
4.8 |
5.3 |
|
Wage and salary employment |
1.2 |
|
0.7 |
1.1 |
1.4 |
|
Consumer Price Index |
2.9 |
|
2.8 |
2.5 |
2.2 |
|
Unemployment rate (%) |
4.6 |
|
5.2 |
5.2 |
5.0 |
|
Housing starts (000) |
1,339 |
|
980 |
1,200 |
1,500 |
|
California Forecast |
|
|
|
|
|
|
Percent change in: |
|
|
|
|
|
|
Personal income |
5.9% |
|
4.7% |
5.1% |
5.5% |
|
Payroll employment |
0.8 |
|
0.6 |
0.9 |
1.3 |
|
Taxable sales |
0.8 |
|
3.6 |
3.8 |
5.3 |
|
Consumer Price Index |
3.3 |
|
2.5 |
2.8 |
2.7 |
|
Unemployment rate (%) |
5.3 |
|
6.1 |
6.0 |
5.8 |
|
Housing permits (000) |
110 |
|
90 |
95 |
115 |
|
|
Given the recent volatility in the world oil markets, a key question for both the U.S. and California economic outlooks is whether oil prices will remain roughly where they are, rise further, or drop down. There is currently a wide range of forecasts for future oil prices. Some energy analysts believe that the recent factors driving prices upward are largely transitory, related to political factors and speculative forces unrelated to underlying supply and demand factors. Others, however, believe that high and rising prices are here to stay, due to limited refining capacity and investment, and growing worldwide oil demand. Although short–term oil price volatility is likely to continue, we are assuming that prices will remain high but retreat somewhat from their current level, averaging roughly $80 per barrel in 2008.
Reflecting the weak economy, both inflation and interest rates should soften in 2008 from their 2007 levels. For example, we expect CPI inflation to average 2.8 percent in 2008 and 2.5 percent in 2009.
In February, a federal economic stimulus package was adopted to provide additional support to the economy. This package will likely be largely preventative in nature, reducing the odds that the economy will slide into a significant downturn due to its housing and other problems, as opposed to leading to significantly higher economic growth. Thus, even with the package in place, 2008 economic growth will likely be subdued.
We forecast that the recent slowdown in California’s economy will continue through 2008, reflecting ongoing softness in real estate and some sluggishness in retail spending. By the end of the year, however, real estate–related sales and construction are expected to have bottomed out, providing a foundation for a partial rebound in economic growth in 2009 and thereafter. In terms of our specific forecast:
- Personal income growth is projected to slow from 5.9 percent in 2007 to 4.7 percent in 2008, before picking up to 5.1 percent in 2009 and 5.5 percent in 2010. The 2008 slowing is heavily influenced by a decline in jobs, wages, and profits related to real estate activity.
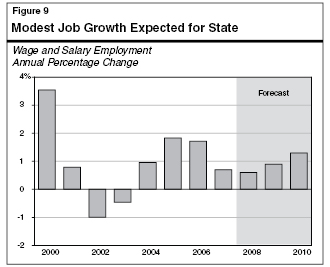
- Wage and salary employment growth (see Figure 9) is projected to slow from an already–weak 0.8 percent in 2007 to an even lower 0.6 percent in 2008, with only minor strengthening to 0.9 percent in 2009, before improving to 1.3 percent in 2010. The main factor behind the slower job growth is soft construction–related activity. In contrast, job growth in most other sectors is expected to remain fairly steady, although in many cases only modest.
- As discussed in “Part III” of this volume, taxable sales are projected to grow to a modest 3.6 percent in 2008 and 3.8 percent in 2009, before rising to 5.3 percent in 2010. These rates are all less than personal income growth, and largely relate to reduced sales of building–related materials, home furnishings, and light vehicles.
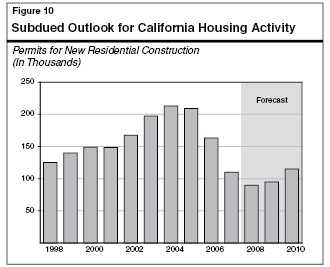
- Reflecting the housing market’s current downturn, new residential building permits issued in California—a key measure of forthcoming residential construction activity—are expected to total only 90,000 in 2008 and 95,000 in 2009 (see Figure 10).
- Regarding nonresidential building permits, we expect their dollar volume to continue modestly expanding through 2008 and 2009, reflecting ongoing needs for the construction of industrial facilities and office buildings to service the state’s growing population.
The key risks to our current national and state economic forecasts remain the same as for the past three years—housing and energy prices. Although the housing market has been undergoing considerable adjustment, it still does not appear to have stabilized and, in fact, more adjustments are likely. Thus, there remains the risk that home sales, construction, and prices could fall considerably more before the market starts to rebound. In addition, the financial markets are still unsettled, related to the mortgage market meltdown and its spillover effects on financial institutions and investors. Similarly, despite some recent improvement, world oil markets remain tightly balanced, and supply disruptions or faster–than–anticipated growth in energy demand could result in significantly higher oil and gasoline prices than we are anticipating. Foreign growth could also slow, especially if energy costs rose, which would hurt our economy because exports have been a key source of our growth in recent years.
There is also, of course, some upside potential. For example, oil prices could retreat, given that current prices are well above that needed to operate profitably in the industry. In addition, certain sectors continue to perform well, suggesting that the underlying economy is both resilient and in decent shape, and this could lead to somewhat more growth. Likewise, productivity growth could come in a bit faster and closer to the average of recent years, versus the reduced level that most forecasts, including ours, assume. This would result in lower inflation, greater corporate earnings, and higher real personal income growth.
Figure 11 compares our economic forecasts for the nation and California to our November 2007 forecast, as well as to a variety of other economic projections made in recent months by other forecasters. These include the projections made by the University of California,
|
|
|
Figure 11
Comparisons of Recent Economic Forecastsa |
|
(Percent Changes) |
|
|
Forecast |
|
|
2007 |
2008 |
2009 |
|
United States Real GDP: |
|
|
|
|
LAO November |
2.1% |
1.9% |
2.9% |
|
UCLA December |
2.1 |
1.9 |
2.9 |
|
DOF January |
2.1 |
1.9 |
2.9 |
|
Blue Chip "Consensus"b
January |
2.2 |
2.2 |
2.7 |
|
LAO February |
2.2 |
1.6 |
2.7 |
|
California Payroll Jobs: |
|
|
|
|
LAO November |
1.1% |
1.0% |
1.3% |
|
UCLA December |
1.3 |
0.5 |
0.9 |
|
DOF January |
0.8 |
0.7 |
1.0 |
|
Blue Chip "Consensus"c
February |
0.7 |
0.6 |
1.1 |
|
LAO February |
0.7 |
0.6 |
0.9 |
|
California Personal Income: |
|
|
|
|
LAO November |
5.3% |
4.9% |
5.3% |
|
UCLA December |
5.6 |
3.5 |
4.6 |
|
DOF January |
5.6 |
4.8 |
5.2 |
|
Blue Chip "Consensus"c
February |
5.9 |
4.3 |
5.1 |
|
LAO February |
5.9 |
4.7 |
5.1 |
|
California Taxable Sales: |
|
|
|
|
LAO November |
3.2% |
3.8% |
4.7% |
|
UCLA December |
3.0 |
3.2 |
4.0 |
|
DOF January |
0.9 |
3.4 |
4.6 |
|
Blue Chip "Consensus"c
February |
0.8 |
2.7 |
3.7 |
|
LAO February |
0.8 |
3.6 |
3.8 |
|
|
|
a Legislative
Analyst's Office (LAO); University of California, Los Angeles
(UCLA); and Department of Finance (DOF). |
|
b Average forecast
of about 50 national firms surveyed by Blue Chip Economic
Indicators. |
|
c Average forecast
of organizations surveyed by Western Blue Chip Economic
Forecast. |
|
|
Los Angeles (UCLA) Business Forecast Project in December 2007, the consensus forecast published in the Blue Chip Economic Indicators (January 2008), the consensus outlook forecast in the Western Blue Chip Economic Forecast (February 2008), and the 2008–09 Governor’s Budget forecast.
Our 2008 projections for most variables shown are generally less optimistic than our November forecast. This is because of the additional information that recently became available in time for our update. Certain of the other forecasts shown also will be revised to incorporate these recent developments when they are next updated. To varying degrees, however, all of the projections shown in Figure 11 currently call for slowing growth in 2008 and a partial rebound in 2009.
California’s demographic trends both directly and indirectly affect the state’s economy, revenue collections, and expenditure levels. For example, they influence the size of the labor force, the demand for homes and automobiles, the volume of taxable sales, and the amount of income taxes paid. Similarly, the population and its age distribution affect school enrollments and public programs in many other areas, such as health care and social services. Consequently, the state’s demographic outlook is a key element both in estimating economic performance and in assessing and projecting the state’s budgetary situation.
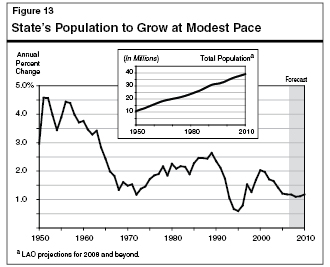
Figure 12 summarizes our updated state demographic forecast. We project that California’s total population will rise to 38.2 million in 2008, 38.6 million in 2009, and 39.1 million in 2010. These population projections use as their starting point published 2000 Census data for California, and incorporate developments since then regarding births, deaths, and migration flows.
|
|
|
Figure 12
Summary of LAO's California Demographic
Forecast |
|
(Population in Thousands) |
|
|
2008 |
2009 |
2010 |
|
Total population (July 1 basis) |
38,186 |
38,613 |
39,068 |
|
Changes in population: |
|
|
|
|
Natural increase (births minus deaths) |
330 |
327 |
335 |
|
Net in-migration (in-flows minus
outflows) |
85 |
100 |
120 |
|
Total Changes |
415 |
427 |
455 |
|
Percent Changes |
1.1% |
1.1% |
1.2% |
|
|
Weak Economy Causing Slower Growth. Due to subdued economic performance, California’s population growth has recently slowed and we project that this will continue for the next few years. The state’s population is projected to grow at an average rate of a bit over 1.1 percent annually over the next three years. As can be seen from Figure 13, this is down from the 1.5 percent average for the 2002–through–2005 period and substantially less than the 2–percent–plus growth characterizing the 1980s and early 1990s. In numeric terms, 1.3 million new Californians will be added over the next three years. Figure 12 shows that this reflects an average of 432,000 yearly—about the size of such cities as Long Beach, Fresno, and Sacramento, and very similar to many smaller states. Although a sizable number, Figure 13 indicates that this amount (like the percentage growth rate) is well below that of certain earlier years. In 2000, for example, the state’s annual population growth peaked at 677,000.
California’s population growth can be broken down into two major components—natural increase (the excess of births over deaths) and net in–migration (persons moving into California from other states and countries, minus people leaving the state for other destinations). The population growth associated with natural increase is predicted to account for somewhat over three–fourths of California’s projected annual growth over the forecast period and is assumed to be fairly stable. Net in–migration accounts for the other approximately one–fourth of the growth over the period. Historically, however, this component has varied greatly in response to changing economic conditions in the state and, in previous years, has accounted for as much as one–half of the state’s annual growth. Our specific projections for these demographic components are summarized below.
Natural Increase. We project that the natural increase component will contribute an average of about 330,000 new Californians annually over the forecast period. This reflects both some increase in birth rates and growth in the female population of child–bearing age groups. Regarding birth rates, these are predicted to rise somewhat from their historically low levels of recent years, based on recent preliminary information showing that a “baby boomlet” has been taking place in the country reflecting somewhat increased birth rates among essentially all age and ethnic categories. These reports suggest that in 2006, there were nearly 4.3 million births in the nation—the most since the end of the baby boom in 1961, 45 years earlier. This development has reportedly increased the nation’s fertility rate to 2.1—a significant fact since that is the rate required for population to replace itself over time.
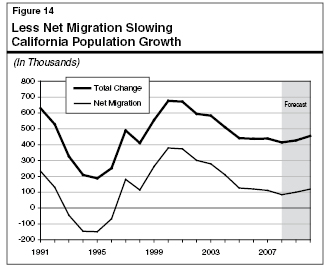
Net In–Migration. As shown in Figure 14, this component dropped by 70 percent—from 379,000 as recently as 2000 to only 111,000 in 2007—due mainly to softness in the state’s economy. As the figure also shows, variations in migration largely explain variations in total population change over time.
The net migration component has two parts—foreign net migration (people coming into California from other nations minus people leaving California for other countries) and domestic migration (people coming into California from other states minus people leaving California for other states). The domestic migration element is by far the most volatile and is the reason for the sharp migration drop in recent years. Specifically:
- Foreign Migration. The positive net migration we are projecting is entirely attributable to net migration from other nations. Although it has dropped about 30 percent in recent years largely due to the economy, it still has proved to be much less sensitive to the economy than domestic population flows between states. We forecast net foreign migration will average 190,000 over the next three years, after which it will start to trend back upward as the economy strengthens. Included in the foreign migration forecast is an estimate, based on federal sources, that there are slightly over 50,000 net undocumented immigrants arriving in California annually.
- Domestic Migration. This is arguably the single most difficult demographic variable to forecast at this time. The available data indicate that this component totaled over 100,000 in 2001, started dropping in 2002, turned negative by 2005 (that is, more people left California for other states than flowed–in from them), and became even more negative in the following couple of years—with net outflows reaching nearly 90,000 in 2007. In large part, this appears attributable to California’s overall economic slowing, only modest job growth, and high relative home prices. Our economic forecast
is not strong enough to induce significantly more net domestic in–migration from other states in the near future. Thus, although we do expect the net domestic outflows to bottom–out in 2008 at 105,000 and then taper off and eventually reverse themselves as the economy and housing sector strengthen, we do not foresee a return to net interstate population in–flows for several years.
Given the above, we expect migration’s overall contribution to California’s population growth over the next few years to be relatively modest by historical standards.
The implications of demographic trends for the budget depend not only on the total number of Californians, but also on their characteristics. California is well known for having one of the world’s most dynamic and diverse populations, including a balanced age distribution, an increasingly rich ethnic mix, and a large number of in–migrants. The state’s age and ethnic mix are shown in Figure 15.
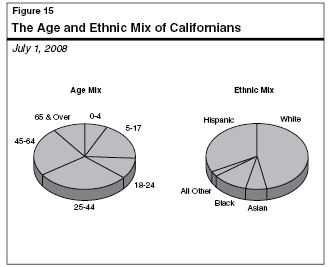
Hispanic Population Share Rising. Regarding race and ethnicity, the amounts and rates of population growth along these dimensions will differ significantly for different groups. The Hispanic population is forecast to experience especially strong growth, averaging over 2.3 percent annually, and accounting for nearly two–thirds of California’s total population growth between 2007 and 2010.
Growth to Vary by Age Group. The age–related characteristics of California’s population growth are especially important from a budgetary perspective, given their implications for such program areas as education, health care, and social services. Figure 16 shows our forecasts for both the percentage and numeric changes in different population age groups.
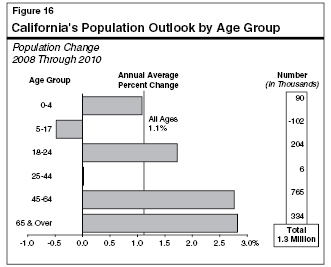
- “Baby Boomers” Swelling 45–to–64 Age Group. The 45–to–64 age group (largely the baby boomers) continues to be by far the fastest growing segment of the population numerically and the second–fastest percentage wise. Nearly 765,000 new people are expected to move into this age category over the next three years for an annual average growth of 2.8 percent, as the tail–end of the baby boom generation moves into its mid–40s. In contrast, the leading edge of the baby boomers will be only 64 years of age by the end of the forecast period, and thus still are occupants of this age category.
- Slow Growth for Children. At the other extreme, slow three–year average growth—only about 1 percent—is anticipated for preschoolers, while the K–12 school–age population is expected to decline slightly. This reflects several factors. One is the movement of children of the “baby–boom” generation beyond the upper–end of the 5–to–17 age group, which partially explains the above–average growth in the 18–24 age category. Other factors include the slower rate of net in–migration, and the decline in birth rates in recent years that has reduced the number of children moving into the preschool and school–age categories.
- Rapid Growth for the Elderly. The single–fastest–growing age group percentage wise and second–fastest numerically is the 65–and–over category, reflecting the well–known “graying” of the population. This cohort is expected to increase at an annual average pace of over 2.8 percent.
Rates of growth over the forecast period will also differ by region of the state. They will be above average for the state’s Central Valley, Inland Empire, and foothills areas. This will occur as the availability of land allows population to continue to “fill in” and attract migrants both from outside of California and intrastate migrants from the more–congested coastal areas where growth will necessarily be constrained. Such high–growth regions will increasingly face new challenges in providing the public services and infrastructure to accommodate growth.
California’s continued population growth—including its age, ethnic, and migratory characteristics—can be expected to have many implications for the state’s economy and public services in 2008–09 and beyond. For example, strong growth of the 45–to–64 age group generally benefits tax revenues since this is the age category in which people normally earn their highest wages and salaries. Alternatively, the lack of growth statewide in the 5–to–17 age group translates into significant declines in enrollment for many school districts. Regarding the strong growth in the elderly population, this will be putting upward pressures on health–related program costs.
More general examples of demographic influences include the following:
- The prospects for continued economic growth will benefit from an expanded labor force, due to a stronger consumer sector and the increased incomes that accompany job growth.
- However, overall demographic growth will also produce additional strains on the state’s physical and environmental infrastructure, including demands on the energy sector, transportation systems, parks, and water–delivery systems.
- Similarly, the graying of the baby boomers will eventually place strains on the state’s health programs and related services, including the portion of Medi–Cal related to the elderly and disabled.
- The increasing ethnic diversity of the state’s population will also mean that many public institutions, especially schools, will serve a population that speaks a multitude of languages and has a wide range of cultural backgrounds. Currently, for example, more than one–third of students in kindergarten and first grade are English–language learners.
Return to Perspectives and Issues Table of Contents, 2008-09 Budget AnalysisReturn to Full Table of Contents, 2008-09 Budget Analysis