Analysis of the 2006-07 Budget BillLegislative Analyst's Office
|
Despite a slowdown in the final quarter of the year, the U.S. and California economies generally outperformed expectations in 2005, shrugging off soaring energy costs, rising interest rates, and the impacts of three major hurricanes on Gulf Coast states. Recent monthly data on spending, employment, and production suggest that the softness that occurred in late 2005 will be short-lived, and the economy will expand at a moderate pace in 2006 and 2007. This outlook is subject to significant downside risks, however, associated with the potential for further increases in energy prices and steeper-than-expected declines in the real estate market. The latter risk is of particular importance to California, where real estate markets showed some signs of weakening late last year.
Despite a marked slowdown in the final quarter of the year (when growth slowed to an annual rate of only 1.1�percent), real gross domestic product (GDP) still expanded by a solid 3.1�percent pace between the fourth quarter of 2004 and the fourth quarter of 2005. As indicated in Figure�1:
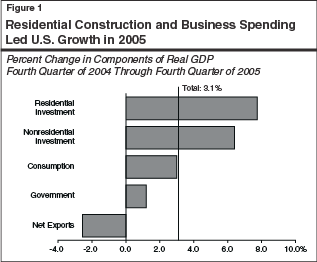
The fastest growing output categories were home building (referred to as residential investment) and business spending on computers, software, networks, other equipment, and new facilities (referred to as nonresidential investment).
Consumer spending increased by a respectable 3�percent during the year, reflecting over 3.5�percent increases during the first three quarters (seasonally adjusted annual rates) followed by a subdued 1.1�percent increase in the final quarter of the year. The marked slowdown in the year�s fourth quarter was concentrated in automobile sales, and was partly related to the expiration of vehicle incentive programs at the end of summer. Holiday sales grew moderately during December over the prior year.
Government spending rose 1.2�percent, reflecting modest increases at the federal, state, and local levels.
One factor that consistently depressed U.S. growth during 2005 was the expanding trade deficit, as imports from abroad continued to outpace our nation�s exports to foreign markets.
Although 2005�s fourth quarter slowdown caught many economists by surprise, monthly indicators released in January and early February of 2006 suggest that the U.S. economy will regain momentum. Positive indicators include rebounding car sales, major drops in initial claims for unemployment, and rising new orders for manufactured goods. In addition, surveys of both consumers and businesses in January found high confidence levels, improving business conditions, and increased hiring. While these conditions could quickly change in response to, for example, renewed increases in energy prices, they suggest that the economy is on an upward growth track as of early 2006.
World crude oil prices climbed sharply between late 2004 and summer 2005, pushed upward by supply disruptions and strong demand, particularly from China and other industrializing countries. Prices temporarily retreated in October and November of 2005, but then rebounded again in December of 2005 and January of 2006 when it was becoming apparent that consumption of oil was continuing to outpace new supplies.
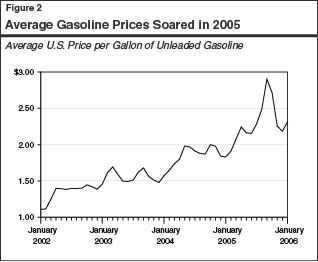
High crude oil prices, coupled with the damage to U.S. refineries caused by hurricanes Katrina and Rita, resulted in record gasoline prices in the nation. As indicated in Figure�2, the national average per-gallon price for unleaded gasoline increased from $1.83 in January 2005 to a peak of $2.90 in September 2005 (with many regions seeing prices well above $3 per gallon during the latter month), before retreating late in the year. Prices of aviation fuel and diesel also increased sharply, raising operational costs for fuel-dependent industries such as airlines and trucking. Prices of home heating fuel and natural gas also rose sharply during the year, further stretching the budgets of households across the nation.
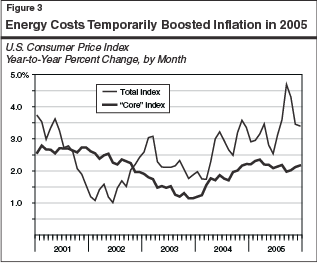
Perhaps the most pleasant surprise in 2005 was that the higher energy costs did not have the more widespread adverse impacts that some analysts had feared. While there were some negative effects on automobile sales and inflation during the second half of 2005, the impacts on the broader economy were relatively mild compared to those that rising energy prices had on economic growth and inflation 25 years ago. Increases in energy-related price components temporarily pushed the year-over-year increase in the U.S. consumer price index (CPI) to 4.7�percent in September 2005, but the growth in the index subsequently slowed late in the year (see Figure�3). The so-called �core� inflation rate (that is, the CPI excluding food and energy costs) never exceeded 2.3�percent during the year, indicating that the jump in energy costs did not �spill over� broadly into other sectors of the economy. Similarly, while higher energy prices stretched household budgets and curtailed spending on light trucks and SUVs, consumer expenditures outside of the automotive sector remained on an upward track for most of 2005.
The relatively mild impact of higher energy prices appears to be related to two main factors:
First, energy usage represents a much smaller share of the overall economy today than it did 25 years ago. For example, energy consumption per unit of GDP declined by over one-third between 1975 and 2000, reflecting both greater fuel efficiencies and a change in the composition of the economy away from manufacturing to services.
Second, strong productivity growth and intense competition have resulted in only a relatively small share of energy price increases being �passed along� in the form of higher product prices to consumers. This has translated into much smaller increases in general inflation and long-term interest rates than occurred in the 1970s and early 1980s.
While these factors have enabled the economy to avoid widespread problems so far, further energy-related price increases still pose a risk to future economic growth and inflation.
Job growth continued at a moderate pace in 2005. Total nonfarm payroll employment rose by 1.6�percent nationally, reflecting a 1.8�percent increase in private jobs and 1.1�percent growth in the government sector. Personal income increased by a solid 5.4�percent during the year, reflecting moderate increases in wages, and above-average increase in business-related earnings.
U.S. after-tax corporate profits increased by an estimated 34�percent in 2005, reflecting major gains in a wide variety of industries. Profits were boosted by changes in federal laws that provided for a temporary tax reduction on foreign earnings that were �repatriated� back into the U.S. by multinational companies. Even when these repatriated earnings are subtracted out, however, remaining profits were still up by more than 20�percent during the year. These gains reflect major increases in oil-related profits, as well as the ongoing benefits of high productivity and robust sales growth on businesses� bottom-line earnings. As noted in the Part III revenue section of this volume that follows, strong profit growth is clearly benefiting the state�s fiscal picture by boosting tax receipts from both corporate and personal income taxes.
As with the rest of the nation, California�s economy grew at a solid pace in 2005. Its growth was led by high levels of real estate sales, construction, and financing activity, but many other industries experienced healthy growth as well during the year. Some key indicators of recent state economic performance include the following:
Personal income was up by over 6.6�percent during the first three quarters of 2005 compared to the first three quarters of 2005, reflecting solid gains in both wage and nonwage income (such as business earnings and dividends). While we expect the year-over-year increase to be smaller in the final quarter once data become available (mainly because there were large one-time dividends paid in the fourth quarter of 2004), it appears that personal income growth for all of 2005 was only slightly less than 2004.
Estimated tax receipts from individuals and corporations were up nearly 25 percent in 2005, suggesting that profits and investment income were up sharply during the year.
Nonresidential building permit values totaled $18.2�billion in 2005, a 17�percent increase from the prior year. This increase was consistent with other signs of renewed strength in the nonresidential market, such as rising rents and falling vacancy rates for both commercial and industrial property across the state.
Consumer confidence, as measured by the January 2006 survey conducted by the Survey and Policy Research Institute at San Jose State University, was up sharply in January compared to the prior survey taken in October 2005. The increase was partly in response to the softening in gasoline prices late last year, but also reflected improving perceptions by respondents about business conditions and the employment outlook generally, as well as their own financial situations.
While all sectors of the state�s economy experienced economic growth during 2004 and most of 2005, the leading sector for this period was real estate. However, this sector showed definite signs of softening in the final quarter of the last year. As shown in Figure�4, the median price for existing home sales more than doubled between 2001 and mid-2005, but then dropped back late in the year. Similarly, permits for new residential construction activity dropped from nearly 220,000 (annual rate) during the first three quarters of 2005 down to 180,000 in the final three months of the year, with December falling to just 160,000 units. Other indicators pointing to a slowdown include fewer loan applications, rising inventories of homes on the market, and a slower pace of new building permit activity.
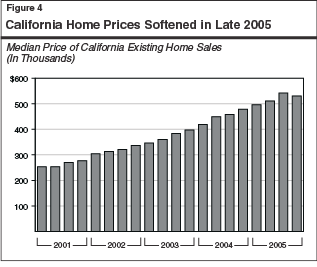
The late-2005 decline may have been exaggerated by unusually harsh weather and building code changes (which accelerated some permits from the fourth into the third quarter of last year). Our forecast assumes that the underlying housing trend, though falling, is less negative than the late 2005 performance would suggest. However, if the fourth quarter experience is indicative of a more disturbing underlying downward trend, the negative effects in terms of losses in wealth, income, and employment could be much more pronounced than we are assuming.
The discrepancy between two key surveys of employment that has been present through much of this decade widened markedly in 2005. As indicated in Figure�5:
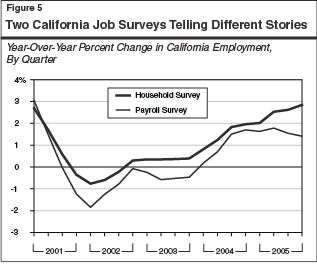
Based on the payroll survey of employers, total jobs increased at a moderate rate of about 1.4�percent between the fourth quarter of 2004 and the fourth quarter of 2005, roughly equaling the growth rate in the prior year. The payroll survey is based on responses of about 50,000 businesses that file withholding and unemployment insurance reports with state and federal agencies. This series, which does not include self-employed and contract workers, is used by economists and analysts to evaluate industry trends in employment.
According to the survey of households, jobs grew at a more robust rate of 2.7�percent during the same period. The household survey is based on monthly interviews by the U.S. Bureau of Labor Statistics to measure labor market characteristics, including the unemployment rate. It includes everyone who is working, including those who are self-employed.
Which Survey Is Correct? We believe that the �true� amount of job growth is probably closer to that portrayed by the household survey, for two reasons:
First, the payroll survey is based on larger, well-established firms, and often initially misses new jobs created by small and newly created businesses. To the extent that recent job growth has been in areas with significant numbers of small businesses (such as construction, financial services, and trade), it is probable that the payroll job totals will be revised up once these new jobs are captured in annual benchmark revisions (which are based on a complete count of employers) that are released for 2005.
Second, an increasing share of job growth in this expansion involves workers that are classified as self-employed, and thus are not covered in the payroll survey (but are being picked up in the household survey). This would include contract workers, consultants, real estate agents, and other independent contractors.
We would note that some of the self employed jobs included in the household survey may be of lesser quality in terms of wages earned, hours worked, and benefits received than similar-type jobs captured in the payroll survey. Despite this, however, we believe that the household survey is more consistent with other economic and revenue indicators suggesting that 2005 was generally a good year for California.
Jobs Performance by Industry. Figure�6 shows the increase in jobs reported by the payroll survey by major industry sector between December 2004 and December 2005. It shows:
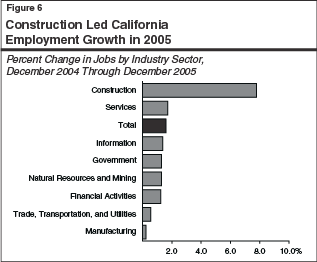
Construction was clearly the fastest growing sector, reflecting high levels of residential and nonresidential building, as well as a strong market for construction-related alterations and additions.
Most other industries expanded by 1�percent to 2�percent last year, as business hiring continued at a measured pace. Even manufacturing, which had been declining through the first four years of this decade, managed a small increase in 2005.
Jobs Performance by Region. Regionally, payroll employment growth was under 1.5�percent in both Southern California and the San Francisco Bay Area. It was a little stronger-over 2�percent-in the Central Valley and Central Coast regions. Regarding unemployment rates, these have declined across the state over the past two years, and now generally range from 4�percent to 5�percent in Southern California, the San Francisco Bay Area, and Sacramento. The rates are somewhat higher in the San Joaquin Valley counties, the Central Coast, and the rural areas of Northern California (due partly to the greater presence of seasonal jobs in agriculture in these areas). However, unemployment in these regions is also down significantly from prior-year levels.
Following a strong 21�percent gain in 2004, exports of goods produced by companies in California increased at a much more subdued rate of 6�percent in 2005. The slowing growth rate was largely due to a flattening in computers and electronics exports, which jumped 15�percent in 2004, but fell by 2�percent in 2005 (see Figure�7).
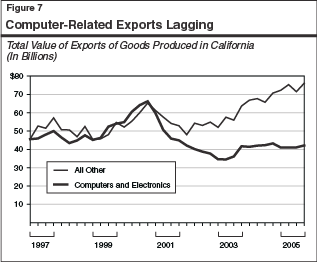
Although exports have jumped substantially over the past three years combined, they are still below the all-time peak of $120�billion reached in 2000. As shown in the figure, this is because the exports of computers and electronics products-which accounted for one-half of the total in 2000-fell sharply in 2001 and 2002, and have since only recovered a fraction of their losses. The drop in foreign shipments of computers and electronics is consistent with the decline in high-tech manufacturing activity that has taken place during the past several years. While the state remains a center for research, design, and development of information technology (IT) products, the production of such products has migrated to lower-cost locations both within the U.S. and abroad.
The budget�s economic forecast assumes that U.S. and California economic growth will subside but remain on track in 2006 and 2007, reflecting slowing consumer spending and less construction activity. Key elements of the administration�s forecast are displayed in Figure�8. The budget forecasts that real GDP growth will slow from 3.6�percent in 2005 to 3.2�percent in 2006, and further to 3�percent in 2007. The forecast assumes that inflation will retreat slightly from 3.5�percent in 2005, to 3.2�percent in 2006, and further to 2.4�percent in 2007. The inflation forecast assumes that energy-related prices will flatten in 2006 and drop slightly in 2007.
|
|
|||||
|
Figure 8 Summary of the Budget's Economic Outlook |
|||||
|
|
|
Estimate |
|
Forecast |
|
|
|
2004 |
2005 |
|
2006 |
2007 |
|
U.S. Forecast |
|
|
|
|
|
|
Percent change in: |
|
|
|
|
|
|
Real gross domestic product |
4.2% |
3.6% |
|
3.2% |
3.0% |
|
Personal income |
5.9 |
5.7 |
|
6.4 |
5.8 |
|
Wage and salary employment |
1.1 |
1.6 |
|
1.5 |
1.3 |
|
Consumer Price Index |
2.7 |
3.5 |
|
3.2 |
2.4 |
|
Unemployment rate (%) |
5.5 |
5.1 |
|
4.9 |
5.0 |
|
Housing starts (000) |
1,950 |
2,060 |
|
1,830 |
1,780 |
|
California Forecast |
|
|
|
|
|
|
Percent change in: |
|
|
|
|
|
|
Personal income |
6.6% |
6.0% |
|
5.8% |
5.5% |
|
Employment: |
|
|
|
|
|
|
Payroll survey |
0.9 |
1.4 |
|
1.3 |
1.3 |
|
Household survey |
1.5 |
2.4 |
|
1.5 |
1.4 |
|
Taxable sales |
8.5 |
5.3 |
|
4.9 |
5.0 |
|
Consumer Price Index |
2.6 |
3.9 |
|
3.6 |
3.0 |
|
Unemployment rate (%) |
6.2 |
5.3 |
|
5.1 |
5.2 |
|
New housing permits (000) |
213 |
219 |
|
197 |
183 |
|
|
|||||
The administration�s forecast assumes that California�s economy will generally grow in line with the rest of the nation. It projects that personal income-the broadest measure of state-level economic activity-will slow from a growth rate of 6�percent in 2005 to 5.8�percent in 2006, and further to 5.5�percent in 2007. The forecast assumes solid growth in a variety of services and trade industries, but a decline in construction activity.
Our updated economic outlook is similar to both the administration�s January budget forecast and our November 2005 fiscal forecast. We continue to expect the national and state economies will expand through the forecast period.
As shown in Figure�9, we forecast that real GDP growth will ease from 3.5�percent in 2005 to 3.3�percent in 2006, and further to 2.9�percent in 2007. The slowdown reflects a slightly slower pace in consumer spending and housing activity, partly offset by a slightly accelerated pace of business investment. Specifically:
|
|
|||||
|
Figure 9 Summary of the LAO's Economic Outlook |
|||||
|
|
Estimate |
|
Forecast |
||
|
|
2005 |
|
2006 |
2007 |
2008 |
|
U.S. Forecast |
|
|
|
|
|
|
Percent change in: |
|
|
|
|
|
|
Real gross domestic product |
3.5% |
|
3.3% |
2.9% |
3.0% |
|
Personal income |
6.3 |
|
5.7 |
5.5 |
5.9 |
|
Wage and salary employment |
1.6 |
|
1.5 |
1.4 |
1.2 |
|
Consumer Price Index |
3.4 |
|
2.6 |
2.2 |
2.4 |
|
Unemployment rate (%) |
5.1 |
|
4.8 |
4.9 |
5.0 |
|
Housing starts (000) |
2,077 |
|
1,984 |
1,808 |
1,760 |
|
California Forecast |
|
|
|
|
|
|
Percent change in: |
|
|
|
|
|
|
Personal income |
6.3% |
|
5.7% |
5.5% |
5.9% |
|
Employment: |
|
|
|
|
|
|
Payroll survey |
1.6 |
|
1.5 |
1.5 |
1.6 |
|
Household survey |
2.5 |
|
2.1 |
2.0 |
1.8 |
|
Taxable sales |
6.5 |
|
5.3 |
5.4 |
5.6 |
|
Consumer Price Index |
4.0 |
|
2.8 |
2.1 |
2.6 |
|
Unemployment rate |
5.4 |
|
5.2 |
5.4 |
5.5 |
|
New housing permits |
208 |
|
190 |
181 |
178 |
|
|
|||||
Real consumer spending is expected to slow from 3.5�percent in 2005 to 3�percent in 2006 and 2.9�percent in 2007. These increases are slightly less than the projected growth in real disposable income for the same period, as consumers focus over the next two years on reducing their outstanding debt burdens so as to lower their interest costs.
Real residential fixed investment is projected to fall by 3�percent in 2006, and by 7�percent in 2007. The decline is consistent with recent and projected slowdowns in home sales and new housing starts over the next two years.
Real nonresidential fixed investment is forecast to accelerate slightly from 8.8�percent growth in 2005 to 10.1�percent growth in 2006, before easing to a 6�percent growth in 2007. The pattern of growth over the next two years is distorted by the effects of regulatory changes on the timing of large truck sales. Absent these timing changes, the underlying increase is close to 8�percent in both years. This growth reflects strong spending for IT equipment by businesses seeking further productivity gains, and an acceleration in spending on structures by companies seeking to expand facilities. A key positive factor in the investment outlook is booming profits in recent years, which have provided businesses with large amounts of cash to support new spending on equipment and structures. The spending on IT equipment is a positive force in California�s outlook, because many high-tech products are designed in California.
The trade deficit is expected to expand in 2006, and then decline beginning in 2007. Although a weaker dollar is expected to boost exports by nearly 10�percent during each of the next two years, imports are likely to grow even faster in 2006, due to the high cost and increased volume of oil imports.
A key assumption in our economic forecast relates to energy prices. This is because, although recent increases have not substantially depressed economic activity so far, further increases could have that effect. We project that crude oil prices will average close to $60 per barrel in 2006, and then trend down slightly to $55 per barrel in the 2007-through-2009 period. Our outlook assumes that, while some of the recent price increases are driven by speculation, underlying market conditions will remain tight, as worldwide oil demand continues to grow and new supplies are slow to come on the market. We expect prices of gasoline to move in tandem with crude oil costs, with unleaded gasoline averaging $2.35 per gallon nationwide in 2006, and about $2.30 per gallon the following year.
Based on our assumption that energy costs will stabilize and then fall modestly over the next several years, we are forecasting that overall inflation will subside from recent levels. For example, growth in the U.S. CPI is projected to slow from 3.4�percent in 2005 to 2.6�percent in 2006, and further to 2.2�percent in 2007, as energy costs start to decline and nonenergy-related inflation holds steady in the 2 percent to 3�percent range. Factors holding down inflation include continued business productivity growth, moderate wage increases, and intense international competition.
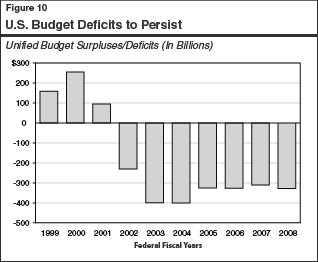
Our forecast for the nation assumes that large federal budget deficits will persist through the next decade despite sustained economic growth during the period. As shown in Figure�10, the federal budget moved from a surplus to deficit situation in 2002 following the stock market crash, economic downturn, tax reductions (which were aimed at boosting the economy out of the 2001 recession), spending related to Iraq, recent U.S. hurricanes, and expansions in the Medicare program. These deficits are projected to remain large throughout the next decade, despite ongoing economic expansion during the period. In the early years of this decade, the large deficits had a stimulative effect on the economy, as consumers and businesses spent their proceeds from the federal tax reductions. In the future, however, added financing costs associated with the federal debt will have some depressing effects on long-term economic growth.
We forecast that California�s economic growth will ease some in 2006 and 2007, but that the state�s economy will continue to expand during the next two years. A key assumption underlying our forecast is that the slowdown in real estate will not be dramatic, and that output and hiring in other industries will offset most of the softness in this sector. As shown earlier in Figure�9:
Personal income is projected to expand by 5.7�percent in 2006 and 5.5�percent in 2007, compared to 6.3�percent for 2005. Virtually all of the slowdown is related to more subdued growth in nonwage earnings, particularly business profits related to real estate. Wages, in contrast, are expected to grow at a steady pace during the next two years.
Payroll employment growth is projected to increase by 1.5�percent in 2006 and 2007, down slightly from the 1.6�percent gain in 2005. These moderate increases are slightly greater than the state�s adult population and labor force growth rates, which will result in a decline in the unemployment rate from 5.4�percent in 2005 to 5.2�percent in 2006.
Residential construction permits are projected to fall from 208,000 units in 2005, to 190,000 units in 2006, and 181,000 units in 2007, as higher interest rates, tighter lending standards, and slower sales take their toll on building activity during this year and the next.
Nonresidential permit valuations will continue to grow, from $17.7 billion in 2005 to over $20 billion in 2006, reflecting increases in both commercial and industrial building activity.
Taxable sales growth is expected to slow from 6.5�percent in 2005, to 5.3�percent in 2006 and 5.4�percent in 2007. The slowdown is related to less spending on residential building materials and a slight softening of consumer spending on home furnishings, automobiles, and other durable goods. Business investment-related spending is expected to remain strong during 2006 and 2007.
Key assumptions underlying our economic forecast are that (1) energy prices will hold near current levels, rather than rising significantly further in 2006 and 2007, and (2) California�s housing markets will experience only modest declines in sales, construction, and prices in 2006. Both of these assumptions are subject to risks.
As indicated earlier, the energy markets remain extremely tight, with little excess capacity worldwide. While our forecast assumes that a delicate balance between supply and demand will result in prices staying near current levels, one forecast risk is that unanticipated supply disruptions or faster-than-expected growth in demand could quickly translate into another round of energy price increases. Such a development would depress consumer discretionary incomes, put upward pressure on general inflation and interest rates, and ultimately result in a more pronounced slowdown in economic activity during the next year.
Our forecast assumes that the decline already underway in real estate will be orderly and limited in 2006, with sales rates, prices, and new construction activity falling by between 5�percent to 10�percent from 2005 levels. There is always the risk at such times, however, that rising mortgage rates and a tightening of lending standards will send the California housing markets into a steeper decline. Such a development would directly depress earnings and income in real estate-related industries, and indirectly affect many other areas of the economy, through the effects of lost wealth and income on sales, hiring, and confidence in the economy. Another type of risk involves the housing market sharply contracting to the extent that some of its past strength has reflected speculative behavior.
Illustration of Potential Downside Effects. As an indication of the potential reductions to our economic forecast that the above risks could produce, we have estimated the adverse impacts of a steeper-than-expected decline in the real estate sector using the following assumptions:
Permits for new home construction fall to around 140,000 units in both 2006 and 2007, instead of our baseline projections of 190,000 and 181,000 for the two years. (These lower levels would be comparable to the 148,000 average for 1996 through 2003, but still much higher than the 94,000 average for the 1991 through 1995 period.)
California median home prices and sales rates each fall by roughly 20�percent from their peak during the next two years, instead of the less than 10�percent declines assumed in our baseline forecast.
Under this alternative projection, we estimate that California personal income growth would fall from our baseline forecast by about 1.4�percentage points in 2006 (from 5.7�percent to 4.3�percent) and by about 2�percentage points in 2007 (from 5.5�percent to 3.5�percent). As discussed in Part III of this volume, reductions of this magnitude in our economic forecast would have substantial downward impacts on state General Fund revenues.
Figure�11 compares our economic forecasts for the nation and California to our November 2005 forecasts, as well as to a variety of other economic projections made in recent months by other forecasters. These include the projections made by the University of California, Los Angeles (UCLA) Business Forecast Project in December 2005, the consensus forecast published in the Blue Chip Economic Indicators (January 2006), the consensus outlook forecast in the Western Blue Chip Economic Forecast (February 2006), and the 2006-07 Governor�s Budget forecast.
|
|
|||
|
Figure 11 Comparisons of Recent Economic Forecastsa |
|||
|
(Percent Changes) |
|||
|
|
Forecast |
||
|
|
2005 |
2006 |
2007 |
|
United States Real GDP: |
|
|
|
|
LAO November |
3.7% |
3.3% |
3.0% |
|
UCLA December |
3.6 |
2.8 |
2.5 |
|
DOF January |
3.6 |
3.2 |
3.0 |
|
Blue Chip "Consensus"b January |
3.6 |
3.4 |
3.1 |
|
LAO February |
3.5 |
3.3 |
2.9 |
|
California Payroll Jobs: |
|
|
|
|
LAO November |
1.4% |
1.3% |
1.4% |
|
UCLA December |
1.6 |
1.1 |
0.8 |
|
DOF January |
1.4 |
1.3 |
1.3 |
|
Blue Chip Consensusc February |
1.6 |
1.5 |
1.2 |
|
LAO February |
1.6 |
1.5 |
1.5 |
|
California Personal Income: |
|
|
|
|
LAO November |
6.3% |
5.7% |
5.5% |
|
UCLA December |
6.2 |
5.2 |
4.5 |
|
DOF January |
6.0 |
5.8 |
5.5 |
|
Blue Chip Consensus c February |
5.9 |
5.9 |
5.6 |
|
LAO February |
6.3 |
5.7 |
5.5 |
|
California Taxable Sales: |
|
|
|
|
LAO November |
6.1% |
5.2% |
5.6% |
|
UCLA December |
6.9 |
5.1 |
4.0 |
|
DOF January |
5.3 |
4.9 |
5.0 |
|
Blue Chip Consensus c February |
5.2 |
5.6 |
5.7 |
|
LAO February |
6.5 |
5.3 |
5.4 |
|
|
|||
|
a Acronyms used apply to Legislative Analyst's Office (LAO); University of California, Los Angeles (UCLA); and Department of Finance (DOF). |
|||
|
b Average forecast of about 50 national firms surveyed in January by Blue Chip Economic Indicators. |
|||
|
c Average forecast of organizations surveyed in February by Western Blue Chip Economic Forecast. |
|||
|
|
|||
Our projections have not changed a great deal since November, and we are generally similar to those of the administration and most other forecasts shown in Figure�11. To varying degrees, all of the projections call for slowing growth over the next two years, with UCLA anticipating a bit more of a slowdown than other California forecasters.
California�s demographic trends both directly and indirectly affect the state�s economy, revenue collections, and expenditure levels. For example, they influence the size of the labor force, the demand for homes and automobiles, the volume of taxable sales, and the amount of income taxes paid. Similarly, the population and its age distribution affect school enrollments and public programs in many other areas, such as health care and social services. Consequently, the state�s demographic outlook is a key element both in estimating economic performance and in assessing and projecting the state�s budgetary situation.
Figure�12 summarizes our updated state demographic forecast. We project that California�s total population will rise from an estimated 37.5�million in 2006 to 38�million in 2007, and 38.5�million in 2008. These population projections use as their starting point published 2000 Census data for California and incorporate developments since then regarding births, deaths, and migration flows.
Slight Slowing Projected. The state�s population is projected to grow at an average rate of somewhat above 1.3�percent annually over the next three years. This is down slightly from the 1.5�percent average for the 2002 through 2005 period. Birth rates are forecast to stabilize at historically low levels, and net in-migration is projected to turn upward after having fallen for the past several years.
In numeric terms, the number of new Californians being added each year-about 505,000 people over the forecast interval-is above the size of such cities as Long Beach, Fresno, and Sacramento, and very similar to such states as Wyoming.
|
|
|||
|
Figure 12 Summary of the LAO�s California Demographic Forecast |
|||
|
(Population in Thousands) |
|||
|
|
2006 |
2007 |
2008 |
|
Total population (July 1 basis) |
37,480 |
37,987 |
38,508 |
|
Changes in population: |
|
|
|
|
Natural change (births minus deaths) |
306 |
306 |
307 |
|
Net in-migration (in-flows minus out-flows) |
182 |
202 |
214 |
|
Total changes |
488 |
508 |
521 |
|
Percent changes |
1.3% |
1.4% |
1.4% |
|
|
|||
California�s population growth can be broken down into two major components-natural increase (the excess of births over deaths) and net in-migration (persons moving into California from other states and countries, minus people leaving the state for other destinations). The population growth associated with natural increase accounts for about 60�percent of California�s projected annual growth over the forecast period and is assumed to be fairly stable. Net in-migration accounts for the other roughly 40�percent of the growth over the period, but has historically varied in response to changing economic conditions in the state.
Natural Increase. We project that the natural increase component will contribute an average of 307,000 new Californians annually over the forecast period. This reflects stable birth rates, but growth in the female population of child-bearing age groups.
Net In-Migration. This component dropped from 388,000 in 2001 to 179,000 in 2005, due mainly to a decline in net in-migration from other states. Specifically, net domestic in-migration from other states fell from a positive 97,000 in 2001 to a negative 29,000 in 2005, meaning that in 2005 more people left California for other states than moved into California from them. The decline in net domestic in-migration in recent years appears to reflect, to some degree, the impact of high home prices and a slower rate of hiring in California compared to past expansions. We expect net domestic in-migration to slowly turn positive during the next several years, but remain well below the levels realized in past economic expansions. Combined with our projections for steady rates of immigration from other countries, the slow increase in inflows from other states will result a modest rise in total in-migration over the next several years.
The implications of demographic trends for the budget depend not only on the total number of Californians, but also on their characteristics. California is well known for having one of the world�s most dynamic and diverse populations, including an increasingly rich ethnic mix and a large number of in-migrants. The state�s age and ethnic mix are shown in Figure�13.

The age-related characteristics of California�s population growth are especially important from a budgetary perspective, given their implications for such program areas as education, health care, and social services. Figure�14 shows our forecasts for both the percentage and numeric changes in different population age groups. The 45-to-64 age group (largely representing baby boomers) continues to be the fastest growing segment of the population. About 843,000 new people are expected to move into this age category over the next three years, as the tail-end of the baby boom generation moves into its mid-40s. In contrast, the leading edge of the baby boomers will be only 62 years of age by the end of the forecast period, and thus still occupants of this age category.
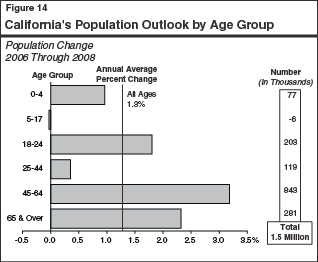
California�s continued population growth-including its age, ethnic, and migratory characteristics-can be expected to have many implications for the state�s economy and public services in 2006-07 and beyond. For example, strong growth of the 45-to-64 age group generally benefits tax revenues since this is the age category in which people normally earn their highest wages and salaries. Alternatively, the lack of growth statewide in the 5-to-17 age group translates into significant declines in enrollment for many school districts.
More general examples of demographic influences include the following:
Economic growth will benefit from an expanded labor force, due to a stronger consumer sector and the increased incomes that accompany job growth.
However, overall demographic growth will also produce additional strains on the state's physical and environmental infrastructure, including demands on the energy sector, transportation systems, parks, and water-delivery systems.
Similarly, the "graying" of the baby boomers will place strains on the state's health programs and related services, including the portion of Medi-Cal related to the elderly and disabled.
The increasing ethnic diversity of the state's population will also mean that many public institutions, especially schools, will serve a population that speaks a multitude of languages and has a wide range of cultural backgrounds. Currently, for example, more than one-third of students in kindergarten and first grade are English language learners.