Analysis of the 2005-06 Budget BillLegislative Analyst's Office
|
The Governor's budget proposes total spending in 2005-06 of $109 billion, including $85.7 billion from the state's General Fund and $23.3 billion from its special funds (see Figure 1). This total budget-year spending is $4.6 billion higher than current-year spending—an increase of 4.4 percent. Of total budget-year spending, General Fund spending accounts for about 79 percent. Proposed spending translates into $2,910 for every man, woman, and child in California.
|
Figure 1 Governor's Budget Spending Totals |
||||
|
(Dollars in Millions) |
||||
|
|
|
|
Change |
|
|
|
2004‑05 |
2005‑06 |
Amount |
Percent |
|
Budget Spending |
|
|
|
|
|
General Fund |
$82,295 |
$85,738 |
$3,443 |
4.2% |
|
Special fundsa |
22,091 |
23,270 |
1,179 |
5.3 |
|
Totals |
$104,386 |
$109,008 |
$4,622 |
4.4% |
|
Detail may not add due to rounding. |
||||
|
a Does not include Local Public Safety Fund expenditures of $2.5 billion in 2004‑05 and $2.7 billion in 2005‑06. These amounts are not shown in the Governor's budget. |
||||
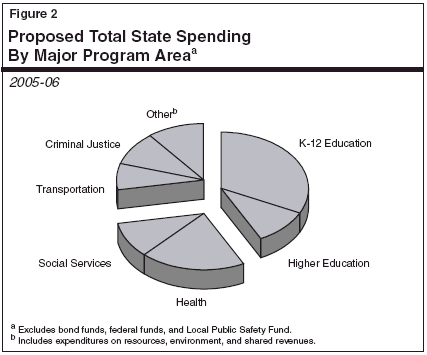
Figure 2 shows the allocation of the proposed $109 billion of total state spending in 2005-06 among the state's major program areas. Both General Fund and special funds expenditures are included in order to provide a meaningful comparison of state support among broad program categories, since special funds provide the bulk of support in some areas (such as transportation).

The figure shows that K-12 education receives the largest share of total spending—about 32 percent of the total. (It also should be noted that K-12 education spending receives additional funding from local sources.) When higher education is included, education's share rises to almost 43 percent. Health and social services programs account for about 30 percent of proposed total spending, while transportation and criminal justice together account for roughly 17 percent. The "other" category (10 percent) includes general-purpose fiscal assistance provided to local governments in the form of shared revenues.
Background. The General Fund is the main source of support for state programs, funding a wide variety of activities. For example, it is the major funding source for K-12 and higher education programs, health and social services programs, youth and adult correctional programs, and tax relief.
Proposed Spending. As shown in Figure 3, the Governor proposes General Fund spending of $85.7 billion for 2005-06. General Fund spending would rise by $3.4 billion from 2004-05, or 4.2 percent, reflecting decreases in some areas and increases in others. Specifically:
|
Figure 3 General Fund Spending by Major Program Area |
||||
|
(Dollars in Millions) |
||||
|
|
|
|
Proposed for 2005‑06 |
|
|
|
Actual |
Estimated |
Amount |
Percent |
|
Education Programs |
|
|
|
|
|
K-12 Proposition 98 |
$28,154 |
$30,992 |
$33,117 |
6.9% |
|
Community Colleges Proposition 98 |
2,272 |
3,036 |
3,321 |
9.4 |
|
UC/CSU |
5,527 |
5,212 |
5,413 |
3.9 |
|
Other |
2,159 |
4,559 |
4,076 |
-10.6 |
|
Health and Social Service Programs |
|
|
|
|
|
Medi-Cal |
$9,879 |
$11,965 |
$12,948 |
8.2% |
|
CalWORKs |
2,064 |
2,146 |
1,940 |
-9.6 |
|
SSI/SSP |
3,123 |
3,444 |
3,523 |
2.3 |
|
In-Home Supportive Services |
1,091 |
1,184 |
1,024 |
-13.5 |
|
Other |
6,605 |
6,805 |
7,273 |
6.9 |
|
Youth and Adult Corrections |
$5,389 |
$6,933 |
$7,014 |
1.2% |
|
All Other |
$10,069 |
$6,021 |
$6,089 |
1.1% |
|
Totals |
$76,333 |
$82,295 |
$85,738 |
4.2% |
Background. Special funds are used to allocate certain tax revenues (such as gasoline and certain cigarette tax receipts) and various other income sources (including many licenses and fees) for specific functions or activities of government designated by law. In this way, they differ from General Fund revenues, which can be spent by the Legislature for any purpose. Over one-third of the special funds revenues come from motor vehicle-related levies, another one-sixth comes from sales taxes, and the remainder come from numerous sources, including a new 1 percent surcharge on personal income taxes, tobacco taxes, charges, and fees.
Proposed Spending. In 2005-06, the Governor proposes special funds spending of $23.3 billion (see Figure 4). This is a 5.3 percent increase from the current-year total of $22.1 billion. As indicated in the figure, this increase reflects 13 percent growth in state transportation-related programs (accounting for two-thirds of the total year-to-year increase) and an 8.3 percent increase in subventions to local governments for various purposes, such as transportation and the 1991 realignment of health and social services programs. The above-average increases in transportation and local subventions are related to an assumed repayment of a loan from the Traffic Congestion Relief Fund. This repayment is contingent on the sale of a tribal gaming bond in 2005-06. Resources-related spending and funding for the Public Utilities Commission would decline, and spending in all other areas is proposed to remain flat.
|
Figure 4 Special Funds Spending by Major Program Area |
||||
|
(Dollars in Millions) |
||||
|
|
|
|
Proposed for 2005‑06 |
|
|
|
Actual |
Estimated |
Amount |
Percent |
|
Transportation |
$5,456 |
$5,818 |
$6,601 |
13.4% |
|
Local government subventions |
5,288 |
5,504 |
5,963 |
8.3 |
|
Resources related |
2,062 |
2,620 |
2,572 |
-1.9 |
|
Public Utilities Commission |
1,085 |
1,230 |
1,203 |
-2.2 |
|
All other |
5,001 |
6,918 |
6,931 |
0.2 |
|
Totals |
$18,892 |
$22,091 |
$23,270 |
5.3% |
It should be noted that the budget's special funds spending totals for 2005-06 exclude expenditures of roughly $2.7 billion from the Local Public Safety Fund (LPSF). Such spending is also excluded from the current-year and prior-year totals. Our view is that LPSF revenues are state tax revenues expended for public purposes. This treatment is consistent with how the budget treats other dedicated state funds, such as the Motor Vehicle License Fee Account (which, like the LPSF, is constitutionally dedicated to local governments) and the Cigarette and Tobacco Products Surtax Fund (Proposition 99), both of which the budget does include in its spending totals. However, although we believe that such spending does constitute state spending, we do not include it in our figures in order to facilitate comparisons with the budget's figures.
In addition to the $109 billion of proposed 2005-06 spending from the General Fund and special funds, the budget also proposes $55 billion in spending from federal funds and another $2.7 billion from bond proceeds. If expenditures from bond proceeds and federal funds are included in total state spending, proposed 2005-06 spending exceeds $166 billion.
As noted above, about $55 billion in federal funds are proposed to be spent through the state budget in 2005-06. (This is about one-fourth of the roughly $200 billion in total federal funds allocated to California. The remaining three-fourths are allocated directly to local governments, businesses, or individuals within the state.) About $29 billion (53 percent) of the total federal funds in the budget are for various health and social services programs, such as Medi-Cal, CalWORKs, and IHSS. Education receives another $14 billion (26 percent) of the total (split fairly evenly between K-12 and higher education), and transportation is expected to receive $2.5 billion (5 percent).
Budgetary Treatment. Bonds are primarily sold by the state to finance large capital outlay projects, such as school facilities, water projects, and state buildings. From a budgetary perspective, the cost of bond programs is reflected when the actual debt-service payments (comprised of bond-related principal and interest payments) are made. For 2005-06, the budget proposes General Fund debt-service expenditures of $4 billion, of which $3.3 billion is for general obligation bonds and $655 million is for lease-revenue bonds.
Although this way of treating bonds makes sense from a budgetary standpoint, tracking bond fund expenditures themselves still is useful as an indication of the actual volume of "brick and mortar" activities that is taking place with respect to capital projects.
Spending of General Obligation Bond Proceeds. The January budget proposal estimates that the state will spend $2.7 billion in general obligation bond proceeds for capital projects in 2005-06. This is down sharply from the $15.1 billion in spending shown for the current year, and $7 billion in the prior year. The comparatively larger amounts in the current- and prior year are related to the allocation of recently approved K-12 education bonds to specific school district projects.
Spending of Lease-Revenue Bond Proceeds. In addition to general obligation bonds, the state also uses lease-revenue bonds to finance the construction and renovation of capital facilities. Lease-revenue bonds do not require voter approval, and their debt service is paid from annual lease payments made by state agencies using the facilities financed by the bonds (funded primarily through General Fund appropriations). For 2005- 06, the budget proposes $145 million in spending from lease-revenue bond proceeds for such purposes as construction of state buildings.
In addition to borrowing for capital outlay purposes, the state has undertaken significant borrowing in recent years to help address budgetary shortfalls. We refer to this as budgetary borrowing. In November, we indicated that the state had accumulated $26 billion of outstanding budget-related debt, consisting of (1) $18 billion in bonds (including deficit financing, tobacco, and planned pension obligation bonds), $4 billion in loans from local governments and schools, and (3) $4 billion in loans from transportation-related and other special funds. As we discuss in Figure 2 of "Part I," the proposed 2005-06 budget would result in an additional $3.5 billion in budgetary borrowing. Taking into account scheduled repayments of previously sold bonds, the amount of budget-borrowing outstanding would be around $29 billion at the conclusion of 2005-06.
Scheduled repayments of this budgetary borrowing will result in annual General Fund costs of roughly $4 billion in the 2006-07 through 2008-09 fiscal years (as major loans from transportation and local governments are repaid), and about $2 billion thereafter. The administration has proposed a Constitutional amendment that would stretch out payment of some of these obligations for 15 years. This proposal would reduce General Fund costs in 2007-08 and 2008-09 (by lengthening the time frame during which transportation and local government loans are repaid), but raise them thereafter as the deferred payments come due. As discussed in "Part V," the proposal to defer transportation loan repayments would further delay transportation projects.
Background. In 1979, California's voters established a state appropriations limit (SAL) when they approved Proposition 4. The SAL places an "upper bound" on the amount of tax proceeds that the state can spend in any given year and grows annually by a population and cost-of-living factor. Most state appropriations are subject to the SAL; however, certain appropriations are exempt—including those for subventions to schools and local governments, capital outlay, and tax relief. If actual tax proceeds exceed the SAL over a two-year period, the excess must be divided among taxpayer rebates and Proposition 98 education funding.
Expenditures Projected to Be Below Limit. Due to the downturn in the state's economy and its adverse affects on the state's revenues in the early years of this decade, the budget's proposed expenditures are well below the SAL in both the current and budget years. In 2004-05, appropriations subject to the limit are $9.4 billion below the limit. In 2005-06, the administration's estimate of this gap expands to $9.7 billion.
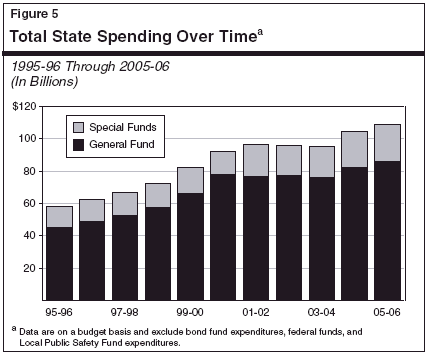
Total Spending. Figure 5 shows that total state spending increased by 25 percent between 1995-96 and 1998-99, and then jumped by another 33 percent between 1998-99 and 2001-02. In contrast, spending has been relatively flat since 2001-02. Over the full ten-year period, total spending is up $51 billion (88 percent), for an average annual growth rate of 6.5 percent.

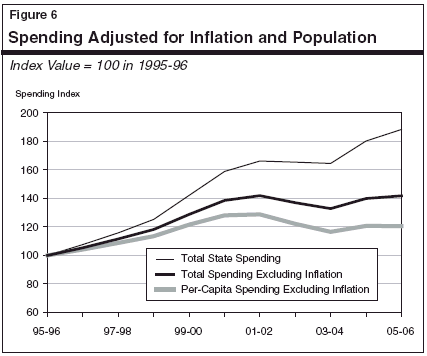
Real Per-Capita Spending. Figure 6 shows total state spending adjusted for inflation and population. It indicates that:

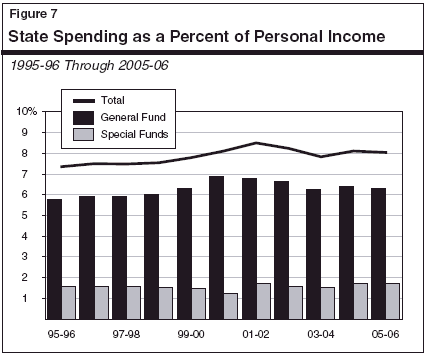
Spending in Relation to State's Economy. Figure 7 shows how state spending has varied over recent years as a percentage of total California personal income (which is a broad indicator of the size of the state's economy). From 1995-96 through 2001-02, total state spending increased steadily as a share of personal income—from 7.3 percent to 8.5 percent. Growth in General Fund spending accounted for nearly all of the increase.

After 2001-02, however, total state spending as a percentage of personal income reversed direction, and dropped to 7.8 percent in 2003-04. There are numerous one-time factors leading to the decline in 2003-04, including an accounting change to Medi-Cal, increased federal funds (which temporarily offset state spending), and savings related to a re structuring of debt-service payments. The ratio is projected to be in the 8 percent range for both 2004-05 and 2005-06.