Analysis of the 2004-05 Budget BillLegislative Analyst's Office
|
Funding for capital outlay in the budget year totals almost $1.6 billion. This spending is funded almost exclusively (95 percent) from bond proceeds. Over 85 percent of the proposed spending is for higher education facilities.
The 2004-05 Governor's Budget proposes approximately $1.6 billion for capital outlay programs (excluding highway and rail programs, which are discussed in the "Transportation" chapter of this Analysis). This is spending on physical assets—such as college buildings, state parks, prisons, and office space. The Governor's plan would authorize General Fund expenditures of around $33 million and spending of nearly $1.5 billion from general obligation and lease-revenue bonds. Figure 1 summarizes the proposed 2004-05 capital outlay program. The proposed plan represents a decrease of over $600 million (29 percent) from current-year spending.
|
State Capital
Outlay Program |
|||
|
2003-04 and
2004-05 (In Millions) |
|||
|
|
Estimated |
Proposed |
Difference
|
|
Legislative,
Judicial, and Executive |
$0.4 |
|
-$0.4 |
|
State
and Consumer Services |
219.3 |
$4.7 |
-214.6 |
|
Business,
Transportation, and Housing |
22.9 |
9.2 |
-13.6 |
|
Resources
|
433.7 |
65.5 |
-368.2 |
|
Health
and Human Services |
123.9 |
0.6 |
-123.3 |
|
Youth
and Adult Corrections |
288.6 |
21.6 |
-267.0 |
|
Education
|
5.6 |
69.9 |
64.3 |
|
Higher
Education |
1,055.4 |
1,375.8 |
320.4 |
|
General
Government |
45.2 |
32.9 |
-12.3 |
|
Totals |
$2,194.9 |
$1,580.3 |
-$614.7 |
The Governor's budget indicates that the administration is currently evaluating various alternatives to reorganize and streamline existing conservation efforts in the natural resources area. Consequently, the Governor's budget has deferred the appropriation of some general obligation bond funds in the natural resources area until spring. (We discuss issues related to the resources bond in the "Crosscutting Issues" section of the "Resources" chapter of this Analysis.)
The Governor's budget proposes funding the capital outlay program primarily from general obligation and lease-revenue bonds. Other fund sources include the General Fund, special funds, and federal funds. Figure 2 compares the sources of funds for the 2003-04 capital outlay program to those proposed for 2004-05. The budget proposes increasing the amount for direct appropriations from the General Fund by nearly $9 million and decreasing the amount from special funds by around $59 million. With regard to bond appropriations, the budget includes $1.3 billion from general obligation bonds and $143 million from lease-revenue bonds.
|
Sources of Funds
for Capital Outlay Program |
||
|
(In
Millions) |
||
|
|
Governors
Budget |
|
|
Funds |
2003-04 |
2004-05 |
|
General Fund |
$23.7 |
$32.6 |
|
General
obligation bonds |
1,340.2 |
1,356.8 |
|
Lease-revenue
bonds |
712.4 |
142.9 |
|
Special funds
|
93.6 |
34.5 |
|
Federal funds
|
25.1 |
13.3 |
|
Totals |
$2,194.9 |
$1,580.3 |
Figure 3 shows the amounts included in the Governor's budget for each department and the future cost for these projects. As shown in the figure, approximately $1.3 billion will need to be appropriated in the future to complete these proposed projects. Thus, the request before the Legislature represents a total cost of roughly $2.9 billion. Of that total, over three quarters is for higher education—with almost all from general obligation bonds.
|
2004-05 Capital
Outlay Program |
|||
|
All Funds (In
Thousands) |
|||
|
Department |
Proposed |
Future
Cost |
Total |
|
State
and Consumer Services |
|||
|
General
Services (seismic) |
$4,653 |
|
$4,653 |
|
Business,
Transportation, and Housing |
|||
|
Transportation |
$100 |
|
$100 |
|
Highway
Patrol |
250 |
|
250 |
|
Motor
Vehicles |
8,863 |
$30,800 |
39,663 |
|
Resources
|
|||
|
Tahoe
Conservancy |
$1,192 |
|
$1,192 |
|
Conservation
Corps |
29 |
$583 |
612 |
|
9,256 |
|
9,256 |
|
|
1,133 |
|
1133 |
|
|
Wildlife
Conservation Board |
21,500 |
|
21,500 |
|
Boating
and Waterways |
2,288 |
|
2,288 |
|
Coastal
Conservancy |
7,200 |
|
7,200 |
|
Parks
and Recreation |
22,676 |
1,599 |
24,275 |
|
Water
Resources |
270 |
|
270 |
|
Health
and Human Services |
|||
|
Health
Services |
$200 |
|
$200 |
|
Mental
Health |
429 |
$4,832 |
5,261 |
|
Youth
and Adult Corrections |
|||
|
Corrections |
$18,840 |
$412,950 |
$431,790 |
|
Youth
Authority |
2,750 |
|
2,750 |
|
Education |
|||
|
Department
of Education |
$69,948 |
|
$69,948 |
|
Higher
Education |
|||
|
University
of California |
$394,436 |
$409,027 |
$803,463 |
|
Hastings
College |
18,758 |
|
18,758 |
|
California
State University |
345,000 |
263,611 |
608,611 |
|
Community
Colleges |
617,592 |
202,289 |
819,881 |
|
General
Government |
|||
|
Food
and Agriculture |
$19,653 |
|
$19,653 |
|
Military |
12,251 |
|
12,251 |
|
Unallocated
Capital Outlay |
1,000 |
|
1,000 |
|
Totals |
$1,580,267 |
$1,325,691 |
$2,905,958 |
Figure 4 displays the proposed spending for each department, by funding source.
|
2004-05 Capital
Outlay Program |
||||||
|
(In Thousands) |
||||||
|
Department |
GO
Bonds |
LR
Bonds |
General
|
Special
|
Federal
|
Total
|
|
State
and Consumer Services |
||||||
|
General
Servicesseismic |
$4,653 |
|
|
|
|
$4,653 |
|
Business,
Transportation, and Housing |
||||||
|
Transportation
|
|
|
|
$100 |
|
$100 |
|
Highway
Patrol |
|
|
|
250 |
|
250 |
|
Motor
Vehicles |
|
|
|
8,863 |
|
8,863 |
|
Resources
|
||||||
|
Tahoe
Conservancy |
|
|
|
$1,192 |
|
$1,192 |
|
Conservation
Corps |
|
|
$29 |
|
|
29 |
|
Forestry
and Fire Protection |
|
$5,150 |
4,106 |
|
|
9,256 |
|
Fish
and Game |
$203 |
|
|
930 |
|
1,133 |
|
Wildlife
Conservation Board |
21,000 |
|
|
500 |
|
21,500 |
|
Boating
and Waterways |
|
|
|
2,288 |
|
2,288 |
|
Coastal
Conservancy |
1,348 |
|
|
3,852 |
$2,000 |
7,200 |
|
Parks
and Recreation |
8,836 |
|
|
9,740 |
4,100 |
22,676 |
|
Water
Resources |
|
|
270 |
|
|
270 |
|
Health
and Human Services |
||||||
|
Health
Services |
|
|
$200 |
|
|
$200 |
|
Mental
Health |
|
|
429 |
|
|
429 |
|
Youth
and Adult Corrections |
||||||
|
Corrections
|
|
|
$18,840 |
|
|
$18,840 |
|
Youth
Authority |
|
|
2,750 |
|
|
2,750 |
|
Education
|
||||||
|
Department
of Education |
|
$69,948 |
|
|
|
$69,948 |
|
University
of California |
$339,436 |
$55,000 |
|
|
|
$394,436 |
|
Hastings
College |
18,758 |
|
|
|
|
18,758 |
|
California
State University |
345,000 |
|
|
|
|
345,000 |
|
Community
Colleges |
617,592 |
|
|
|
|
617,592 |
|
General
Government |
||||||
|
Food
and Agriculture |
|
$12,824 |
|
$6,829 |
|
$19,653 |
|
Military
|
|
|
$5,004 |
|
$7,247 |
12,251 |
|
Unallocated
CO |
|
|
1,000 |
|
|
1,000 |
|
Totals |
$1,356,826 |
$142,922 |
$32,628 |
$34,544 |
$13,347 |
$1,580,267 |
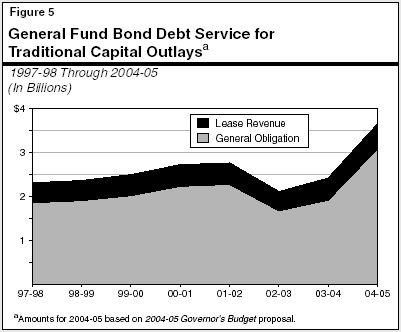
As shown in Figure 5, the state's General Fund debt-service expenditures for bonds that support traditional capital outlay projects are projected to total $3.6 billion in 2004-05. This is up about $1.2 billion from the current-year level. Most of the increase is related not to more outstanding bonds, but to the deferral of roughly $900 million in annual debt-service principal payments in both 2002-03 and 2003-04 to help deal with the state's budget shortfall. The budget-year debt-service total consists of $3.1 billion related to general obligation bonds, and about $520 million related to lease-revenue bonds.

The Governor's 2004-05 spending plan contains an additional $1.25 billion in debt-service costs related to the $15 billion economic recovery bond authorized by Proposition 57, under the assumption that it will be approved by the voters in March 2004. This annual debt-service amount increases moderately in subsequent years. In 2005-06, the state would also incur $56 million in debt-service costs related to the budget's proposed pension obligation bond sale.
In evaluating a state's capacity for bonded indebtedness and the impact of debt-service costs on its budget, one of the many factors that bond raters and potential investors look at is the state's debt-service ratio (DSR). This ratio is defined as the share of annual General Fund revenues that are devoted to principal and interest payments on General Fund-backed debt. There is no agreed-upon single ratio that fits all states, and the appropriate ratio for an individual state can vary depending on such factors as its need and preference for new infrastructure. As a general rule, however, a ratio in the general range of 6 percent or less has been recognized as a reasonable level for states.
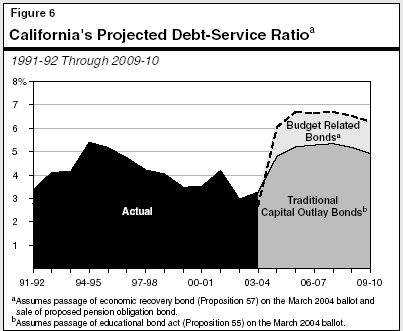
As shown in Figure 6, California's DSR peaked in the mid-1990s at about 5.4 percent. It then declined through the second half of the decade. The ratio fell to about 3 percent in 2002-03 reflecting the deferral of debt payments discussed above.

Assuming approval of the education bonds on the March 2004 ballot, we estimate that the DSR would increase to about 5.3 percent in 2006-07 as authorized bonds are sold off, and then start to decline. If the annual General Fund costs associated with the economic recovery bond (Proposition 57, also on the March 2004 ballot) and the proposed pension obligation bond are included, the ratio would increase to about 7 percent in 2005-06 and remain at that level for the subsequent two years before starting to drift downward.
If debt service related to budgetary borrowing is included, the state's DSR will rise significantly above its historical levels in the next year. The ratio will also be above the 6 percent general guideline noted above. Although we believe California would still have access to the credit markets, this could make it somewhat more costly for the state to undertake additional borrowing for traditional infrastructure needs in the near future. Regardless of the DSR's level, it is important to emphasize that the principal concern of the investment community and bond rating agencies at this time is not California's debt ratio per se. Rather, the state's continued budget difficulties are the primary factors cited in recent rating downgrades. Thus, the main concern amongst investors is the underlying need for California's budgetary borrowing in the first place—namely, its persistent budget deficit. California's progress toward eliminating its projected budget shortfall will be the main factor affecting the state's bond ratings and ability to market additional debt at reasonable costs in the future